What is cycle time in software development?
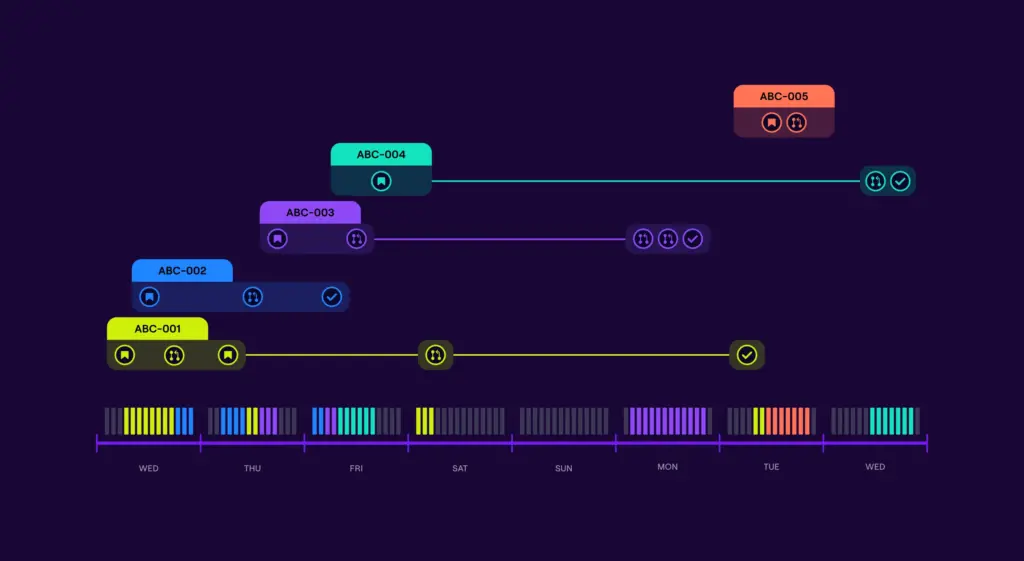
Cycle time, by its broadest definition, is an operational metric that measures of how long it takes to complete a certain type of work. When speaking about cycle time in software development, it’s usually referred to in the context of issue cycle time which is the time elapsed between the start of work on an issue to resolution. In this definition, the start of work is indicated by when an engineer marks an issue as “in progress” within an issue tracking software (such as Jira). The resolution is determined by when the issue is marked as resolved. This concept can be applied to epics (called epic cycle time), or any other category of engineering work used in issue tracking software.
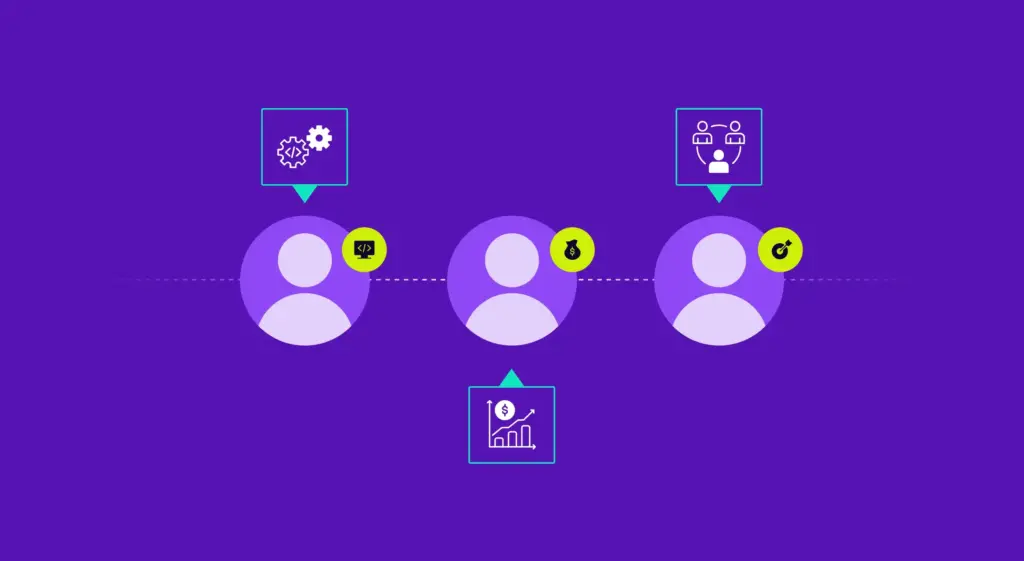
In data-driven engineering management (also referred to as engineering analytics), issue cycle time is used by engineering leaders and teams to gauge how fast teams are able to move through issues. Operational metrics such as issue cycle time are most commonly used to measure the efficiency and velocity of an engineering team. By this definition, issue cycle time can be measured at an organizational, team, and individual level in tools such as an Engineering Management Platform.
How to calculate issue cycle time
The issue cycle time calculation is relatively straightforward. Average issue cycle time is calculated by averaging the total time (in days) for completion of all issues within an issue tracker in a given time period and group. For example, a team can have an average issue cycle time of 5.4 days during March but average an issue cycle time of 7.2 over the entire first quarter of the calendar year. This example would signal that the team was moving slower through work towards the beginning of the quarter. In this instance, a leader might inquire as to what changes a team made to their process in order to work through issues faster.
By compiling a list of issues started across engineers within the group, teams can calculate their issue cycle time. As organizations grow and engineering operations become more complex, issue cycle time can become more difficult and time-consuming to calculate. Increasing engineering headcount and multiple Jira instances are the primary factors that complicate measuring issue cycle time.
Why is issue cycle time a staple?
Issue cycle time has become a staple operational metric for engineering teams because it seeks to quantify the length of the software development process most often associated with “engineering speed.” As it is a very high-level metric, most data-driven leaders use it to gauge overall trends amongst the teams and dig deeper with follow-up questions. Some examples of the types of questions leaders might ask as issue cycle times increase include:
- Are code reviews taking a while to get done?
- Is work being scoped appropriately?
- Is there additional tooling that could help certain processes and teams?
- Were there unanticipated challenges in recent project work? Is there a common factor driving delays?
- Are teams frequently context switching and unable to spend focus time on the work they’ve committed to?
The answers to these questions help engineering leaders understand how to better support their teams and improve their engineering operations.
Limitations in issue cycle time
Issue cycle time is popular within the engineering leadership community for many reasons, but it’s not without its limitations. Like many operational metrics in software engineering, Jira data hygiene plays a critical role in the accurate measurement of issue cycle time. If developers and engineers are not marking tasks appropriately in their issue tracking software, this can lead to inaccuracies and affect operational decision-making.
Additionally, issue cycle time does not reveal size and scope of work, or number of projects and other work an engineer has been assigned. Larger and more complex issues should be expected to take longer to complete, and often it is the case that more experienced engineers will pick up these issues. Therefore it can become dangerous to compare issue cycle times, and it would be a mistake to assume longer issue cycle times are by default bad. That said, it’s still an insightful metric. For example, in many cases developers are pulled into multiple work streams and must spread their time across multiple issues, meetings, and other work. Engineering managers who notice issue cycle times for an individual trending up might check to see whether that developer is spread too thin, feeling burdened, or otherwise having trouble.
There’s can also be deeper conceptual challenges associated with issue cycle time. Some adopters of data-driven engineering have placed such great value on the metric that their teams focus on improving it too much. Like all metrics, issue cycle time should not be taken in isolation. It requires follow-up and context to be fully understood, particularly in scenarios where teams are incentivized to decrease their cycle times. When decreasing the metric becomes the sole priority, one of two outcomes can happen:
- Teams prioritize achieving lower cycle times by breaking down issues into smaller chunks. Of course, this is usually a very positive outcome; breaking down issues into smaller chunks is a key tenant of Agile development. But it’s important to note that this creates the illusion of speed without the actual desired outcome of outputting more work.
- The teams don’t re-scope work and prioritize speed over other aspects such as quality, collaboration, overall productivity, and the general development process.
Jellyfish and issue cycle time
We highly recommend measuring cycle time to understand the impact of engineering operational changes. It’s one of the four Process KPIs that we believe are core to a data-driven engineering team’s toolkit. Ultimately, when incorporated into a balanced metric strategy, it can be an invaluable measure of how fast you’re teams are able to deliver value. Historical cycle time data is often used to make predictions about how long similarly scope work will take to complete. Issue cycle time, average issue cycle time, and average epic cycle time, are just a few metric variations that can be found in the Jellyfish Engineering Management Platform. If you’re curious about the other metrics that Jellyfish can measure, check out our product tour today.


