Elite
Average
Needs Focus
Jellyfish
Improvement

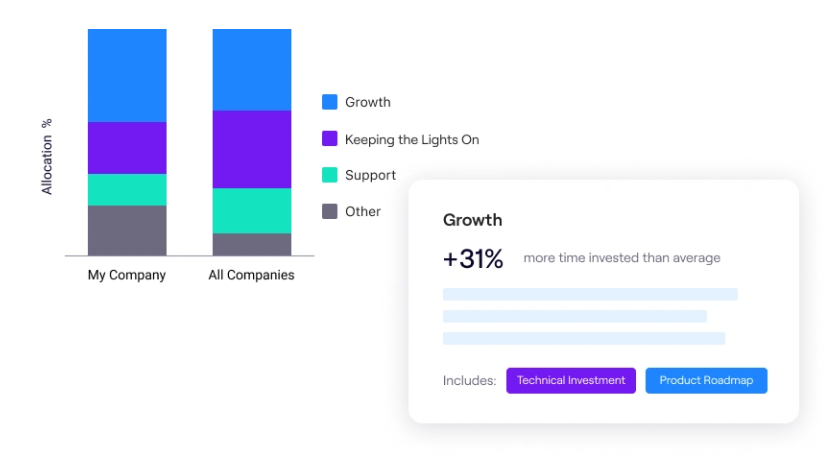
Innovation Allocation
How much of your team’s time is devoted to innovation: new features, roadmap, the work that moves the business forward?
48%+
Team Hours
20-47%
Team Hours
<20%
Team Hours
+31%

Issue Cycle Time
How much time elapses between the start and the resolution of work for a single issue on average? What is the tempo of your development process?
<8
Days
9-14
Days
15+
Days
-23%

Deployment Frequency
How frequently are changes deployed to production? This is a key DORA metric for measuring the strength of a continuous delivery pipeline.
1+
Day
1+
Week
<1
Week
+18%

Coding Days
How many days per week does each person commit code on average? Coding days can be a great representation of how focused a team is.
2+
Days
1.3-1.9
Days
<1.2
Days
+8%

Issues Resolved
How many issues did each engineer on the team resolve? What is the volume of work the team is accomplishing?
3.2+
Issues/Week
1.6-3.1
Issues/Week
<1.5
Issues/Week
+15%

PR Reviews
What was the total number of reviews on Pull Requests during a given time period? This metric is one measure of how engaged an engineer is.
3.0+
Reviews/Week
1.6-2.9
Reviews/Week
<1.5
Reviews/Week
+10%

Planning Accuracy
What is the ratio of planned work vs. unplanned work? How well can the team plan, and how predictable is the team’s execution?
91%+
Accuracy
63-90%
Accuracy
<62%
Accuracy
+16%
Innovation Allocation
How much of your team’s time is devoted to innovation: new features, roadmap, the work that moves the business forward?
Elite
48%+
Team Hours
Average
20-47%
Team Hours
Needs Focus
<20%
Team Hours
Jellyfish Improvement
+31%
Issue Cycle Time
How much time elapses between the start and the resolution of work for a single issue on average? What is the tempo of your development process?
Elite
<8
Days
Average
9-14
Days
Needs Focus
15+
Days
Jellyfish Improvement
-23%
Deployment Frequency
How frequently are changes deployed to production? This is a key DORA metric for measuring the strength of a continuous delivery pipeline.
Elite
1+
Day
Average
1+
Week
Needs Focus
<1
Week
Jellyfish Improvement
+18%
Coding Days
How many days per week does each person commit code on average? Coding days can be a great representation of how focused a team is.
Elite
2+
Days
Average
1.3-1.9
Days
Needs Focus
<1.2
Days
Jellyfish Improvement
+8%
Issues Resolved
How many issues did each engineer on the team resolve? What is the volume of work the team is accomplishing?
Elite
3.2+
Issues/Week
Average
1.6-3.1
Issues/Week
Needs Focus
<1.5
Issues/Week
Jellyfish Improvement
+15%
PR Reviews
What was the total number of reviews on Pull Requests during a given time period? This metric is one measure of how engaged an engineer is.
Elite
3.0+
Reviews/Week
Average
1.6-2.9
Reviews/Week
Needs Focus
<1.5
Reviews/Week
Jellyfish Improvement
+10%
Planning Accuracy
What is the ratio of planned work vs. unplanned work? How well can the team plan, and how predictable is the team’s execution?
Elite
91%+
Accuracy
Average
63-90%
Accuracy
Needs Focus
<62%
Accuracy
Jellyfish Improvement
+16%
Based on data from 78,000 engineers and 11,000 teams.
Strengthen your team with Jellyfish Benchmarks
Jellyfish Benchmarks reveal how teams compare to the industry, so you can make informed strategic decisions about the right tools, processes and workflows to support an industry leading engineering organization.