AI Engineering Trends
September 2026
About this report
About this report
This resource represents the industry’s most comprehensive quantitative analysis of AI transformation in software engineering. Compiled from the largest study of its kind, these results comprise real-world engineering signals about how thousands of organizations and hundreds of thousands of developers are using AI tools across the SDLC.
Use these metrics as an objective baseline to benchmark your organization’s AI adoption and usage maturity. Beyond simple activity signals, this dataset quantifies the correlation between deep tool integration and its impact on measurable gains in delivery throughput and engineering outcomes.
of PRs merged
without human review at leading companies
9%
Open weight model usage
increase MoM, still under 2% of total
3.5x growth
AI spend
for top users
949 $ per month
of Cursor users using Grok 4.6
in its debut month
33%
Total Engineers
294K
Pull Requests
105M
Companies
1300+
Tools Covered
 GitHub Copilot
 GitHub
 Jira
Jira
 Claude Code
 Gemini Code Assist
 Devin Desktop
 Cursor
 Amazon Q Developer
 Greptile
 Baz
Baz
 Graphite
 CodeRabbit
 Unblocked
 Augment
AIDLC
AIDLC
AIDLC tracks how AI is becoming a participant in the development lifecycle itself, opening pull requests, reviewing code, and shipping work with progressively less human involvement. These signals capture where organizations sit on the path from AI-assisted engineering to AI-executed engineering.
Jellyfish tracks signals like autonomous agent activity, AI-only review, and model selection to help engineering leaders understand how deeply AI is embedded in their delivery pipeline. As you invest in the AIDLC, determine:
- How much of your delivery pipeline runs through AI agents rather than through engineers using AI tools?
- How has human oversight changed in the delivery lifecycle?
- Which models are actually doing the work, and how quickly does your organization absorb new model generations?
Autonomous Agent Activity
Autonomous Agent Activity
Jellyfish measures Autonomous Agent Activity as the percentage of pull requests that are autonomously created or generated by AI agents. A PR qualifies as agent-generated if it was opened by a user identity that is an agent, or if it contains commits where the committing user is an agent. This metric tracks the emerging frontier of AI adoption, where AI isn’t just assisting engineers, but independently shipping work.
Model Usage
Model Usage
Jellyfish measures Model Usage as the share of each tool’s active users who used a given model, reported separately for Claude Code, GitHub Copilot, and Cursor. It is calculated from the models invoked by each developer each week. Users can appear under multiple models.
By analyzing the top three models by share of users each month, we measure how quickly engineering organizations absorb new model generations. As each new release ramps, its predecessor fades, so the top models can change from month to month.
Open Weight Models
Open Weight Models
Jellyfish measures open weight model usage as the fraction of engineers who selected an open-weight model (e.g. Kimi, GLM, DeepSeek, Qwen) in a given week, alongside which model families lead among the companies using them. It is calculated from per-event model selections, classified by model family.
As software organizations mature in their AI transformation, their AI budgets are growing correspondingly. Teams are employing a number of strategies to manage that spend, including leveraging open-weight models and routing usage through model routers and gateways. This behavior remains concentrated in the most AI-mature companies, with under 2% of companies employing open-weight models or routers regularly, and August held the post-surge highs: 0.7% of weekly engineers used an open-weight model (up from about 0.2% in March), with Kimi at 68% of open-model engineers.
Agentic-Merged PRs
Agentic-Merged PRs
Jellyfish measures agentic-merged PRs as the fraction of a company’s merged pull requests whose only review activity, whether comments or formal reviews, came from AI tools, with no human review input before merge. It is calculated per company over merged PRs opened by humans or AI agents. The data below shows the distribution across companies by percentile.
This metric captures the sharpest edge of AI adoption: work that ships with AI as the only reviewer. While the median company agentic-merges just 0.6% of its PRs, lead adopters of this workflow merge 9%+ of their PRs with no human review.
Agent Skills
Agent Skills
Jellyfish measures invocations of agent skills in Cursor and categorizes them by use-case using an LLM. The data above shows the distribution of skill categories invoked by engineers within Cursor in the past month.
This captures the current state of AI development practices and the specific workflow steps engineers are augmenting within the AIDLC.
ROI
ROI
AI tooling now carries real and fast-growing costs in licenses, tokens, and per-developer spend, and the question has shifted from “is AI helping?” to “is the spend translating into delivery?” These signals tie AI investment to engineering and business outcomes to help organizations understand where to continue investing in ongoing training, enablement, and process improvements. Software teams are asking:
- How is AI affecting development throughput and team performance, and how does that compare against what you spend per developer?
- Where does consumption translate into output? Which teams and kinds of work convert tokens into throughput most efficiently?
- Are there new bottlenecks (e.g. delayed PR reviews) or runaway costs limiting the return on broader adoption?
AI Spend
AI Spend
Jellyfish measures AI Spend as the cost of AI coding tool usage per developer per week, reported for Claude Code and Cursor. It is calculated by summing each developer’s reported usage costs each week, shown as a distribution across developers.
This metric turns token consumption into budget terms, and the distribution matters as much as the level: spend is highly concentrated, with the heaviest users consuming an order of magnitude more than the median developer. For leaders, it anchors the ROI question by showing what the organization actually pays per developer for the productivity signals measured alongside it.
Token Consumption
Token Consumption
Jellyfish measures Token Consumption as the total number of tokens consumed by a developer while using Claude Code and Cursor. It is calculated by summing all tokens as reported from Claude Code, and Cursor for each developer each week. This metric tracks usage of those tools and the potential budgetary implications of increased AI maturity.
Productivity by Token Consumption
Productivity by Token Consumption
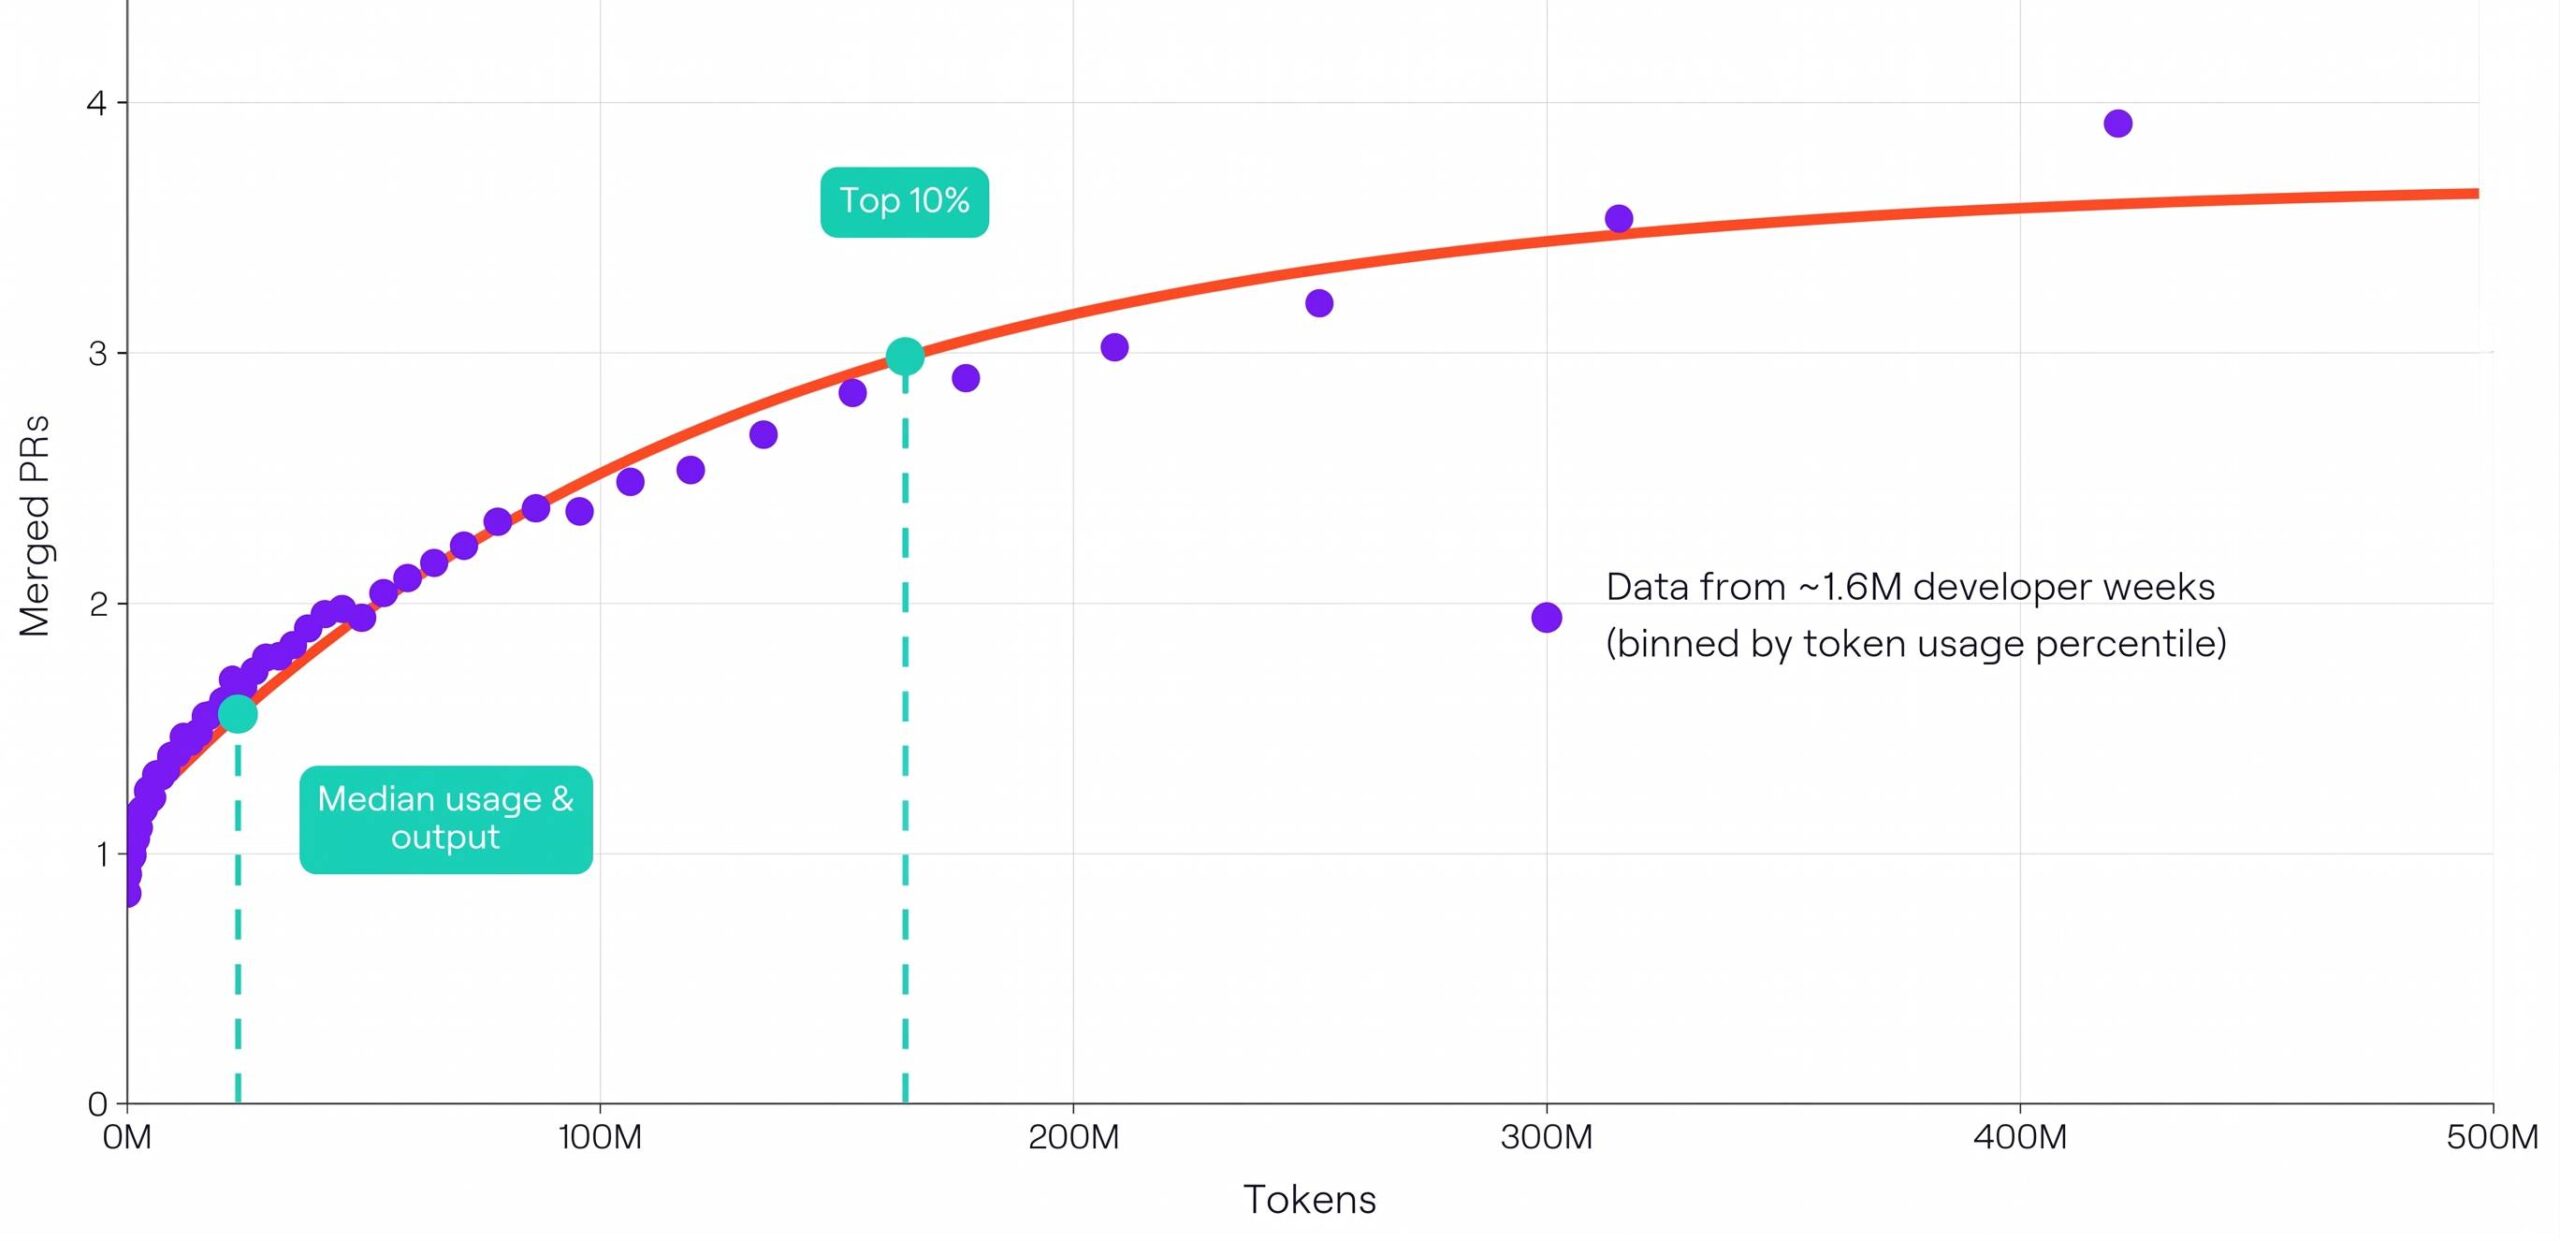
Jellyfish measures Productivity by Token Consumption at the developer-week level. Each developer-week is ranked by its AI token consumption (Cursor + Claude Code) and grouped into 50 equal-sized bins, each 2 percentiles wide. Each point is one bin’s average tokens against its average merged PRs, and the line is a curve fitted to those points.
This metric addresses the core ROI question of whether consumption converts into output. Throughput rises with token consumption, but not linearly: gains taper off at the high end. As with all comparisons in this report, the relationship is correlational rather than causal.
Adoption
Adoption
Adoption tracks how often teams regularly engage with the provided set of AI tools, enabling them to improve the efficacy of said tools, build trust in the outputs, and remove barriers to adoption. Jellyfish tracks signals like access, adoption, code ration and AI assistance to help engineering leaders assess adoption maturity. At the Adoption stage, determine:
- How and how much are your teams using AI tools?
- Are there friction points blocking adoption?
- Are engineers maturing from experimentation to full adoption?
Access %
Access Percentage
Jellyfish measures Access Percentage as the fraction of engineers at a company who have a license to an AI coding tool. As a baseline adoption metric, Access Percentage establishes the foundation for deeper analysis, including how frequently and deeply AI tools are integrated into developer workflows.
Weekly Active Users %
Weekly Active Users (WAU) Percentage
Jellyfish measures Weekly Active Users (WAU) percentage as the fraction of engineers at a company who actively use an AI coding tool in a given week. This metric captures the frequency of adoption, showing whether engineers are actually integrating AI tools into their regular workflows.
AI Code %
AI Code Percentage
Jellyfish measures AI Code Percentage as the fraction of a company’s shipped code that is AI-assisted. It is calculated as the fraction of merged code additions that were AI-assisted, relative to all code additions in merged pull requests for each company.
This metric moves beyond tool usage frequency to capture the actual depth of AI’s impact on codebases and coding work.
Download this report
Download the AI Engineering Trends Report
Get this report sent to your inbox to save or share with your team.
Past reports
See past reports
This data is updated regularly. You can access past reports here.
January 2026
February 2026
March 2026
April 2026
May 2026
June 2026
July 2026
August 2026