Often, engineering leaders are stuck with simple traffic lights or bullet points from which to make complex decisions.
This is where a strong engineering metrics strategy comes in. Engineering metrics are a helpful tool for assessing specific aspects of a project, including its efficiency, effectiveness, quality, and general performance. Measuring and monitoring engineering work can also foster alignment with product and go-to-market teams, improve the overall product experience and value for customers, and speed time to market.
But exactly which data should you pay attention to? What metrics should you be tracking? In this piece, we’ll introduce 10 common engineering metrics you can use to get started.
Key Engineering Areas for Measurement
Key Engineering Areas for Measurement
There are countless ways you could measure engineering work. That’s why it’s important to first create an engineering metrics strategy: This helps you narrow your focus, so you’re only tracking the data that will be helpful in decision-making processes.
Your strategy may vary depending on your organization’s business goals and the audience you’re speaking to. For example, the metrics you might share with an engineering team looking to improve their speed are different from the metrics you’d likely share with a board of directors more interested in whether engineering work aligns with business objectives.
Generally, most engineering metrics strategies will leverage a mix of metrics from the following six key areas of measurement:
Alignment
When we’re looking at metrics for alignment, we’re trying to make sure that the engineering team is working on and prioritizing work that ladders up to business objectives and goals. For example, is the engineering team working on projects that most align with this quarter’s strategic business initiatives? Are there other tasks taking more time than they should?
Metrics that speak to alignment might include: FTE distribution across investment; FTE distribution across epics/themes; allocation.
Productivity
Engineering productivity is about more than “doing more.” When you’re measuring team productivity, it’s important to consider not only how much work is being done, but whether work is being done efficiently, consistently, and to a high quality.
Metrics that speak to productivity might include: Rate of deployments; change failure rate; mean time to recovery.
Speed
Speed is a more tactical area of measurement for team performance. When considering speed, you want to figure out if team members are working appropriately quickly or if there are bottlenecks and inefficiencies in the system causing things to slow down.
Metrics that speak to speed might include: Cycle time; PR cycle time; lead time to change.
Quality
Looking at metrics for quality helps ensure that the software you’re developing in your engineering organization provides value to customers consistently.
Metrics that speak to quality might include: Defect rate; time to resolution; uptime.
Note: Often, monitoring metrics around speed and quality go hand in hand. That’s because an overemphasis on speed can sometimes cause code quality to slip. This can then cause fire drills and ultimately slow things down in the long run. With that in mind, consider looking at speed metrics for extra context when considering quality.
Collaboration
Tracking collaboration metrics means looking at the systems and processes you have in place and whether they’re working together effectively or not. For example, are there parts of the system that could be giving each other more meaningful and constructive feedback? While potentially not as relevant at small companies with just a few engineers, collaboration is key to success at larger organizations and requires thoughtful planning.
Metrics that speak to collaboration might include: Comments per PR; PR reviews; PR pass rate.
Process
Process metrics help teams set proper expectations, drive alignment across functional teams, and allow for better execution and better penetration of the market. Tracking process helps teams understand clearly what needs to be accomplished.
Metrics that speak to process might include: Cycle and lead times; deployment frequency; task resolution rate over time.
10 KPIs Every Engineering Leader Should Track
Get eBook10 Key Metrics For Software Engineering Leaders to Track
10 Key Metrics For Software Engineering Leaders to Track
A quick search reveals that there is no shortage of possible engineering metrics and key performance indicators (KPIs) to track. If you’re just looking to get started, however, here are 10 common and popular metrics to consider.
1. Allocation
What it is: Allocation tracks how your team’s time and resources are distributed across different types of work, such as new feature development, bug fixes, meetings, etc.
Why it’s important: Monitoring resource allocation helps engineering leaders understand if their team is focusing on the right priorities, such as work that aligns with business objectives. Tracking allocation can also help leaders make decisions about whether their existing team has the capacity to work on new products or capabilities.
Example: An engineering leader may wonder why a strategic initiative isn’t tracking to its planned timeline. By looking at allocation, they notice the team is spending 40% of its time on bug fixes and 30% on meetings and other activities. This might indicate that the team needs to improve code quality or reduce its meetings.
2. Change Failure Rate
What it is: Change failure rate (CFR) is the percentage of code changes (deployments or releases) that result in a failure, such as a bug, system outage, or performance degradation.
Why it’s important: You might track change failure rate if you’re concerned with process. For example, a high CFR might indicate problems with development and deployment processes. This in turn could lead to customer dissatisfaction, lost revenue, and increased support costs.
Example: An engineering leader who notices their team’s CFR spike from 10% to 30% over the past quarter might look into failed deployments. This in turn may reveal an increase in failed deployments stemming from insufficient test coverage in a recently adopted microservices architecture, prompting them to invest in better integration testing and deployment validation.
3. Defect Rate
What it is: This important metric measures the number of defects or bugs found in your software or product.
Why it’s important: While bugs are inevitable in software development, working to keep your defect rate low can indicate higher quality and lead to increased customer satisfaction and reduced development costs.
Example: An engineering manager may track defect rate by product or feature, then compare that rate with product or feature usage among their customer base. In that way, you can better understand which bugs to prioritize fixing and where to devote your resources.
4. Mean Time to Recovery
What it is: The mean time to recovery, or MTTR, is a DORA software delivery metric that tells the average time it takes to recover from a system failure or outage.
Why it’s important: On the whole, measuring the time it takes to resolve reported bugs, failures, and other incidents will give you a sense of the team’s responsiveness to customer problems. A lower MTTR means less downtime and a faster return to normal operations, minimizing disruption to users.
Example: An engineering leader notices that the team’s MTTR has increased from two hours to six hours, leading to prolonged downtime after incidents. By reviewing past incidents, they find that unclear on-call procedures and lack of automated rollback mechanisms are slowing recovery, so they implement better incident runbooks and automated rollbacks to reduce MTTR.
5. Uptime
What it is: Uptime is the percentage of time a system or service is operational and available to users within a given period.
Why it’s important: Typically you measure uptime to assess reliability and performance. Monitoring and maximizing uptime is especially important in industries like e-commerce, where failing to deliver services can equate to a loss of revenue and is an immediate threat to the business.
Example: An engineering manager might investigate why service availability has dropped from 99.9% to 99.5% over the past month, leading to increased customer complaints. To address this, they might analyze incident logs, identify a recurring database scaling issue, and work with the team to optimize queries and implement better auto-scaling policies.
6. Cycle Time
What it is: Cycle time is the total time it takes to complete a task or project from start to finish. This includes all the steps involved, from the initial request to the final delivery.
Why it’s important: A shorter cycle time generally indicates a more efficient process; tracking cycle time can help identify bottlenecks and areas for improvement in your workflow. Tracking cycle time across projects can also help engineering leaders better predict how long similar projects will take to build and ship.
Example: An engineering manager knows that the average cycle time for new features is 10 days. As a result, they can estimate a ship date for an upcoming feature as 10 days from the first day of work.
7. Lead Time for Changes
What it is: This DORA metric tracks the time it takes for a code change to go from the initial idea or request to being deployed in production.
Why it’s important: The point of lead time is to understand the amount of time it takes between the initiation of a change request and when that change is running in production – or how quickly we can deliver value to customers.
Example: If an engineering leader notices lead time has increased from two days to a week, they may investigate where their team is experiencing bottlenecks.
8. Deployment Frequency
What it is: Deployment frequency shows how often you successfully release code to production (or to users).
Why it’s important: Deployment frequency (another DORA metric) can be extremely useful for understanding and improving the speed with which you can deliver value to customers. Higher deployment frequency is often associated with greater agility, faster feedback loops, and quicker delivery of value to customers.
Example: An engineering leader who wants to get new functionality into the hands of users faster might look at deployment frequency to see if their team can shift from deploying code multiple times per week to multiple times per day.
9. Pull Request Size
What it is: Pull request (PR) size is the number of lines of code changed in a pull request.
Why it’s important: PR size can help inform decisions around speed and quality. Smaller PRs are generally easier to review, understand, and test, leading to faster code reviews and fewer errors.
Example: If an engineering leader notices that PRs exceeding 500 lines of code take twice as long to review and often introduce more bugs, they might set a guideline encouraging smaller, more frequent PRs to ensure they are manageable and easy to review.
10. Frequency of Pair Programming
What it is: This metric tracks how often developers work together in pairs.
Why it matters: Good collaboration is essential for high-performing teams. The frequency of pair programming can indicate if and how well teams are collaborating in the software development process.
Example: An engineering leader may encourage more structured pair programming sessions, especially for complex feature development and knowledge sharing, to improve overall code quality and team collaboration.
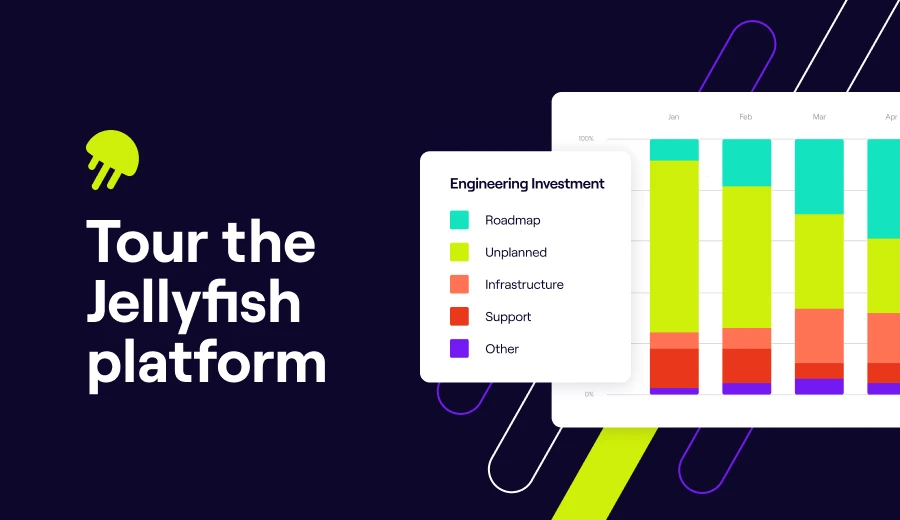
How to Track Software Engineering Metrics with Jellyfish
How to Track Software Engineering Metrics with Jellyfish
Calculating, collecting, and keeping track of the engineering metrics that are important to your team and organization can quickly become a challenge. That’s why many engineering leaders eschew spreadsheets and various dashboards, and instead turn to engineering management platforms like Jellyfish.
Jellyfish provides out-of-the-box metrics so engineering leaders can quickly identify areas for improvement, set realistic benchmarks, track progress toward goals, and improve team collaboration and communication. Here’s how organizations commonly use engineering metrics with Jellyfish:
- Strengthen engineering visibility and business alignment: Get insight into your engineering investments and software development life cycle to understand what’s working and where there are opportunities for improvement. Communicate that clearly with business stakeholders and build executive trust.
- Build software more efficiently: Continuously improve your engineering operations and remove bottlenecks to deliver software faster, more reliably, and more efficiently.
- Accelerate delivery with DORA (or other preferred) metrics: Track your DORA metrics or customize your own DevOps metrics to hone your DevOps practices and build an elite-performing team.
- Empower and support teams: Take a data-driven approach to improving team health and the developer experience. Provide unbiased feedback, celebrate engineering impact, and deliver more targeted coaching.
With Jellyfish, leaders can take a data-driven approach to engineering leadership, providing visibility into engineering investments and operations, product quality, delivery speed, and deliverable progress of your organization.
Ready To Drive Engineering Impact?
Once you know where to start, engineering metrics can be a powerful tool to help your teams improve productivity. Learn how Jellyfish can help improve visibility into engineering performance.
Tour the ProductAbout the author

Lauren is Senior Product Marketing Director at Jellyfish where she works closely with the product team to bring software engineering intelligence solutions to market. Prior to Jellyfish, Lauren served as Director of Product Marketing at Pluralsight.