October 26, 2021
Over the past decade we’ve seen the evolution of DevOps from a pie-in-the-sky lofty goal just for the big and bold, the Netflixes of the world, to a universal movement that has been embraced by IT and software development teams alike. As with many things in engineering, we’ve noted how DevOps practices have necessarily shifted left and are now practices commonly employed by software development teams who, in true DevOps fashion, strive for fast, continuous delivery of software, continuous improvements, and constant and stable delivery of value to the customer.
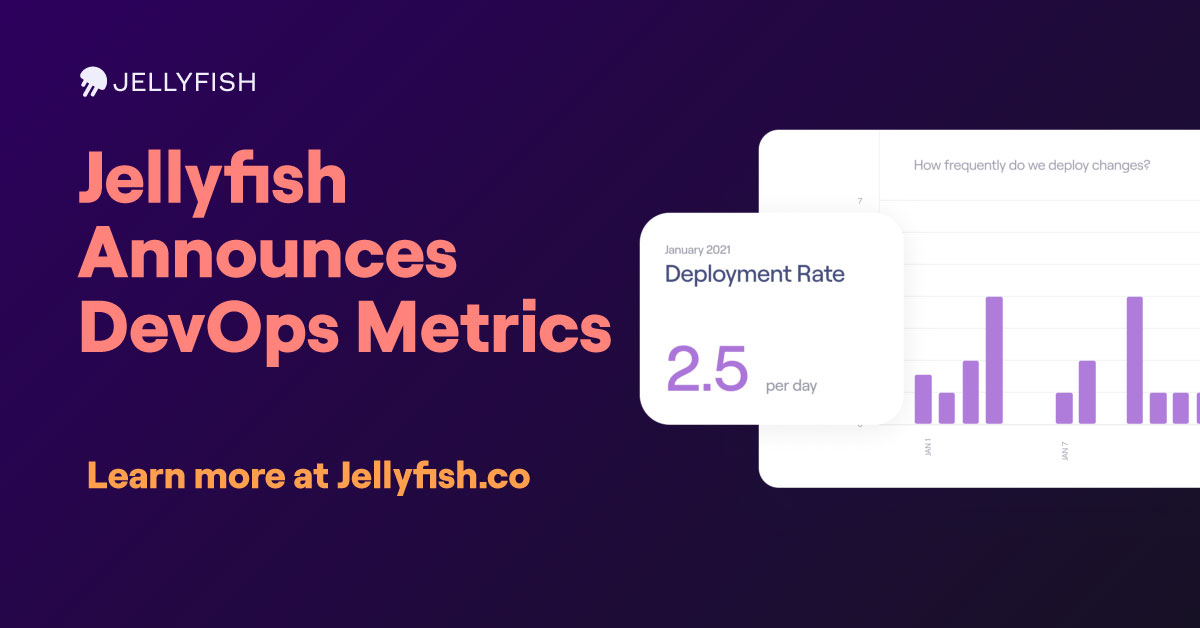
But a lot goes into adopting DevOps practices, enabling engineering teams to move quickly and build and deliver continuously. And then again, what exactly constitutes fast, continuous, or reliable? How do we know whether the DevOps practices, processes, cultural changes, and tools that we’ve adopted as a team are working? Today we are excited to announce DevOps Metrics, the latest innovation from Jellyfish to help engineering teams answer these questions and measure and improve software delivery.
What are DevOps Metrics?
In 2014, the DevOps Research and Assessment (DORA) group started publishing a series of annual reports called the State of DevOps to answer these questions, provide benchmarks, and reveal best practices. In 2018 they even published a book called Accelerate, which dives even further. Their findings indicate that elite performing software teams – those who deliver the most value, fastest, and most consistently – optimize for the following four metrics (commonly called DORA metrics):
- Change Lead Time: Measurement of the time from work starting on an intended Production Change to when it has been Deployed
- Deployment Frequency: Measurement of the number of deployments to production environments in a given period
- Mean Time to Restore (MTTR): Measurement of the time from an incident having been triggered to the time when it has been resolved via a production change
- Change Failure Rate: Measurement of the rate at which production changes result in incidents or production failures
Why it’s important and often difficult to track DevOps Metrics for engineering teams
For DevOps and software engineering teams, great execution means ensuring the engineering organization delivers quality software efficiently and on time. That may involve organizational design decisions, enabling teams with proper tooling, and implementing the right processes. But in order to optimize delivery processes around the DORA and other potential DevOps metrics, teams must first be able to measure, track, and visualize them.
Most teams quickly find these tasks to be more difficult and time consuming than they had expected, leaving them with more questions than answers. Many teams are asking all the right questions, earnestly seeking to measure their DevOps processes, but simply don’t know how. Some have endeavored to build homegrown solutions, manually pushing metrics to a database and building dashboards from there. Some have even found tools to answer to get them part of the way there but find they don’t trust the data they’re seeing. DevOps and software engineering teams and their leaders need to be able to answer these questions in a way that is as fast and automated as the DevOps tools and practices they are employing.
Announcing DevOps Metrics in Jellyfish
At Jellyfish, our own journey on the path to DevOps, highlighted the challenges around optimizing these metrics to improve business outcomes. Simply put, it’s hard to make DevOps measurable. But we quickly realized that as an engineering management platform, Jellyfish is uniquely positioned to solve these challenges, and as such has the responsibility to our customers and to the market to do so.
Jellyfish already automatically ingests signals from the tools developers use to build and deliver software – tools like Jira, SCMs (various flavors of Git), CI tools, incident response systems – in order to measure resource allocation, deliverable progress, and team performance.
But these tools are also integral to DevOps processes that exist within an engineering organization. If we already understand the activity from those tools, it’s a small leap to also reveal for teams how frequently they are deploying, how long it takes to ship new features and functionality, how reliable the software they deploy is, how long it takes to fix production incidents when they occur, and more. And by answering these questions, we realized we could provide unparalleled and constant visibility into the state of your DevOps practices, allowing Engineering and DevOps leaders to make process and tool standardization measurable, invest in what works, and remove what doesn’t.
So we built Jellyfish DevOps Metrics.

Our goal with Jellyfish is and has always been to empower engineering leaders. We want to help you measure and continuously improve the strategy and operations of your engineering organization, from the structure and allocation of resources, to the health and performance of your team, to DevOps processes and tools, in order to ensure fast, efficient, and predictable delivery of quality software.
We’re proud to announce the general availability of Jellyfish DevOps Metrics in service of that goal. If you are interested in DevOps metrics or learning more about the Jellyfish platform, request a demo today!