
September 12, 2024
In engineering organizations, few topics are as hotly debated as measurement. Can you measure engineering? If yes, what measurements are useful for an engineering team? Once we find those measurements, how do we measure them without incentivizing our teams to game them, or spend tons of time making sure they’re calculated down to the 100th significant figure? After speaking with hundreds of engineering leaders, it’s incredibly clear to me that engineering organizations should be measured, with intentionality around how.
An engineering organization is a system. The system collects inputs – business goals, customer feedback, market conditions, product ideas – and produces a result: working software. And like any system, an engineering organization can be measured. While some individual engineers may argue against it, the reality is that engineering organizations need a metrics strategy. Engineering is a major investment area in many companies with leaders throughout the business expecting visibility into the engineering org’s progress and performance. Managing your R&D organization using only subjective data, gut feel, and emojis / traffic lights on a slide (I’m a product person, I did this for years) subjects the organization to the whims and / or perceptions of the loudest and most influential people in the room.
Once you realize you need metrics, you then need a strategy. There are thousands of ways to measure engineering work – an effective metrics strategy will narrow the focus down to key areas, and cut through the minutiae of how do we calculate this to get to the data that matters. At a high level, engineering leaders should begin building a metrics strategy with these three principles in mind:
- Focus on outcomes over outputs: An engineering team might want to improve the quality of its software, or it might want to build software faster. Those are good outcomes to work towards, and they will be more useful than aiming for highly specific outputs like “I want to increase our number of deployments by 20%.”
- Focus on the outcomes that matter for your business: Different companies will have different priorities. An early-stage startup should focus on different outcomes than a global enterprise. You can’t measure everything — choose the outcomes that make sense for your current goals and growth stage.
- Measure those outcomes and the side effects of those outcomes: Regardless of what you choose to measure, the system will cheat to try to improve results. It’s human nature. If your goal is simply to build more widgets, the system might cheat by making the widgets smaller or by lowering quality controls to increase quantity. By measuring the side effects (like the size of those widgets, or the quality of those widgets in the earlier example), you can better understand the tradeoffs that you are making to drive those outcomes.
Now let’s look at how to measure these outcomes with specific metrics.
Six key areas for engineering measurement
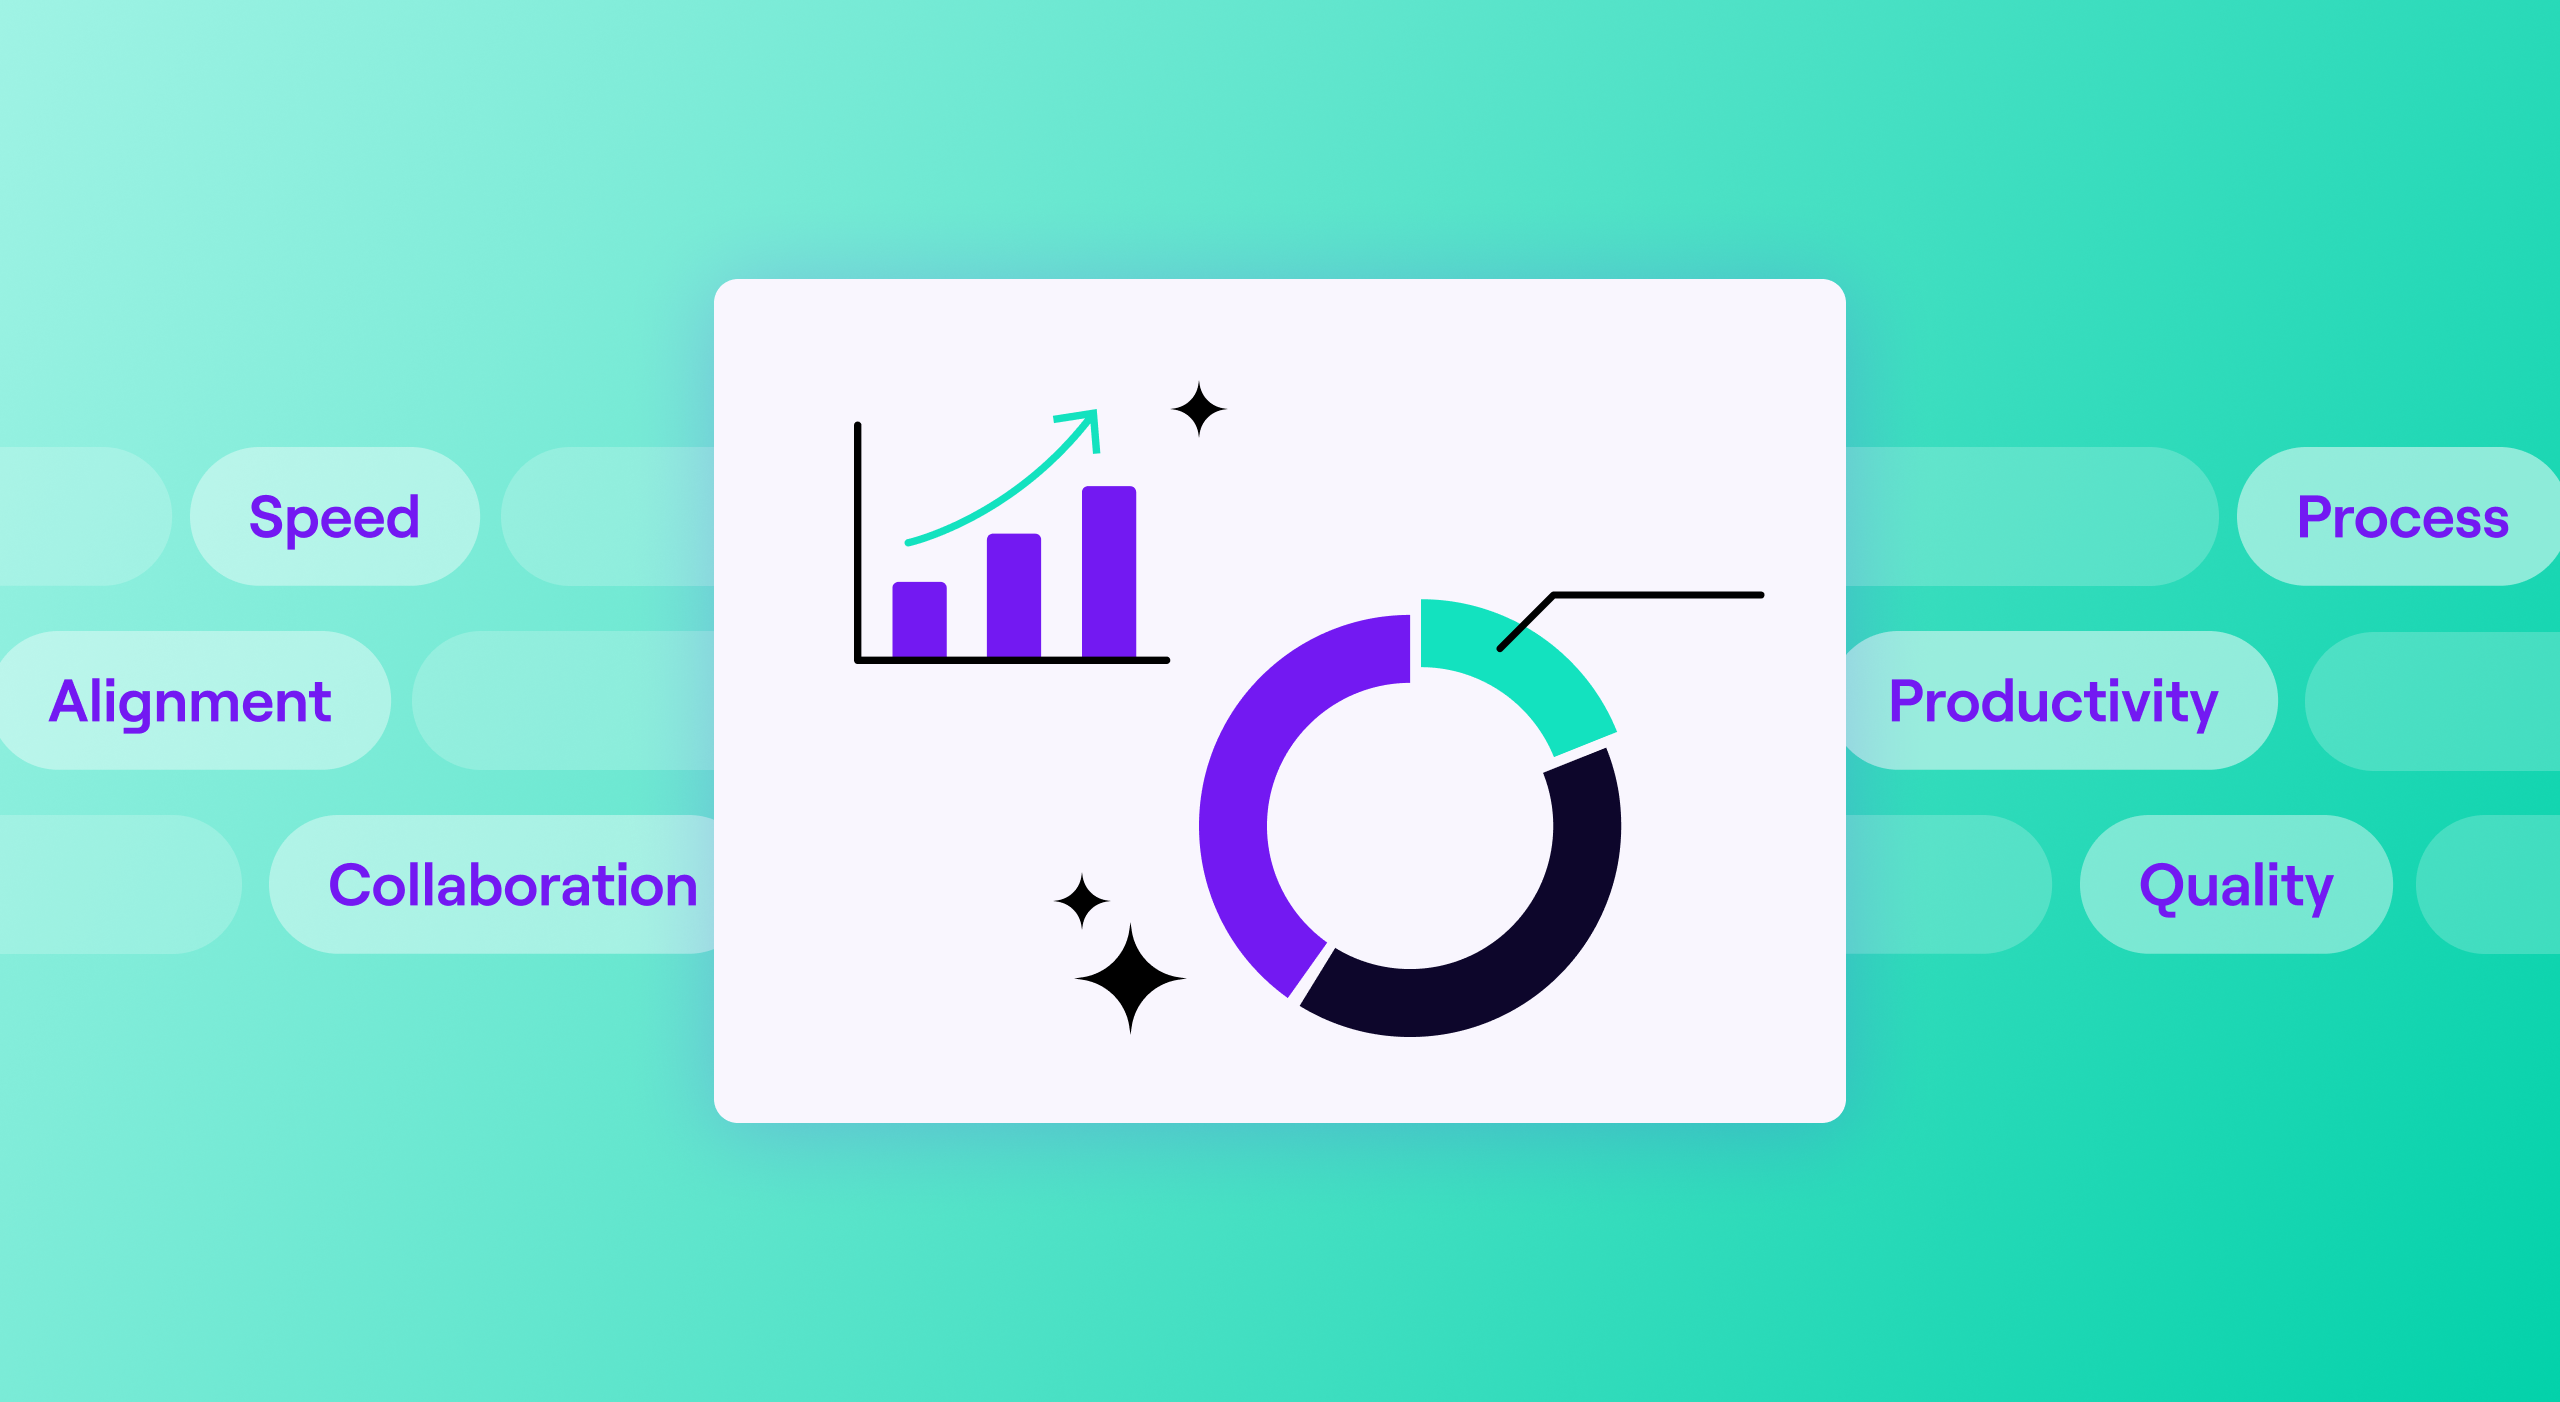
Engineering is complicated. There’s no one magic measurement that will allow an engineering leader to determine whether the team is thriving or falling behind. However, we can gain a solid understanding of the health and performance of an engineering team by looking at six key areas:
- Alignment: Is the engineering team working on the projects that matter most to the business? Are there other things consuming more time than they should? Measuring alignment ensures that the work being done is delivering the most value to the business and its mission.Useful metrics: FTE distribution across investment; FTE distribution across epics/themes
- Productivity: To make it simple — are we doing enough “stuff”? Are we consistent in the amount that we produce? It’s easy to over-index on the idea of producing more or “doing more stuff,” but that is rarely the most effective way to improve performance. Remember that the system will try to cheat to improve results — focusing on volume provides the wrong incentives.Useful metrics: PRs merged; epics resolved; number/rate of deployments
- Speed: Are we working appropriately quickly? Are there bottlenecks in our system that are causing the team to slow down?Useful metrics: Issue cycle time; PR cycle time; lead time to change
- Quality: Are we creating fire drills for ourselves because of poor code quality? Are we making it easy for customers to use our product? Many early-stage engineering organizations will focus on increasing speed, but they should also keep an eye on quality to make sure they aren’t creating more problems than solutions.Useful metrics: Defects opened and resolved; incident/outage rate; incident/outage mean time to resolution
- Collaboration: Are there parts of the system that aren’t working together but should be? Are there parts of the system that could be giving each other more meaningful and constructive feedback? This may not be as relevant at small companies with just a few engineers. At larger organizations, collaboration is key to success and requires thoughtful planningUseful metrics: Comments per PR; PR reviews; PR pass rate
- Process: How does the engineering team fit into the larger organization? Are we making it clear what needs to be accomplished? Can we tell stakeholders what’s happening with a high degree of accuracy?Useful metrics: Unlinked PR percentage; sprint predictability
These six areas provide useful starting points for engineering teams, but no team should focus on all six areas equally. The outcomes are correlated: improving performance in one area will often lead to parallel improvements in others. Focus on the outcomes that are most important to your business, and the other factors will improve as part of the rising tide.
Engineering leaders can start by picking an outcome, then choosing the metrics that measure that outcome, inclusive of the tradeoffs being made. In an ideal world, the metrics that measure the primary outcome will move, while the metrics representing the tradeoffs will stay steady:
Outcome:Increase speed.
- Primary Metric: Lead time to change (speed); incident frequency (quality); mean time to resolution (process)
- Secondary Metrics: Deployment frequency (productivity); incident frequency (quality); mean time to resolution (process)
Strategy: Build more high-quality features
- Primary Metrics: Time spent on new features (alignment); number of PRs (productivity)
- Secondary Metrics: Number of PR comments (collaboration); epic cycle time (speed)
Focus is the key to an effective metrics strategy. Once you’ve chosen your strategy, look for improvement on the things that indicate success for that strategy – avoid the temptation to try to improve everything.
Know your audience
The metrics you use should depend on your audience: the metrics that make sense for your team won’t be the same as the metrics that make sense to your company’s board of directors.
For a detailed look at what metrics make sense for each audience, check out Ryan Kuchova’s series on engineering metrics:
Metrics are important. Objective data helps us understand what’s happening in our organization. But metrics should never be the be-all and end-all for an engineering leader. You should measure things and know what’s changing in your organization, but that data should serve as an input for human decision-making. In a healthy engineering organization, managers will use data to inform thoughtful, human processes that support their people and their results.