
April 19, 2023
The Impact of Context Switching through Data
Last week, we revealed the results of an analysis we ran with Jellyfish Research to quantify the impact of context switching. We learned that engineers who were able to limit their WIP to one issue at a time were significantly more productive than their peers who juggled 2 or more tasks concurrently. A task that would have taken a day of effort – if done uninterrupted – takes two days when an engineer juggles two other tasks simultaneously. If an engineer adds a fourth task to the mix the effort goes from one to fourteen days for the single task.
But how did we actually come up with this insight? In this post, we breakdown our methodology and how we arrived at our conclusions about the impact of multitasking on productivity.
The Jellyfish Work Model
At the heart of the Jellyfish product is a model (the Work Model) that calculates the amount of effort spent to produce a unit of work by analyzing the data exhaust Jira and Git. The effort is expressed in Full Time Equivalents (FTE). You can watch a detailed explanation of it in our “What is Engineering Allocation?” video and learn more about the Jellyfish platform here.
For the analysis in this blog post we use FTEs that represent a 24 hour work period. Therefore an engineer working a normal day would have a signal that is a fraction of 1 FTE (because hopefully that poor engineer did NOT work a full 24h that day). So even if the engineer worked on multiple tasks throughout the day, the effort would never become more than 1 FTE for a given day.

Another metric used for this analysis is cycle time. Cycle time is the calendar time between starting a task and finishing it. We’re able to track this because Jellyfish is aware of the state transitions that signal issue start and completion in Jira.

We use our knowledge of the issue state to identify how many issues an engineer has “In Progress” at any given time. This, together with the FTE allows us to know when and how much work is happening on each issue.
A “More Perfect” Definition of Context Switching
The relationship between more issues “In Progress” and fewer things being moved to the “Done” state, when looking at Jira state transitions alone, is not immediately clear (we looked at that first, but we won’t show it here).
Most likely this is due to the problem being more granular – more hidden than we are able to tease out when looking at this simple relationship for an arbitrary time interval.
Instead, for our WIP hypothesis – “more is not always better” – we would assume that issues that are worked on alone (rather than in parallel with other issues) will take less effort over a shorter period of time. But what does “worked on alone” look like in Jira?

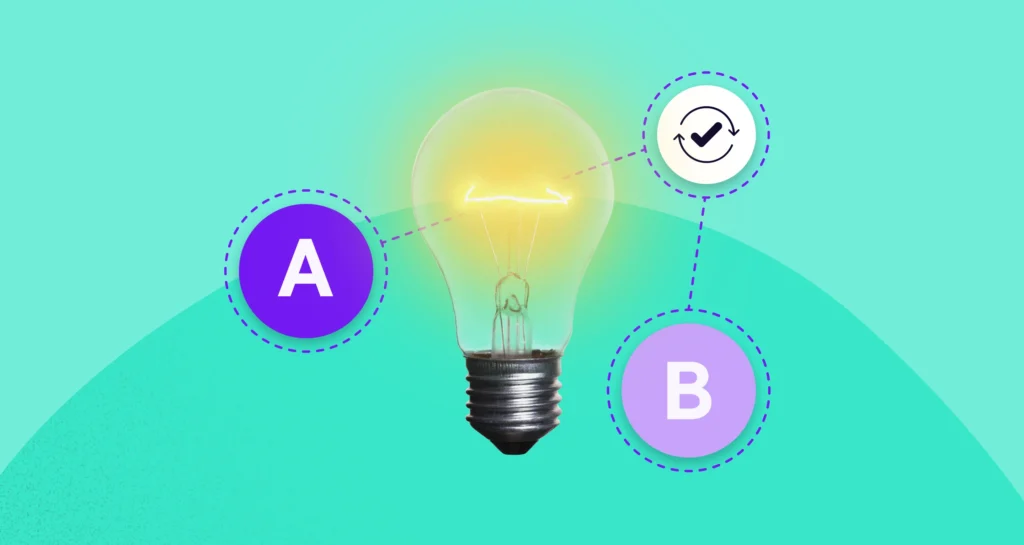
In this schematic the top shows an example of Issue A that was worked on alone (- no other issues were “In Progress” at any time this issue was in the “In Progress” status).
At the bottom you can see an example of an issue that was worked on in parallel with another issue. See how Issue A’s time “In Progress” overlapped partly with another issue in this status? In other words: the engineer started working on an issue but, before finishing it, also moved Issue A into Progress.
And what does – “that are worked on alone (rather than in parallel with other issues) will take less effort over a shorter period of time” – actually mean?
Here is an example:
An engineer worked on issue A alone (hence only Issue A was “In Progress”). The total work done on this issue was 0.4 FTEs and the cycle time was 4 days. That means that, on average, the engineer put 0.1 FTEs per day towards this issue until it was resolved and moved into “Done.”
Now the same engineer worked on Issue B and Issue C at the same time (hence both issues were “In Progress” at overlapping times). The effort towards Issue B was 0.4 FTes, but the cycle time was 9 days. This means that the effort overall was the same, but it was stretched out over a longer period, resulting in an average of 0.045 FTes per day – showing that the work happened less effectively than for Issue A.
Distracted work results in longer Cycle Times
We can now find the number of issues each individual engineer worked on alone vs. the number of issues the same engineer worked on in parallel.

We choose engineers from 20 randomly chosen companies and group together the issues that were worked on alone (“single”) to compare the average cycle time to the cycle time of issues that were worked on with one other issues (“Two” total), two other issues (“Three” total), and issues that were worked on with more than two other issues (“Four or more”).
What this shows is that, on average, the cycle time is longer when a person works on more than one issue at the same time.
Specifically, on average, the cycle time increases from 3 to 6 days for working on a single issue to working on three issues at the same time. It increases to more than 16 days when there are four or more issues in progress at the same time.
What if the work was simply harder?
Something to consider is that the issues with the longer cycle time might have just taken longer because they were “bigger” tasks, hence harder to resolve. In other words, were the issues that took longer…
- just larger/more difficult?
- did they take longer because they were worked on in parallel with others?
This is hard to quantify in data, but we can use the FTEs per issue together with the cycle time to get a better idea. Specifically, we can divide the FTEs by the total cycle time. This will show us how focused or spread out (distracted) the work was. In other words, did you spend a lot of effort over a short period of time, or did you spend that same effort over a much longer period because you were distracted?
Example: If you worked on a single issue, your effort should be more focused (more FTE per day) rather than being spread across multiple tasks. That means for issues that were worked alone, the FTE/Cycle time ratio should be high, hence focused over a shorter period of time. Issues that were worked on in parallel with others, on the other hand, would have a lower FTE per day, showing that the work was spread out more.

For the same 20 companies, we see that, on average, the FTE/cycle time ratio is much much higher for “Single” issues (undistracted work) compared to the issues that were worked on in parallel with others. Hence the effort put towards an issue was spread out across more days for the latter case.
What this suggests is that the work going towards the issues that are worked on alone is more concentrated, more focused.
Hence the longer cycle times are a reflection of distracted work more than a reflection of harder tasks.
Hang on – How do we know the work was actually more focused?
Some of you are probably thinking, hang on, this doesn’t actually tell us if the work happened uninterrupted and more focused. And what if the cycle time is longer for the issues that were worked on in parallel because of other reasons rather than parallel work?

Luckily, the Jellyfish work model can help us with this! The Jellyfish work model will look for work signals an engineer created while doing daily work. These signals include work in Jira (e.g. creating issues, moving issues, commenting on issues), work in Git (e.g. pushing code, commenting on code, merging code etc.), and others. The work model digests all this and recreates a summarized view of what an engineer worked on and with how much effort. Think of this as something similar to a “time card”.
Using this, we can see if work happened on continuous days, or if there were interruptions at any point.
If the idea that we proposed above – that work happens with fewer interruptions when an engineer works on one issue at the time rather than on multiple – is true, we should see this here as a smaller number of interruptions.
Defining and Spotting Interruptions
Before we dive into the data, let’s explore how we might spot an interruption in the first place: Each day we can see the effort that an engineer spent on a certain Jira issue.

In the first example, the work model shows that an Engineer worked on an issue for 5 days (8/10 – 8/14) without interruptions (work signal was detected daily).
The next example shows that weekends are ignored for this analysis – we assume that most engineers will not normally work on those days, so a lack of work signal on Saturday and Sunday is not considered an interruption.
Hence in this second example, there is a work signal on Mon 8/10 – Tue 8/11 and then again on Fri 8/14, Mon 8/17 and Tue 8/18. This results in the detection of one interruption (Wed 8/12 – Thu 8/13).
In the last example, we see two interruptions: the first on Wednesday, and the second on the following Monday. Again, the weekend does not count as an interruption, even though there was no work signal detected for Saturday.
Interruptions and Cycle Time
After counting the number of interruptions for the issues of the 20 companies, we can group the issues into a group with zero interruptions and compare the cycle time to issues with at least one interruption.
The first interesting insight we find here is that the ratio of issues without interruptions, to issues with interruptions is about 70/30.
Issues with no work interruptions had an average cycle time of about 4 days, while issues with interruptions had a cycle time of about 13.5 days. This means that the cycle time of issues with no interruptions was about 70% shorter than for issues with at least one interruption.

Again, we need to pause here and ask the causation/correlation question: what causes this? What if I have a small task that usually takes two days? We can assume that for this the probability of being interrupted is much lower than if I have a big task that takes ten days. This is an excellent point to keep in mind since the analysis does not tell us anything about cause and effect. However, it does show us a nice relationship between the interruptions and the cycle times, which can be strengthened by also looking at the relationship between interruptions and FTEs – the total work that was done by an engineer related to the issue.

Doing so gives us confidence that the relationship is more than just a coincidence – the total work associated with the issues that had interruptions is about 0.25 FTEs higher (remember that 1 FTE = 24h, so 0.25 FTEs is about 6 hours of work which is roughly one work day).
The Cost of Interrupting Developers
What is still missing is the “cost” that is associated with interruptions. Unfortunately, this is not easy to quantify. As mentioned in Part I of this post, literature, and widely accepted ideas exist around this. However, quantifying this in data would take more time and space than we want to use here. So stay tuned for future data-driven analysis of this topic.
What We Learned:
Let’s take a moment to recap the key points from our analysis:
- Engineers who were able to limit their WIP to one issue at a time were more productive than their peers who juggled 2 or more tasks concurrently.
- A task that would have taken a day of effort if done without any other “In Progress” tasks, takes two days when an engineer is juggling two other tasks at the same time.
- If an engineer adds a fourth task to the mix the effort goes from one to fourteen days for the single task.
- The cycle time of issues with no interruptions was about 70% shorter than for issues with at least one interruption.
- The total work associated with issues that have one or more interruptions is about 0.25 FTEs higher (this is equivalent to about one work day (6 hours of work)).
- Cycle time increases by 6 hours (roughly one work day) for each interruption.