In this article
Tracking the right Agile metrics can mean the difference between a high-performing Agile team and one that struggles with inefficiencies.
But with so many metrics available, how do you know which ones to track? The answer depends on your Agile framework and your team’s specific goals.
Scrum teams may focus on velocity and sprint burndown, while Kanban teams prioritize cycle time and throughput. Meanwhile, organizations using Lean principles track flow efficiency and lead time. This article will help you navigate the different types of Agile metrics, so you can focus on the ones that provide the most value for your development team.
What Are Agile Metrics?
What Are Agile Metrics?
Agile metrics are quantitative measurements that help teams assess their performance, progress, and productivity. They might include metrics like velocity, lead time, or throughput – or data points that provide insights into processes and allow teams to make more data-driven decisions around team performance, quality, predictability, and health.
In short, measuring the right Agile metrics can help teams stay aligned with Agile development principles – flexibility, collaboration, and iterative improvement. By tracking the right indicators, organizations can refine their processes, enhance predictability, and ultimately deliver higher-quality products.
Types of Agile Metrics
Types of Agile Metrics
To narrow down the list of metrics from those you could use to track progress to those you should track, consider which Agile methodology your team follows and what your team goals look like. Some metrics might be more helpful for a team following a Scrum versus Lean methodology, or for a team trying to minimize waste versus optimize workflows.
Here are different types of Agile metrics you should consider based on how your team operates:
- Scrum Metrics: Since Scrum teams work in time-boxed iterations, consider metrics that measure sprint progress, iterative delivery, and team efficiency. These might include metrics like velocity, sprint burndown, and commitment reliability.
- Kanban Metrics: Kanban teams focus on workflow efficiency and minimizing bottlenecks and blockers. Therefore, you might monitor metrics like cycle time, throughput, and work-in-progress (WIP) limits.
- Lean Metrics: With Lean teams prioritizing efficiency and minimizing waste, they might track Agile metrics like lead time, flow efficiency, and cumulative flow design.
- Cross-Methodology Metrics: Some metrics apply across multiple Agile methodologies, helping teams improve predictability and quality. These might include defect density, deployment frequency, and team health metrics.
12 Agile Metrics to Track Based on Agile Methodology
12 Agile Metrics to Track Based on Agile Methodology
You should tailor your reporting strategy to your team’s specific goals and objectives. If you’re not sure where to start, consider the following metrics for Scrum, Kanban, Lean teams, and more.
Velocity
Best for: Scrum methodologies.
Velocity measures the amount of work your team can tackle during a single Sprint and is calculated by combining the estimates of the User Stories, requirements, or backlog items completed during the iteration. Tracking your team’s velocity helps plan future sprints more effectively by setting realistic expectations for workload capacity.
Sprint Burndown
Best for: Scrum methodologies.
A sprint burndown chart is a visual representation of the remaining work during the Sprint. The x-axis represents time, and the y-axis represents the remaining effort. By tracking sprint burndown, teams can quickly identify scope creep and adjust plans to meet sprint goals on time.
Commitment Reliability
Best for: Scrum methodologies.
Compares planned versus completed work to assess predictability. Teams with high commitment reliability are better at forecasting and delivering on their promises, which improves stakeholder trust and sprint planning accuracy.
Cycle Time
Best for: Kanban methodologies.
Cycle time is the amount of time it takes for your team to complete an item of work once it’s started. Shorter cycle times generally indicate a more efficient process or team. Tracking this metric helps teams identify bottlenecks and optimize their workflow.
Throughput
Best for: Kanban methodologies.
This measures the average number of items (user stories, requirements, etc.) your team delivers in a specific interval (day, week, month, etc.). Higher throughput generally indicates a well-functioning team with a streamlined process.
Work in Progress (WIP)
Best for: Kanban methodologies.
The WIP metric shows the number of tasks or work items that are currently in progress. Limiting WIP is a common strategy to ensure focus and reduce context-switching, which leads to faster delivery and better team efficiency.
Lead Time
Best for: Lean Agile.
Lead time is the total time from the moment a new task is added to the backlog until it’s completed. This includes backlog time, waiting time, and the time during which the work is actively being done. Reducing lead time improves responsiveness to customer needs and operational efficiency.
Defect Removal Efficiency
Best for: Lean Agile.
This measures how effectively your team finds and fixes defects before shipping. A higher percentage implies a better quality assurance process, leading to more reliable software and improved customer satisfaction.
Flow Efficiency
Best for: Lean Agile.
Flow efficiency compares active work time to waiting time to assess bottlenecks. Improving this metric means reducing delays and optimizing team workflows for faster delivery.
Customer Satisfaction Score (CSAT)
Best for: Any methodology
CSAT is among the most significant Agile KPIs. It measures customer satisfaction with your product quality. Teams use surveys or direct feedback to gauge how well their Agile processes result in products that meet customer expectations. Depending on your organization, you may choose to track Net Promoter Score as well (or instead).
Employee Satisfaction
Best for: Any methodology
Agile isn’t just about customer satisfaction – it’s also about keeping your team happy. Regular surveys or retrospectives can be used to gauge morale, teamwork, and engagement, which helps retain talent and improve productivity.
Best Practices for Tracking Agile Metrics
Best Practices for Tracking Agile Metrics
To get the most value out of tracking metrics, consider putting the following best practices in place.
Best Practice: Make Sure Everyone’s on the Same Page
Implementing Agile metrics in practice demands a disciplined approach from management and individual team members. Make sure all stakeholders understand how they contribute to the project’s success.
Best Practice: Use Standardized Tools and Processes
Use metrics that are accurate by utilizing standardized tools and processes. For example, using a consistent project management software platform can help teams track their progress and compare data across different projects.
Best Practice: Automate Data Collection and Analysis
Automate the collection and analysis of key performance indicators (KPI) data so you can spend less time manually gathering information and instead focus on continuous improvement.
Best Practice: Adjust Based on your SDLC Approach
Metrics should align with the team’s software development lifecycle, especially in DevOps environments where development processes and operations collaborate. Traditional development-centric metrics may not encapsulate this holistic approach, meaning you may need to reevaluate existing benchmarks or develop new ones. If your team shifts to DevOps or changes its methodology, consider whether you need to track new metrics for success.
Best Practice: Maintain Data Integrity
To scale Agile metrics across an organization or multiple projects simultaneously, it is crucial to have robust systems capable of handling significant volumes of data while maintaining accuracy and reliability.
Best Practice: Don’t Overlook Data Security
Take precautions when collecting, storing, and analyzing project-related data to prevent unauthorized access and tampering.
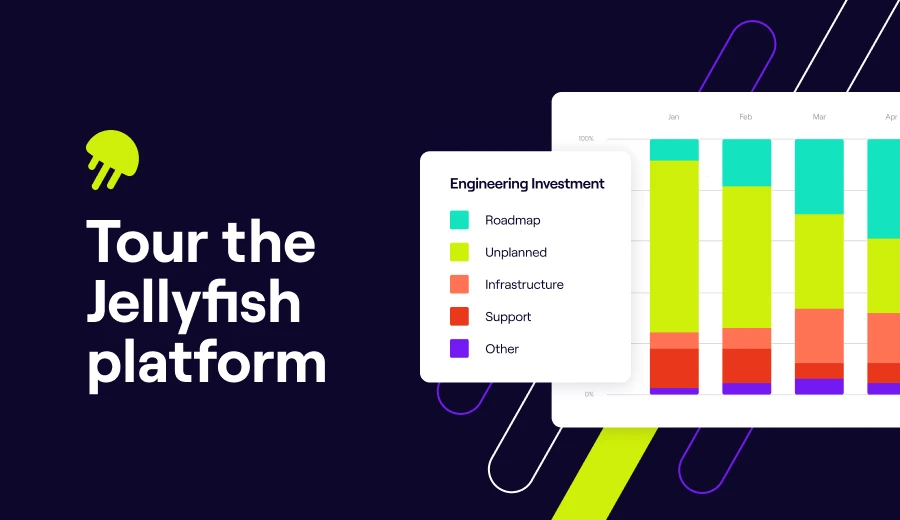
Ready to Drive Engineering Impact?
Tracking Agile metrics is just the first step – acting on them is where real impact happens. An engineering management platform like Jellyfish can help teams better track and take action on Agile metrics, for improved efficiency and smarter decision-making. Schedule a demo or take an interactive tour now.
Take a TourAgile Metrics FAQs
Agile Metrics FAQs
What are story points in Agile, and how are they used?
Story points are a unit of measure that some Agile teams use to estimate the relative effort or complexity of a user story. They help teams plan and prioritize work by giving a sense of how much effort different tasks require, rather than relying on time-based estimates. Story points consider factors like technical difficulty, risk, and uncertainty.
How does Agile project management use metrics to improve outcomes?
Agile project management uses a variety of metrics to drive decision-making, enhance visibility, and support continuous improvement. Metrics like velocity, story points, cumulative flow diagrams, and release burndown charts help teams understand performance, manage risks, and deliver value more predictably.
How can I track project progress in Agile?
Track project progress in Agile using tools like burndown charts, burnup charts, cumulative flow diagrams, and visual dashboards. These tools offer real-time insights into completed and remaining work, helping teams and stakeholders assess whether the project is on track to meet goals.
Which metrics help measure team productivity in Agile?
Team productivity in Agile is often measured using metrics like velocity (average story points completed per sprint), cycle time, and throughput. Cumulative flow diagrams also provide visibility into how smoothly work is progressing, while daily standups help surface blockers that might affect productivity.
What is a cumulative flow diagram (CFD) in Agile?
A CFD is a visual representation that shows the number of work items in each stage of the workflow over time. It helps Agile teams identify bottlenecks, monitor work-in-progress limits, and maintain a steady flow. By analyzing a CFD, teams can improve efficiency and track overall project progress.
What is a control chart, and why is it useful in Agile development?
A control chart visualizes the cycle time of completed work items over a defined time period. It helps teams spot trends, outliers, and variability in their process, making it easier to identify areas for improvement and maintain a consistent delivery rhythm.
What’s the difference between a CFD and a control chart?
A CFD focuses on workflow states over time, helping teams detect bottlenecks and optimize flow. A control chart, on the other hand, tracks cycle time for completed work items, showing variation and consistency in delivery. Both are valuable tools for improving Agile processes.
How is code coverage used in Agile development?
Code coverage measures the percentage of code that is tested by automated tests. In Agile development, it helps ensure that new features and changes are thoroughly tested, reducing the risk of bugs. While high coverage is useful, it should be balanced with test quality and relevance.
What should an Agile dashboard include?
An Agile dashboard should include key metrics that provide insights into team performance and project health. This may include velocity, cumulative flow diagrams, burndown charts, code coverage, and any current blockers or risks. Dashboards support transparency and help stakeholders make informed decisions.
How do dependencies affect Agile projects?
Dependencies between teams, features, or external systems can introduce delays and increase risk in Agile projects. Identifying and tracking dependencies early helps teams plan more effectively, reduce blockers, and deliver work in a more predictable and coordinated way.
What is a release burndown chart?
A release burndown chart shows how much work remains in a release, typically measured in story points. It provides a visual trend line that helps teams and stakeholders assess whether the release is on track, so they can make proactive adjustments if needed.
Why are standups important in Agile development?
Standups are short daily meetings where team members share what they worked on, what they plan to do next, and any blockers they’re facing. While not a metric themselves, standups help maintain transparency, foster collaboration, and surface issues early so they can be addressed promptly.
Is there a standard Agile template for reporting metrics?
Yes, many teams use standardized templates for reporting Agile metrics. These templates typically include sections for velocity, burndown or burnup charts, cumulative flow diagrams, blockers, and sprint goals. Using a consistent template streamlines communication and helps track progress across sprints.
What time period should I use when analyzing Agile metrics?
Agile metrics are typically analyzed over a sprint duration, which often ranges from one to two weeks. Reviewing metrics across multiple sprints helps identify trends, measure improvements, and inform planning decisions. Longer time periods may be used for release-level or quarterly insights.
About the author

Lauren is Senior Product Marketing Director at Jellyfish where she works closely with the product team to bring software engineering intelligence solutions to market. Prior to Jellyfish, Lauren served as Director of Product Marketing at Pluralsight.