In this article
Engineering leaders everywhere are under pressure to answer a deceptively simple question: Is AI really driving impact across my organization? At the same time, they’re being pushed by their CEOs and Boards to do “more” with AI and invest wherever and whenever possible.
So far, that usually amounts to finance agreeing to sign off on a multitude of tools while the team figures out which tools are best for which use cases – and whether they’re actually delivering value. Some teams love one tool, others gravitate towards another. As a CTO or VP of Engineering, you don’t necessarily care which tool an individual prefers – you care about adoption at scale and measurable business outcomes.
But figuring out which tool is best for which use case is usually based on feelings and conjecture – not data. That’s why we built AI Impact Multi Tool Comparison. It helps leaders not only show that AI is improving cycle times and throughput, but also compare tools side-by-side to make smarter investment and consolidation decisions.
Here’s how to get started with Jellyfish’s AI Impact Multi Tool Comparison.
Measuring AI’s Overall Impact Across Tools
Measuring AI’s Overall Impact Across Tools
The first step to getting the most out of your AI investments isn’t choosing the “best” AI tool – it’s confirming whether AI is being adopted efficiently and improving outcomes as a whole across your organization. Leaders need evidence that AI is worth the investment, regardless of which tools are in play.
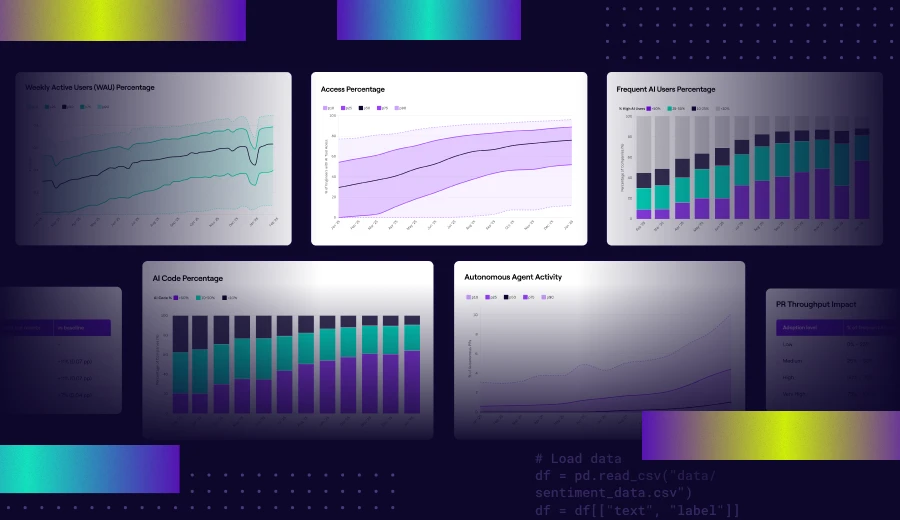
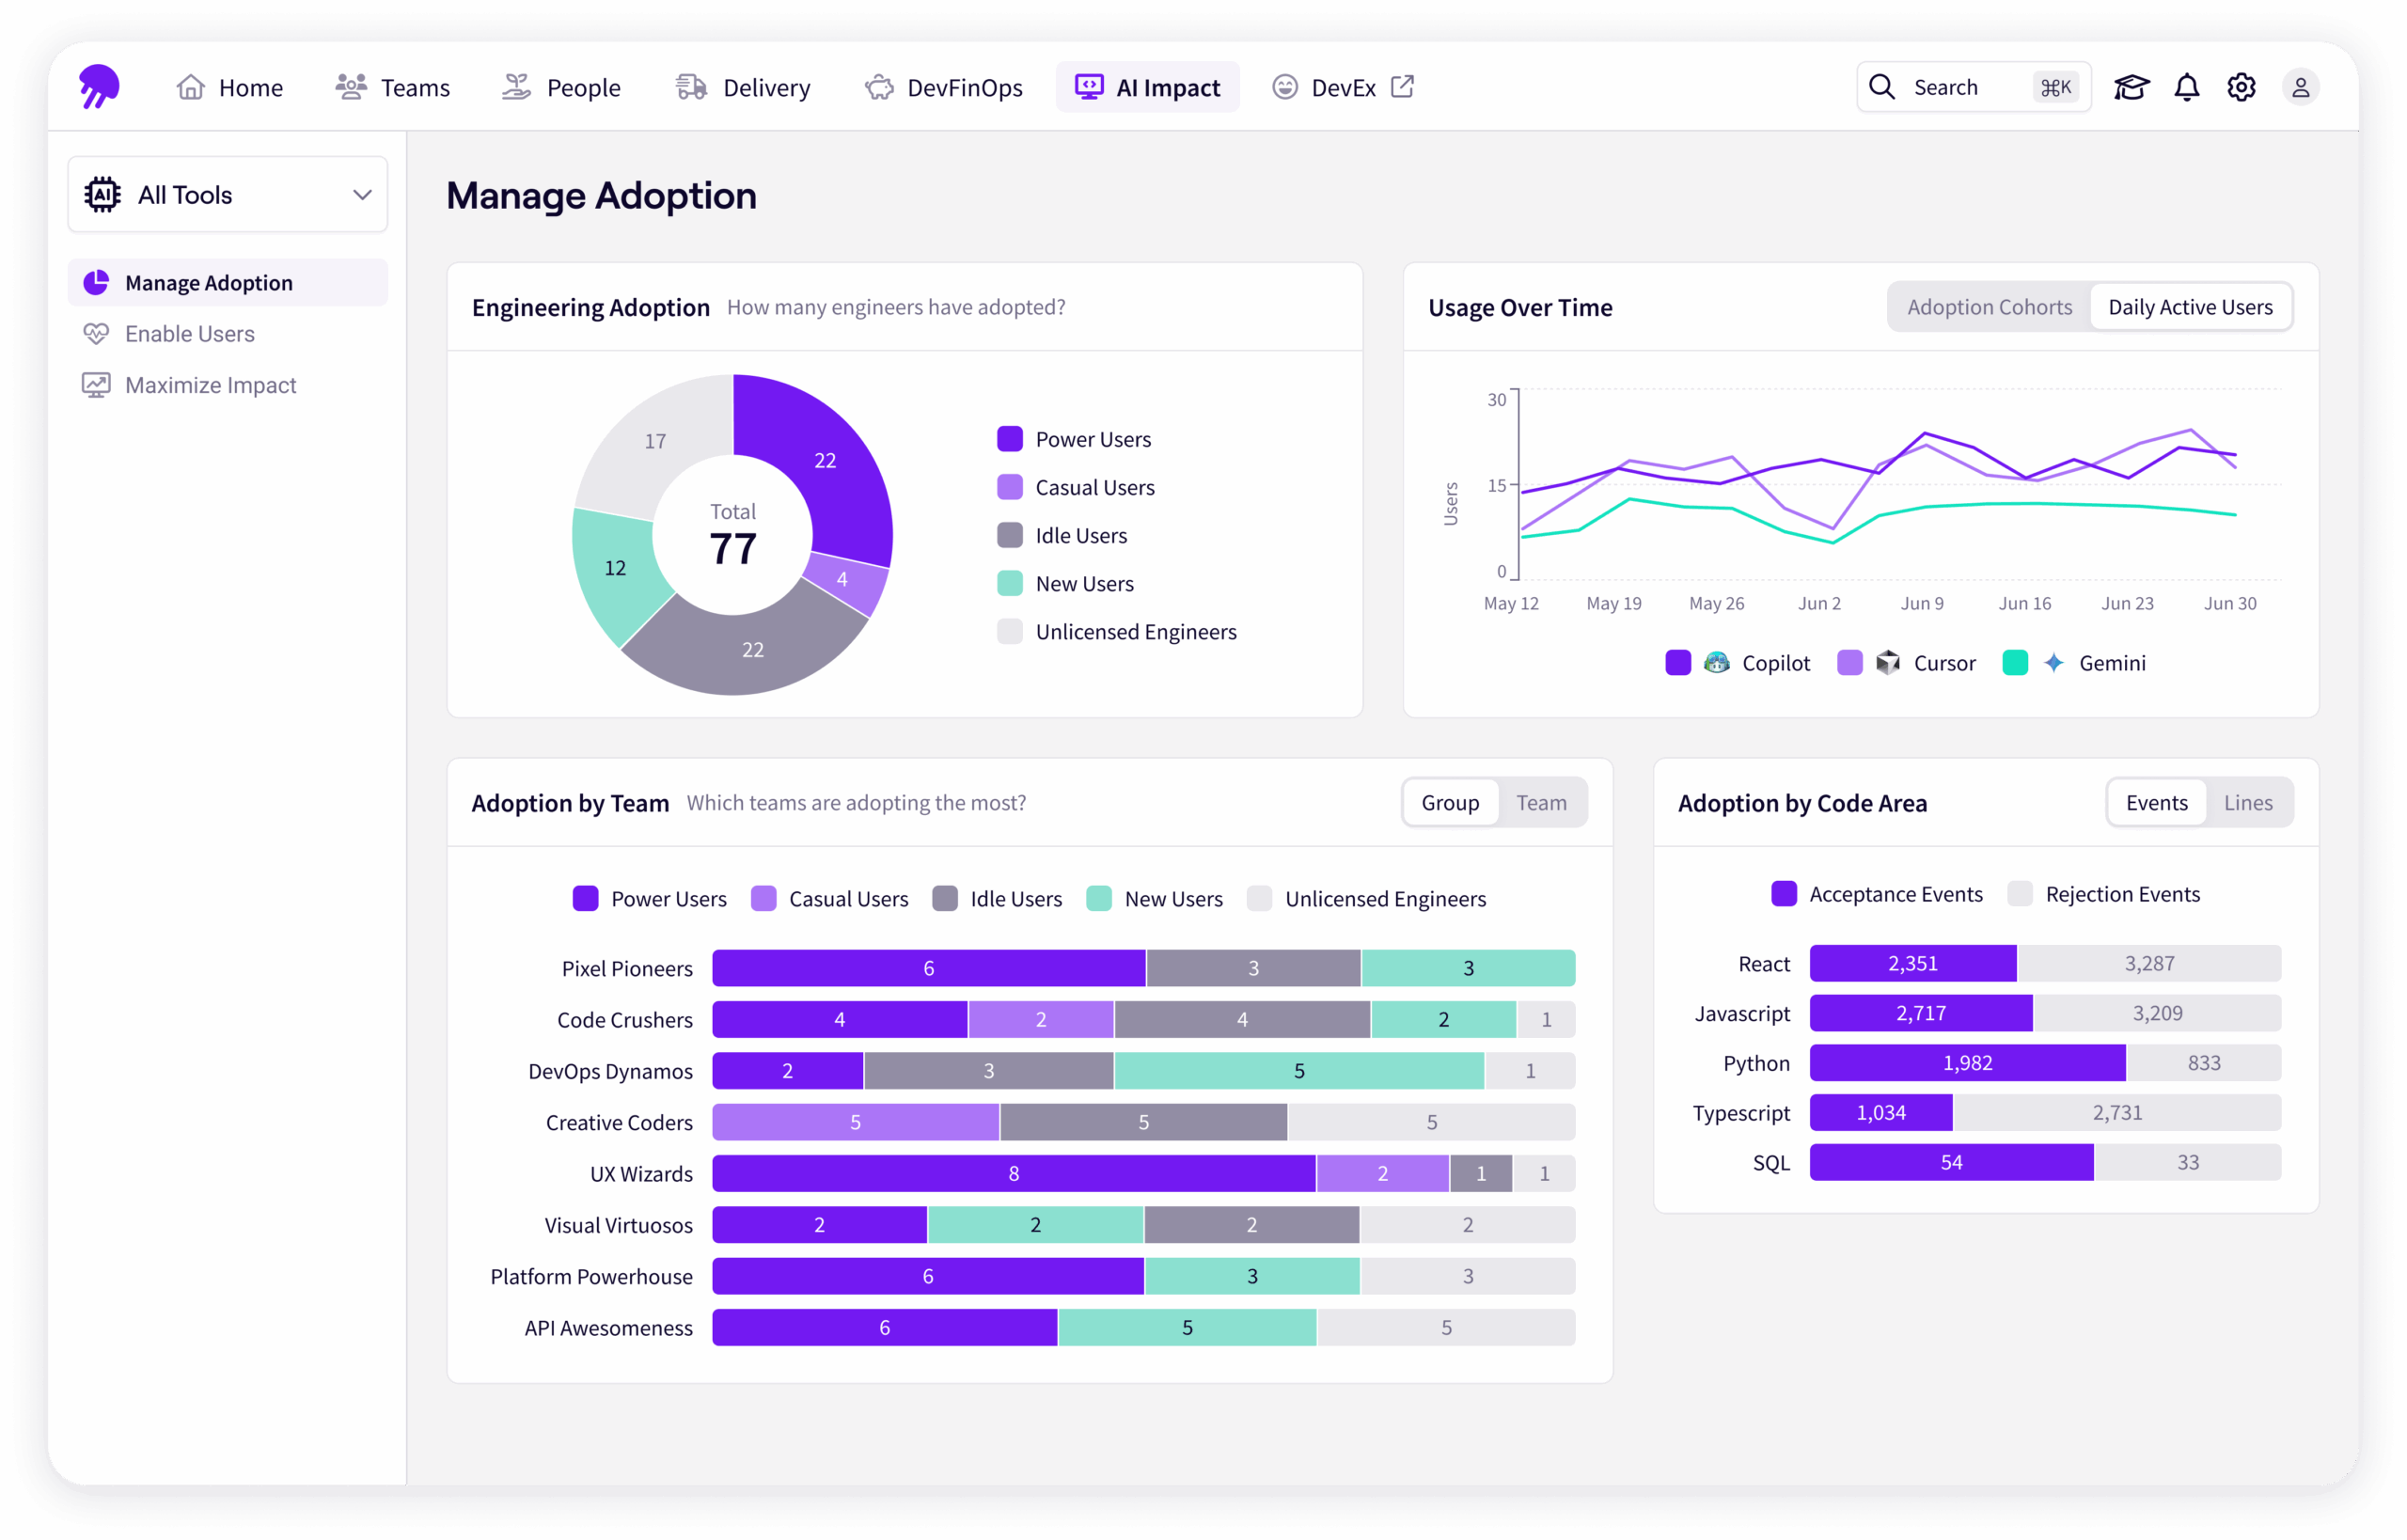
You can do this in Jellyfish with the All Tools Manage Adoption and Enable Users views where you can measure:
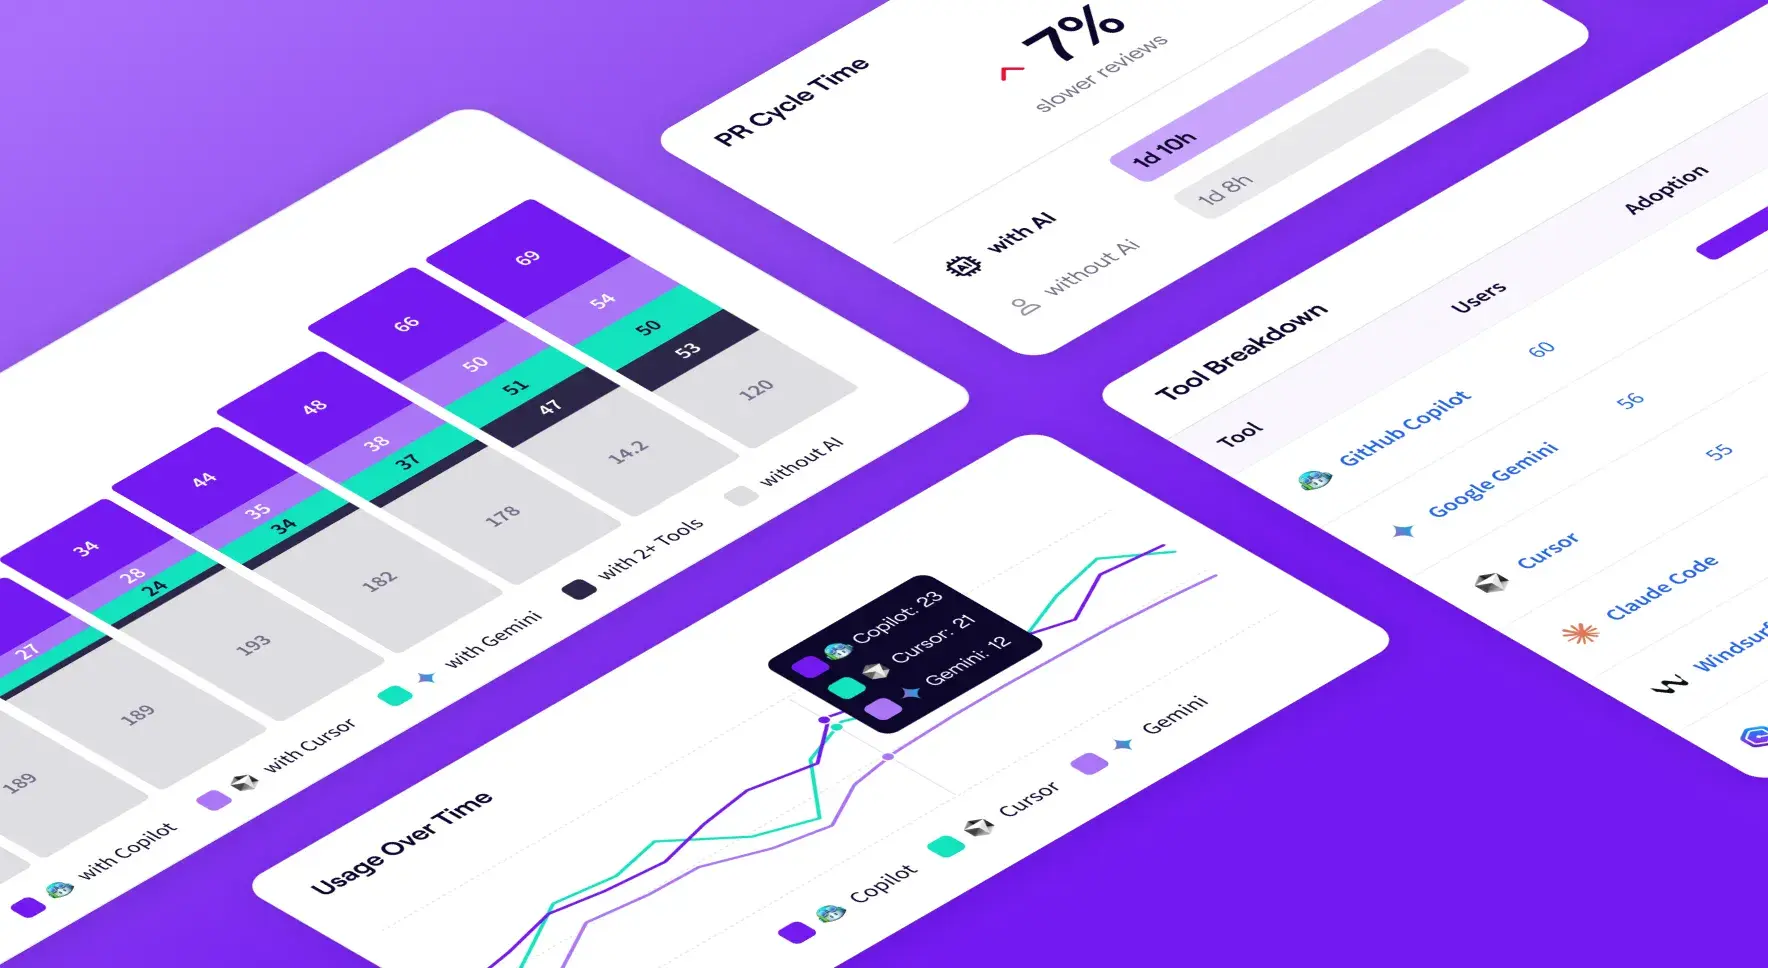
- Adoption across your full AI tech stack: See how many developers are power users, casual users, idle, or new, no matter which tool they’re using.
- Usage trends over time: Track growth in adoption and usage across all AI tools combined.
Comparing Tools to Guide Consolidation Decisions
Comparing Tools to Guide Consolidation Decisions
Once you have a handle on how general AI use and impact is trending, you can view the adoption and impact of particular tools.
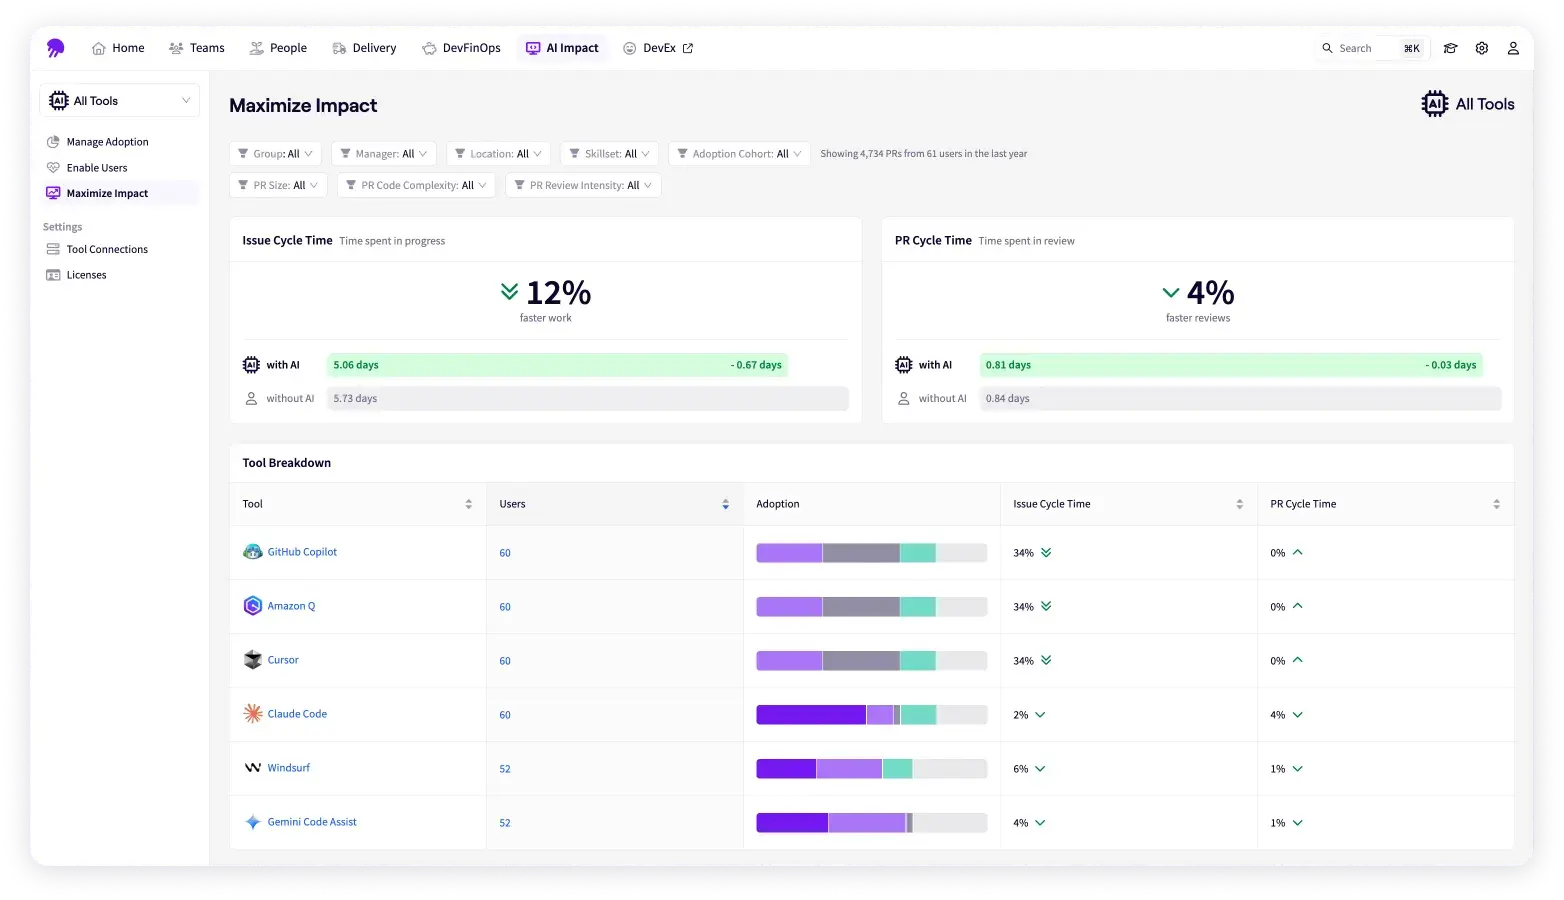
With Multi Tool Comparison under Maximize Impact, you can see:
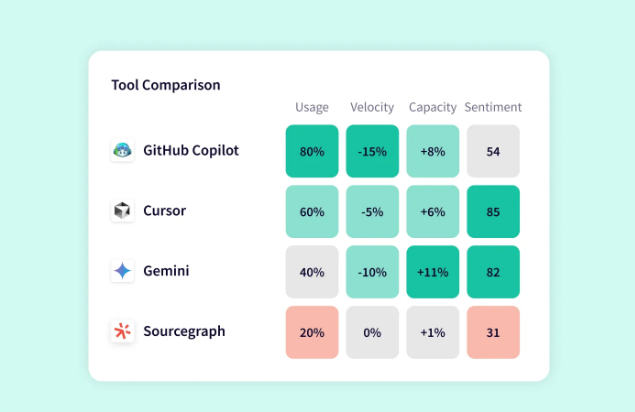
- Daily users by tool: Which tools are gaining traction? Which are losing steam?
- Usage trends over time: How is tool preference shifting month to month?
- Overall impact on key metrics: Compare issue cycle time, PR cycle time, and throughput with AI vs. without AI for each tool and across your tech stack.
These features makes it easy to answer questions like:
- “Which tools are most widely adopted across my organization?”
- “Which ones are actually reducing cycle times?”
- “Where should we double down investment – and where can we cut?”
Armed with these insights, engineering leaders can make data-driven consolidation decisions and ensure AI budgets are being spent wisely.
Getting Started with Multi Tool Comparison
Getting Started with Multi Tool Comparison
Getting started with Jellyfish’s AI Impact Multi Tool Comparison simple. If you’re already a Jellyfish customer:
- Open the All Tools view: See overall adoption and usage across your org.
- Check adoption breakdowns: Power, casual, idle, and new users by tool.
- Switch to Maximize Impact: Compare issue and PR cycle times with and without AI.
- Review the Impact Table: Dig into tool-by-tool breakdowns for adoption and performance.
- Share results: Use these insights in budget conversations with finance or tool strategy discussions with leadership.
💡Pro Tip: When presenting screenshots to team members and executive stakeholders, focus on trends and categories rather than specific tool “winners.” The value lies in identifying impact patterns, not promoting one tool over another.
- Don’t chase a “winner”: Instead, focus on which tools are improving the metrics that matter most to you.
- Balance adoption with impact: A widely used tool that doesn’t improve cycle time may not justify long-term investment.
- Use the data to align stakeholders: Finance wants ROI, engineering wants efficiency, and product wants speed – Multi Tool Comparison gives you the evidence to satisfy all three.
If you’re looking to get started with Jellyfish AI Impact, you can get a demo and learn more here.
What’s Next
What’s Next
Today, many companies are in a “laissez-faire” era of AI investment. CFOs are signing checks for multiple tools, letting teams experiment freely. But this won’t last forever. Eventually, most organizations will consolidate from five or six tools down to two or three.
Over time, Jellyfish will make it possible to compare tools by type of work – for example, which AI tools are most effective for roadmap projects, KTLO work, or achieving quality targets.
Why does this matter? Because the reality is no single AI tool will be best at everything. The future is about matching the right tools to the right work – and Jellyfish is already helping leaders make these nuanced decisions.
Make Smarter AI Decisions with Jellyfish
Jellyfish AI Impact helps you see how your teams are adopting and benefiting from AI.
Get a DemoAbout the author

Ryan Kizielewicz is a Product Manager at Jellyfish.