
April 12, 2023
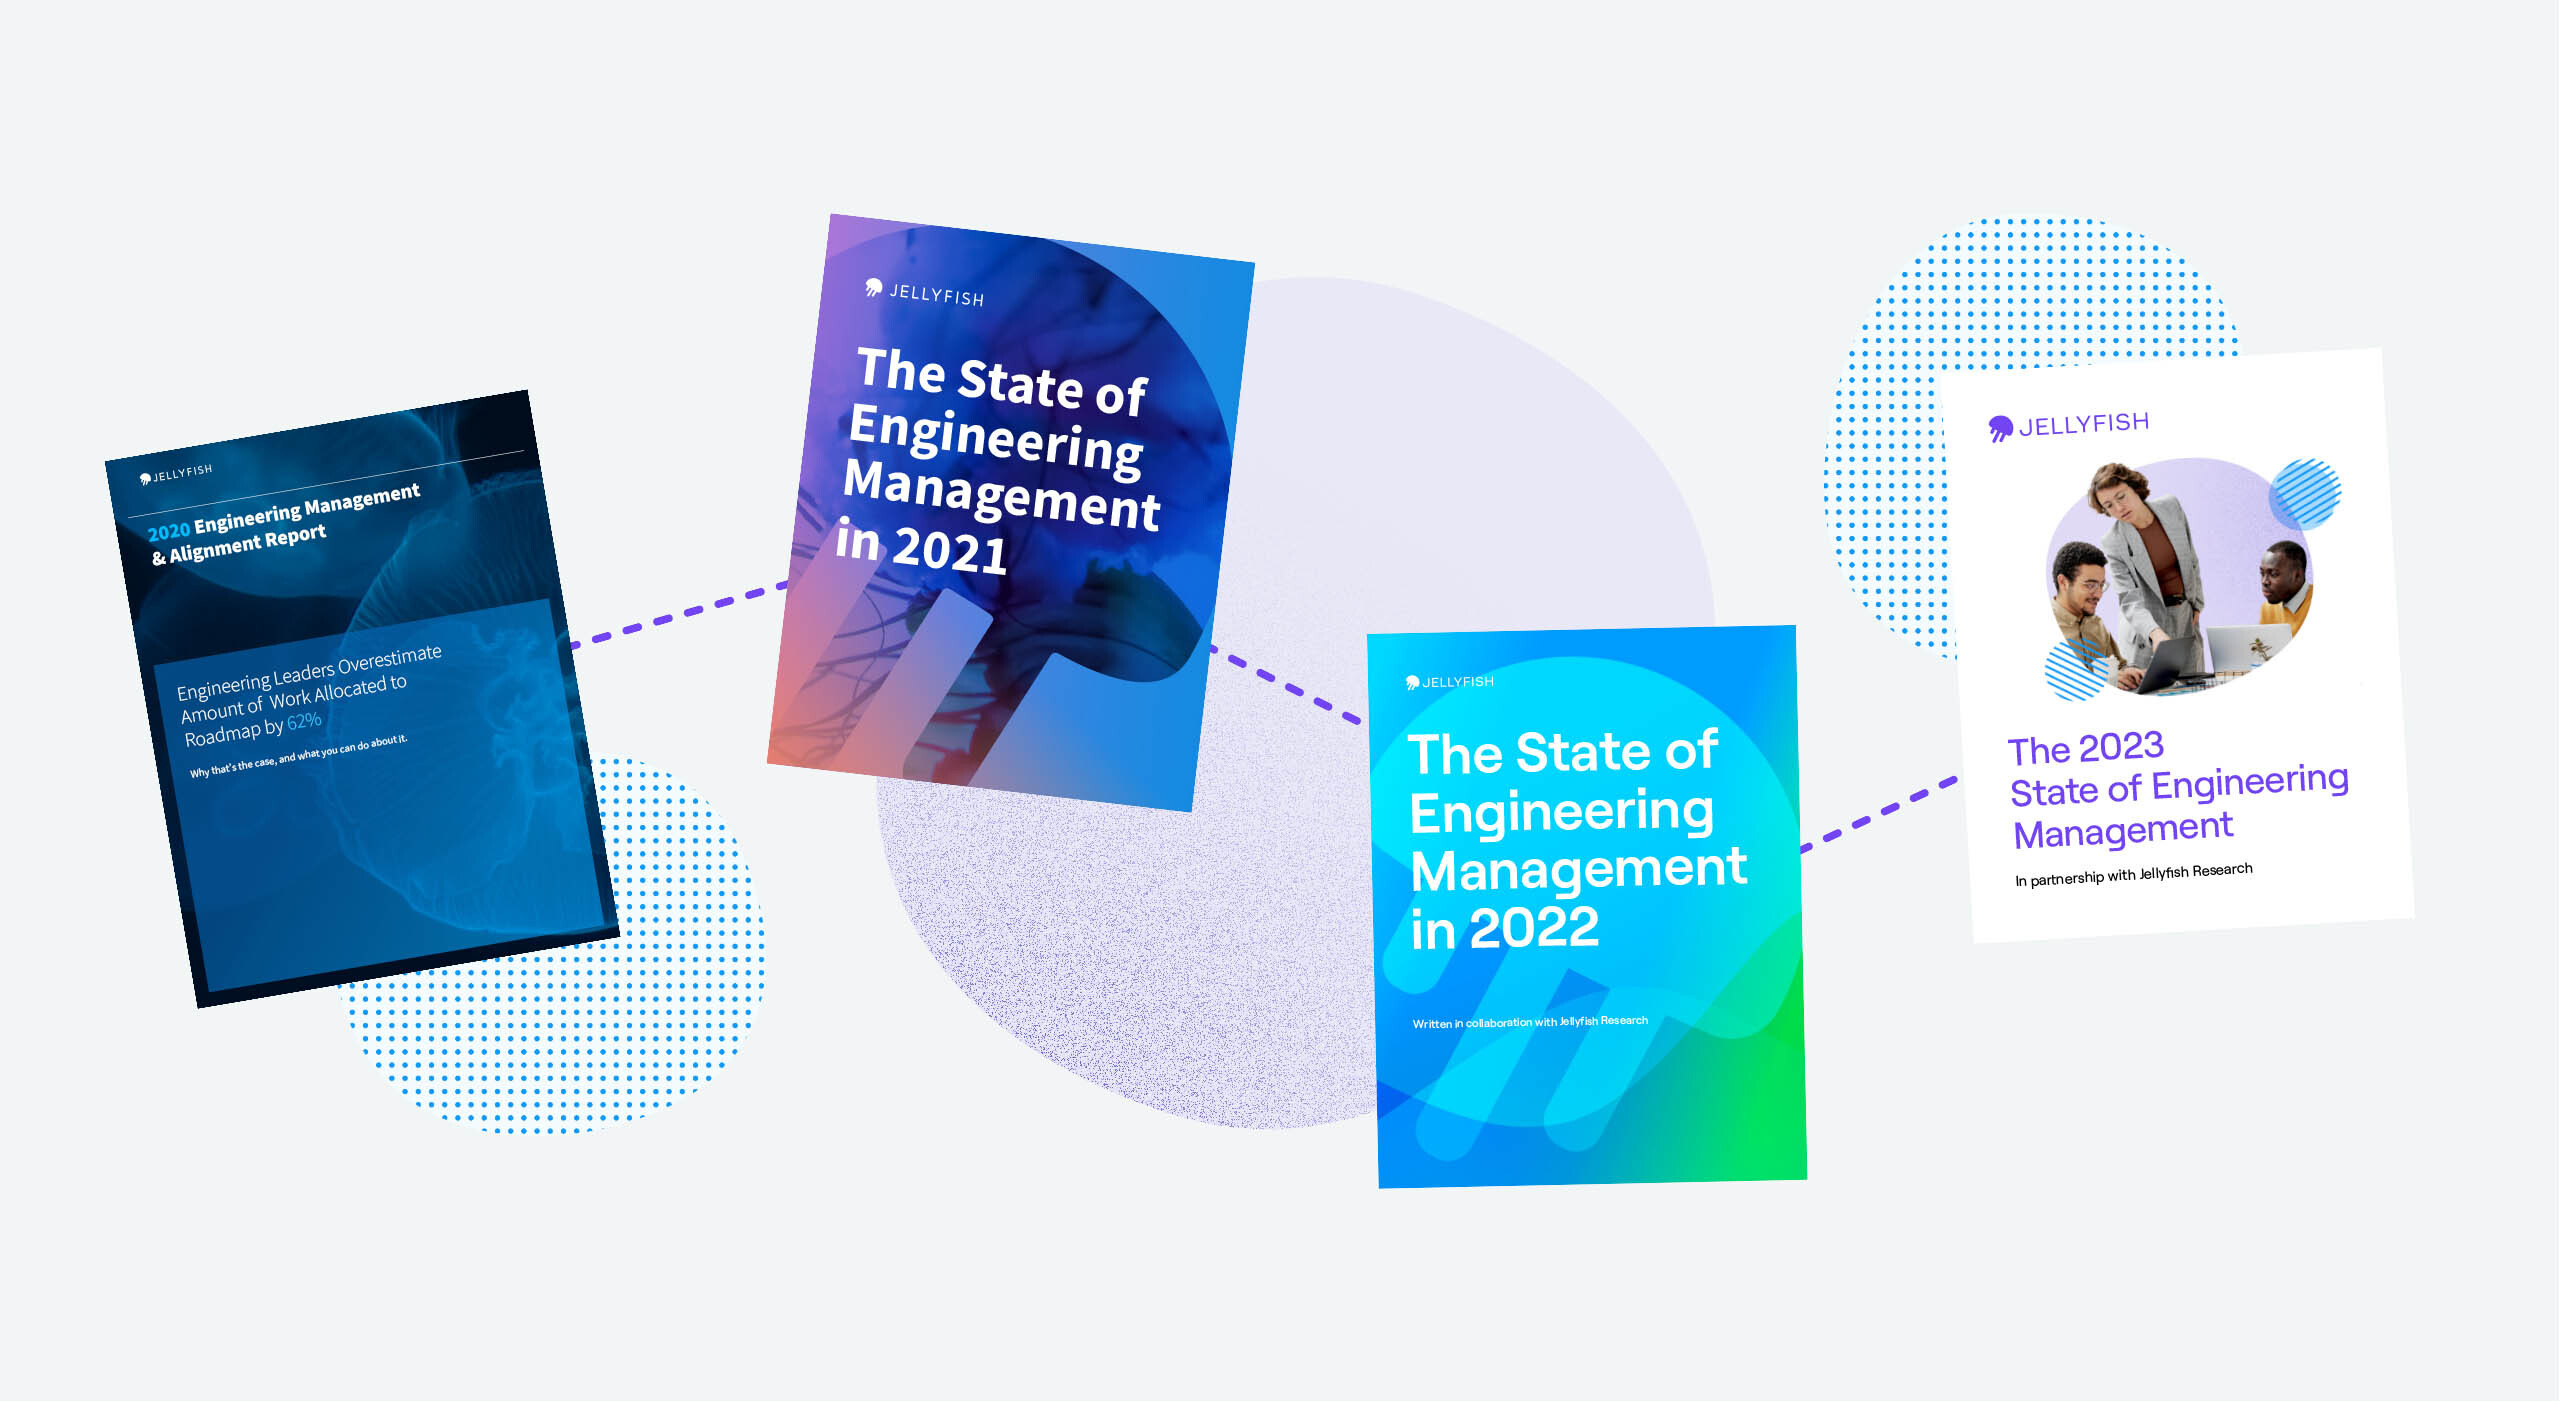
The Jellyfish team has released the State of Engineering Management Report for the fourth consecutive year. It’s an enormous research effort, which began as an internal effort to better understand the way that engineering teams operate, what’s top of mind for engineering leaders, and the role that engineering leadership plays in enabling, supporting, and empowering teams to accomplish their goals. We’re in a unique position wherein our Engineering Management Platform has accumulated a massive dataset about engineering team behavior from the signals it processes across hundreds of engineering teams and from a variety of different sources. As we compiled our findings, we realized they could be insightful to the broader community – hence the State of Engineering Management was born.
As we celebrate the 4th year of the State of Engineering Management Report, we thought it only appropriate to stroll down memory lane and look back at the most profound insights from the report over the past four years. For those of you who have just begun following our blog, we hope some of these insights will be fresh to you, and spark some thought as to how you can apply these insights to better lead your teams in 2023.
Let’s dive in.
2019: Engineering leaders overestimated roadmap work by 62%.
Yes, you read that correctly. Before Allocation benchmarking data was readily available, leaders could not quantify how much their teams actually focus on roadmap work vs other types of work. Engineering Management Platforms brought a sobering level of self-awareness about the various different ways engineering teams are pulled in different directions. Every leader wants their team to be focused on only the highest priority initiatives, but prior to Allocation measurement, gauging team “focus” was based on qualitative feedback alone, or else it was especially intrusive.
Engineering Allocation towards Growth/Innovation work sits anywhere between 20-45% for the majority of companies, but it varies by company stage, current priorities, industry, etc. In the past four years, leaders have become much better at estimating the total work toward their roadmap, but it’s interesting to look back and see how far we’ve come in just a few years.
2020: Leaders underestimated unplanned work by over 81%
The global pandemic of 2020 changed the way that we work and live, and we saw its direct impact within 2020 data. Teams shifted to remote work models, which drastically increased the amount of unplanned work teams took on.
Today, as leaders assess the effectiveness of their organization’s current work model post-pandemic, it’s fascinating to look back at this data. Although leaders voiced productivity as a top challenge in 2020 – with concerns about how teams would adapt to fully remote work – the data show engineering teams actually increased productivity during this time period. Here are just a few productivity standouts from 2020:
- 18% more issues resolved
- 6% more commits
- 18% increase weekly coding days
These productivity metrics trended positively as engineers rallied in the face of unprecedented adversity. During this time, the types of work shifted drastically from 2019. Visibility was a key concern heading into 2020 to ensure that teams were enabled to work on roadmap, and not become reactionary to the influx of unplanned work.
- Teams spent 14% more time on customer support
- Spent 5% less effort on roadmap work
- And spent 53% on unplanned work.
2020 was a year where we learned about the possibilities of our engineering teams, and the value of visibility through data-driven insights.
2021: Planned infrastructure work up from 6% to 19% while visibility remained a challenge
Engineering teams responded to the challenges of 2020 with a renewed focus in 2021. Teams saw higher levels of work towards innovation and growth, while also drastically increasing infrastructure work. Teams were preparing for future growth, hiring more, and making significant improvements operationally.
Here are just a few standouts from the 2022 data:
- Planned infrastructure work increased from 6% to 19%.
- Average issue cycle time decreased by 12%
- Average issues resolved per week were up 5%
- Visibility remained a challenge with unplanned or undocumented work at 22%
Across four years: data-driven teams achieve better outcomes
When looking back at the data from the last three years, one finding remained consistent year after year: data-driven teams leveraging EMPs consistently see better outcomes across business alignment, operations, and delivery management.
Here are just a few examples from the past couple of years that illustrate this point:
In 2020:
- Data-driven teams put 25% more resources toward innovation, planned roadmap work, and new feature work compared to non-EMP users.
- Data-driven teams spent 18% less time on customer support bugs and issues compared to non-EMP users.
- Data-driven teams decreased their issue cycle times by 23%
- Data-driven teams increased the number of issues resolved and PR merged monthly by 17%
In 2021:
- Data-driven teams put 29% more resources toward growth and innovation initiatives compared to non-EMP users
- Data-driven teams spent 48% less time on unplanned work compared to non-EMP users
- Data-driven teams saw throughput increase by 15%
- Data-driven teams reduced cycle times by 17%
So how did data-driven teams fare in 2022? In short, data-driven teams appear better positioned to adapt to the shifting economic climate.

Across many engineering operational metrics, you can see measurable improvements as teams adopted Engineering Management Platforms. Tempo, throughput, collaboration, and planning were all positively impacted by the introduction of Engineering Management Platforms in 2022. EMP users were able to keep unplanned work at less than 15% (46% less than non-EMP users) while increasing growth and innovation work to 47% of total work in 2022 (31% more than non-EMP counterparts.

Looking Ahead
Jellyfish was built with the Data Science and Research team at its core. They work with every team that builds or sells our product. Four years after publishing their initial research findings, they continue to advance the practice of engineering leadership with the actionable insights from this report. We hope to continue to provide meaningful insights from this research for many years to come.
To see the full findings from this year’s report – the 2023 State of Engineering Management Report – download it here today.