In this article
6 Board Slides for R&D Leaders
Adam Ferrari is a Jellyfish Advisor, board member and former SVP of Engineering at Starburst, EVP of Engineering at Salsify and CTO at Endeca. He has nearly three decades of experience serving in the engineering function across all levels and holds a PhD in Computer Science from the University of Virginia. Adam shares his thoughts regularly on his popular engineering blog, Engineering Together.
The following is an abridged post from Engineering Together, which you can read in its entirety here.
Board and executive leaders are typically fluent at reading financials and understanding sales and marketing funnel metrics, but once you get into the guts of engineering, they often feel less grounded in terms of what to look for and what good looks like. To help, Jellyfish released an updated board reporting template, 6 Slides Every R&D Leader Should Show at Board Meetings, now with AI Impact.
Reporting on the engineering function to the board is more than just throwing up a bunch of numbers. Even if the metrics look great, you’ll probably still get a big “so what” without also providing a healthy amount of narrative context. Metrics are necessary but not sufficient for effective board reporting.
So how should we approach this important topic? What data should we present? And, equally importantly, how should we approach setting the narrative stage for that data?
This is where the Jellyfish’s recommendation comes in. Let’s take a closer look at how to use the template.
To get started on your own, you can access the template here.
R&D Investment Distribution
1. R&D Investment Distribution
The first slide shows the investment allocation of the organization. This is probably the view where I’ve had the most substantive discussions in actual board meetings over time – how are we investing and why?
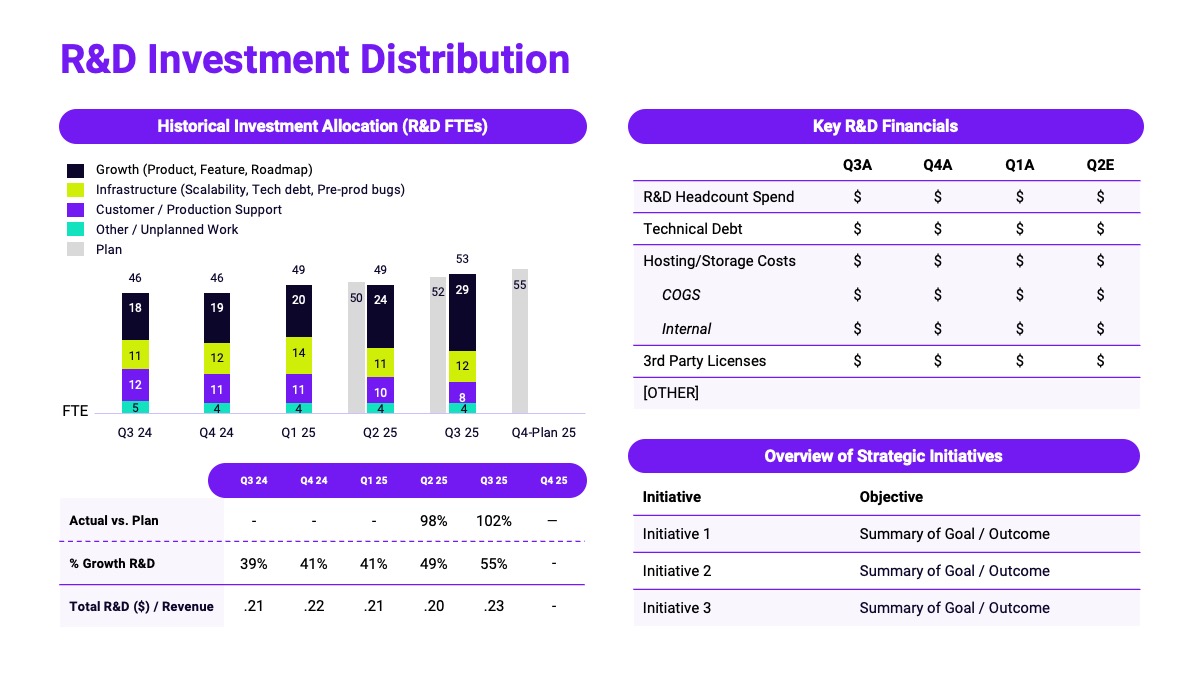
This includes breakdown into categories such as “growth” versus “customer retention” which often have a very direct connection to the business plan. And I’ve often added additional breakdowns, e.g., showing allocation by product line or onto certain strategic product initiatives, that directly clarify how engineering is balancing the needs of product strategy with other required investments such as support and maintenance.
It’s also wise on this slide to include key organizational initiatives. If you have set the table with appropriate engineering strategy context, these should illuminate the high level investments you’re making in the organization to effect the needed change.
Deliverables
2. Deliverables
Of course, no view of engineering is credible without a high-level look at key roadmap deliverables, both key new items shipped in the prior quarter, and planned releases for the quarter ahead. The art in presenting deliverables is in achieving an appropriate level of detail for your scale and stage.
As a simple heuristic, look for items that represent multiple percentage points of investment capacity, or that play a particularly important role in achieving the stated product strategy. And above all, make sure to develop labels or names for investments that assume little or no knowledge of the product details. Investment names need to be as self explanatory as possible!
Delivery and Operations
3. Delivery and Operations
A key question on the mind of most software company boards in recent years has been efficiency. Is the org productive and delivering value per dollar invested at close to the efficient frontier of other leading organizations? It’s a hard thing to measure directly, since every product and every organization is different. But fortunately, the industry has arrived at fairly well established proxies for productivity.
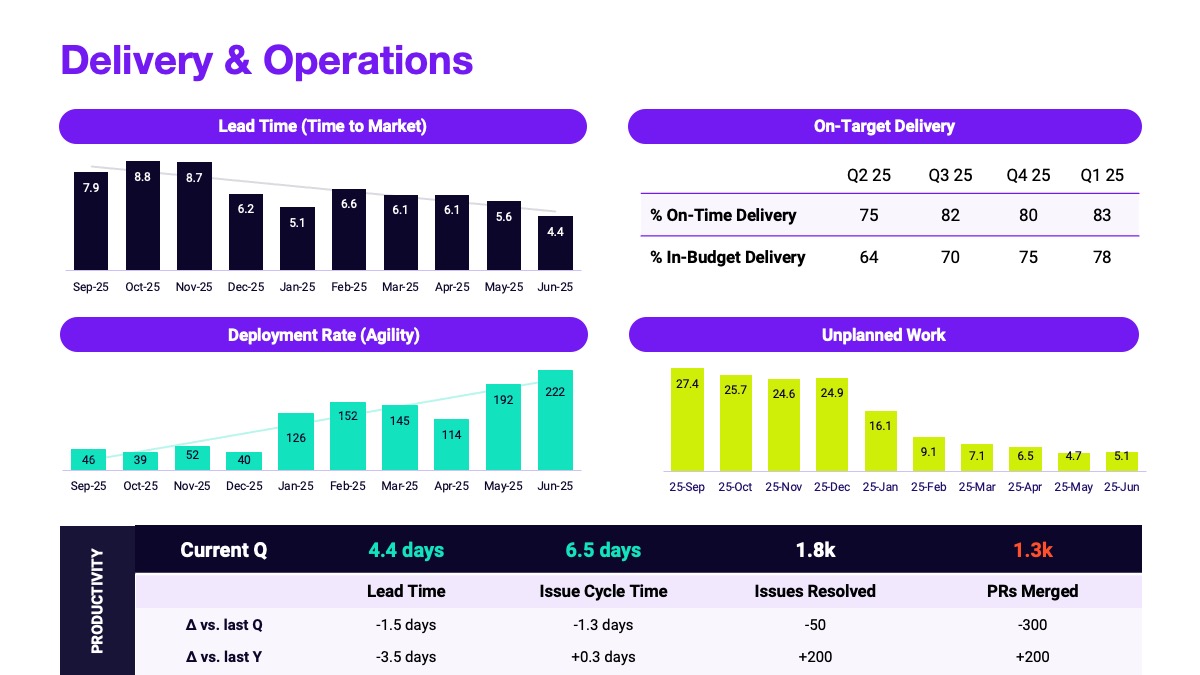
The DORA organization has been a leader in studying these, looking at the strong relationship between metrics like lead time for changes and deployment rate and high-level business outcomes.
Quality
4. Quality
Having explicit and thoughtful data on Quality is essential in most software settings. Quality is often a charged topic because when customers hit quality issues, it can shake confidence and increase real business risk, all of which can lead to charged emotional reactions.
Trends are hard to spot from gut feel alone, especially when emotions are high. Combine this with any related factors, such as delays in customers going live, high profile cases of churn, etc., and it can often lead to an unproductive discussion. Having a strong handle on quality – metrics such as change failure rate, uptime, and mean time to recover (MTTR) – is essential to convey that the engineering org has strong command on where quality stands. This in turn is the foundation for explaining investments in quality, which trade off against roadmap progress.
People
5. People
Of course, talent is absolutely central to any engineering organization. Providing a view of people operations including headcount status, hiring, and ramping, as suggested in the template, are good fundamentals to include.
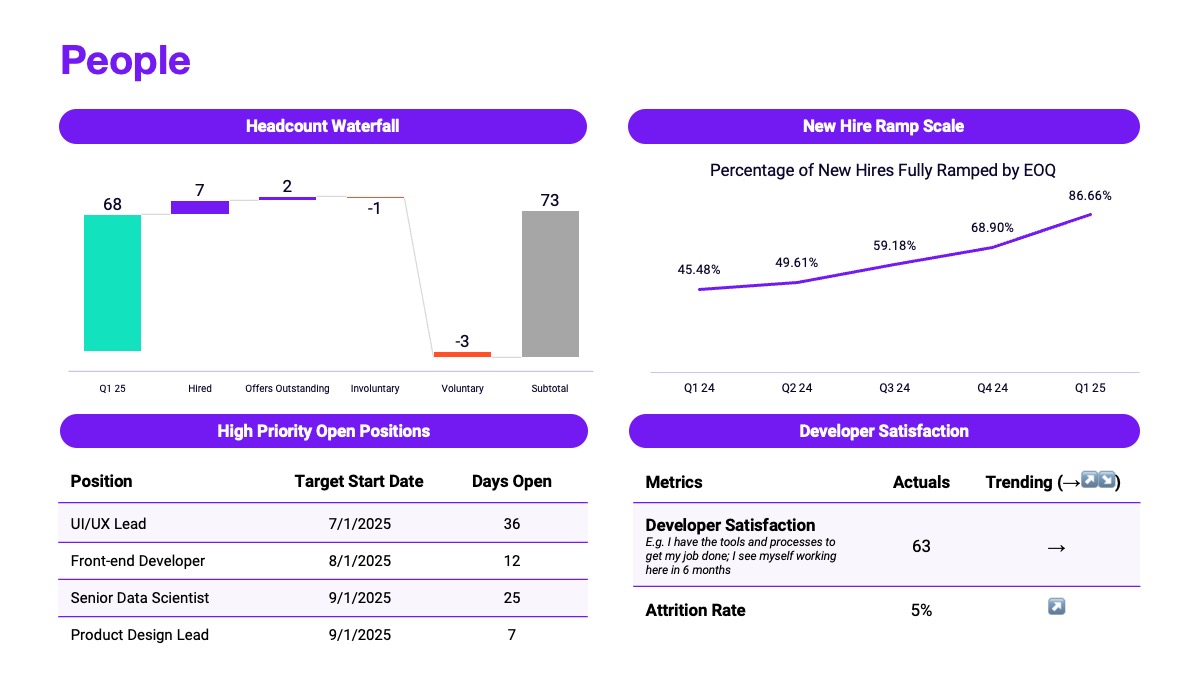
Also as depicted, developer experience scores based on regular engineering surveys have become a well established best practice. In addition to these core measures, it’s worth refreshing on key org structure changes, especially when any big updates are in the works.
Beyond just structure, showing organization makeup along key dimensions such as seniority, discipline (e.g., UX, backend, data engineering, DevOps, etc.), and geography can be helpful as well, especially if changing your talent mix in specific ways is a part of your overall engineering strategy.
AI Impact
Introducing AI Impact
The five areas discussed so far – Investment, Deliverables, Operations, Quality and People – are well established pillars to build around. But at this moment, it would be impossible not to also include specific coverage of the impact of adopting AI into the software development process.
Just a year ago it seemed that board expectations were generally that engineering leaders should be experimenting and figuring out how to get leverage out of AI. But over the past year, with numerous reports of organizations seeing strong gains from AI-assisted development, expectations have moved significantly. At this point, boards are expecting to see production use of AI in the software process, and measurable impact, even if the results are still developing.
While approaches for quantifying AI impact are still evolving, there has been some good progress on frameworks, such as the Jellyfish AI Impact Framework which clearly informed the recommended template here. These frameworks have converged on looking at three levels of AI impact in software development:
- Adoption
- Engineering Productivity
- Business Impact
We see these three levels of visibility in the suggested template. Showing adoption (are engineers using the available tools) alongside engineering impact such as PR cycle time and defect rate, is essential to show that you’re in the game, removing barriers to engineers using and benefiting from the tools. Perhaps even more important, showing a reasonable proxy for business impact is essential, which is the role of the Capacity Impact view on the template. This shows our per-capity issue completion rate – effectively, how much more business output are we getting with the same team.
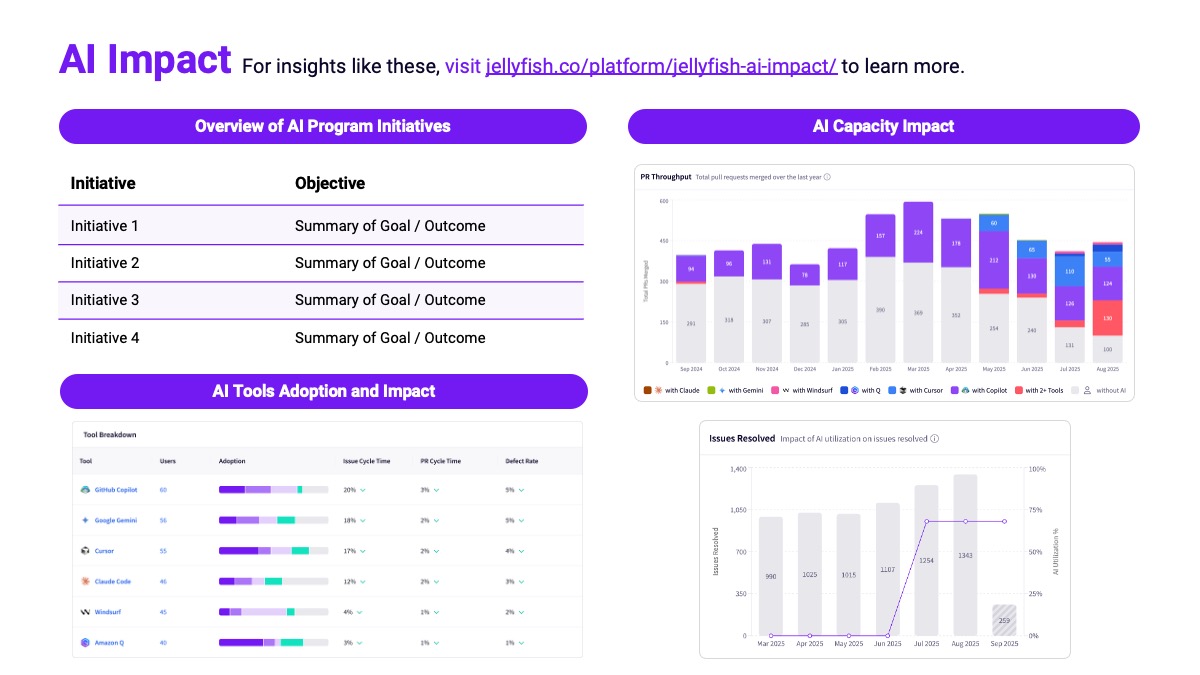
Finally, at the top of the template we see space for program initiatives. This is our opportunity to expose that adopting AI in the SDLC is not like flipping a switch. We need to methodically experiment with different tools, various enablement approaches, and in various phases of development. For example, you might be highly adopted on an AI assistant like Github Copilot while also piloting more agentic development with a tool like Claude Code, and also starting to route some code review workload to an AI agent. Exposing this roadmap shows a thoughtful engagement with this transformational space.
I expect we will see best practices for showing AI impact evolve in the coming year. For example, I believe it’s highly likely boards will want to see measures of financial efficiency in this area, especially since a huge part of the benefit should be unlocking greater productivity and output per overall dollar of R&D investment.
Appreciate The Moment
Starting with a solid template like the Jellyfish deck is a great help in avoiding having to DIY a bunch of data design that’s already been done a million times over. It means you can focus on the really important part, the narrative framing. If the narrative is strong, and if it is well aligned with the company / CEO narrative and other functions, the data tends to be an opportunity to express strong command of the organization’s strengths and challenges.
6 Slides Every R&D Leader Should Show at Board Meetings
Access Jellyfish’s executive board template to get started
Get the TemplateAbout the author

Adam Ferrari is an Advisor to Jellyfish. He is the former SVP Engineering at Starburst and EVP Engineering at Salsify. Subscribe to his newsletter, Engineering Together, here.