In this article
DevOps is a delicate dance of balancing speed, quality, and reliability. Leaders must be able to track project success and pivot quickly if necessary. Enter DevOps metrics.
Whereas general engineering metrics and KPIs might consider engineering performance and product quality across different domains and product types, DevOps metrics are more focused: They prioritize the speed, efficiency, and reliability of software delivery processes.
If you want to leverage DevOps metrics to continuously improve practices, deliver software faster, and achieve development success, read on. In this article, we’ll dive into the basics of DevOps metrics, popular metrics to track, and more.
What Are the Main Types of DevOps Metrics? And Which Should I Track?
What Are the Main Types of DevOps Metrics? And Which Should I Track?
DevOps metrics are quantifiable measurements used to track and assess the performance of your software development and delivery process. You can leverage them to track progress, identify bottlenecks, measure the impact of changes, improve collaboration, and drive a culture of continuous improvement.
Generally, you can think of DevOps metrics in a few categories:
- DORA Metrics: These are a set of four key metrics that measure the effectiveness of your software delivery and operational performance. These are widely accepted as industry standards in the DevOps space.
- Operational Performance Metrics: These assess the stability, reliability, and performance of your systems and applications in production.
- Code Quality and Review Metrics: These evaluate the quality of your code, the effectiveness of code reviews, and the health of your codebase.
- Team Performance and Collaboration Metrics: These measure the efficiency and effectiveness of your team’s workflow, collaboration, and
- Security Metrics: These track your organization’s security posture, ability to respond to vulnerabilities, and maintain the integrity of your systems.
The most important metrics will depend on your specific goals and priorities. For example, you might consider your business objective (e.g., what are you trying to achieve with your DevOps initiatives?), team structure, tech stack, and/or how your team performs compared to industry benchmarks.
22 Common DevOps Metrics
22 Common DevOps Metrics
It can be tempting to track a long list of metrics. However, sometimes it’s best to start small. First, focus on a few key metrics that are most relevant to your current needs and gradually add more as you mature. Here are some of the most common DevOps metrics you might consider when working toward DevOps success.
1. Deployment Frequency
Deployment frequency measures how often your team successfully releases code to production. In simpler terms, it tracks how many times you deploy new features or updates to your users. Deployment frequency is one of the four primary DORA metrics.
Why Is It Important?
Smaller, more frequent deployments are generally less risky than large, infrequent ones. Frequent deployments also make for more agile development teams: You can get feedback on new features more quickly allowing for rapid iteration and improvement. Fast new features and bug fixes can lead to higher customer satisfaction.
How To Measure
You can measure deployment frequency manually, by keeping a record of each successful deployment to production, or with automated tools that track deployment frequency. If you choose the manual method, divide the number of successful deployments by the chosen period (e.g., deployments per day, per week, per month) for a more specific deployment frequency rate.
Improvement Tips
- Automate your build, test, and deployment processes to enable faster and more frequent deployments.
- Identify and remove bottlenecks in your deployment pipeline to speed up the process.
- Break down large features into smaller, more manageable deployments to reduce risk and increase frequency.
2. Lead Time for Changes
Lead time for changes measures the time it takes for a code change to go from the initial commit to successfully running in production. It essentially tracks how long it takes for team members to deliver a change to your users. This metric is one of the four primary DORA metrics.
Why Is It Important?
With shorter lead times, you can get feedback on changes more quickly, allowing for faster iteration and learning. In turn, this allows your team to respond to market demands and customer needs rapidly.
How to Measure
Many CI/CD and DevOps platforms provide automated tracking of lead time for changes. If you must track this metric manually, first identify your start point: This is usually the initial commit of the code change in your version control system. Then identify the endpoint: This is the point when the change is successfully deployed to production and available to users. Measure the time elapsed between the start and endpoints.
Improvement Tips
- Streamline your build, test, and deployment processes to reduce friction and automate manual steps.
- Foster better communication and collaboration between development and operations teams.
- Break large features into smaller, more manageable changes that can be delivered more quickly.
3. Mean Time to Recovery (MTTR)
Mean time to recovery (MTTR) measures the average time it takes to recover from a production failure or incident. This includes the time to detect the issue, diagnose the cause, and implement a solution to restore service. This metric is one of the four primary DORA metrics.
Why Is It Important?
A lower MTTR means less downtime for your users and less disruption to your business. By tracking and improving MTTR, you can identify weaknesses in your systems and processes and make them more resilient.
How To Measure
Incident management and monitoring tools can help automate the tracking and calculation of MTTR. Otherwise, you can record the time taken to resolve each incident, from detection to resolution, and then divide the total time spent resolving incidents by the number of incidents.
Improvement Tips
- Invest in robust monitoring and alerting systems to detect incidents quickly.
- Establish clear incident management processes and communication channels.
- Automate tasks like diagnosis, rollback, and recovery to speed up resolution times.
4. Change Failure Rate
This metric measures the percentage of deployments that cause a failure in production requiring remediation, such as a rollback, hotfix, or patch. This metric is one of the four primary DORA metrics.
Why Is It Important?
A lower change failure rate indicates high-quality code and more reliable deployments. Tracking and reducing change failure rate can help your team reduce disruptions in production to improve system stability.
How To Measure
Divide the number of failed deployments by the total number of deployments within a given period. Many engineering teams aim for a change failure rate below 15%.
Improvement Tips
- Use automated testing, expand test coverage, and more to catch issues before they impact user experience.
- Running post-mortems and regular feedback loops to analyze failed deployments can help you identify root causes and prevent recurring issues.
5. Cycle Time
Cycle time measures the time it takes to complete a task or user story, from start to finish. It’s often an indicator of development efficiency and process bottlenecks.
Why Is It Important?
When you reach a consistent cycle time, it’s easier to plan and allocate resources effectively. Looking at cycle time can also help you optimize development speed, as shorter cycle times improve efficiency and enable faster delivery of value. On the other hand, long cycle times may indicate process inefficiencies that need attention.
How To Measure
Track the time it takes for a task or user story to move from “to do” to “done” in your workflow. Calculate the average cycle time over a set period. Typically, you should aim for shorter cycle times. However, the ideal duration will depend on the complexity of your tasks.
Improvement Tips
- Break down large tasks into smaller, more manageable chunks.
- Look for blockers, inefficient workflows, or technical debt that might be slowing your team down.
- Streamline handoffs and open lines of communication to help projects move seamlessly and ensure nothing falls through the cracks.
6. Lead Time
This is the total time it takes for work to move from request to delivery. You might track this metric to understand the responsiveness of the development process.
Why Is It Important?
A shorter lead time means you can deliver features and fixes to users faster, enhancing customer satisfaction and value. Longer lead times can also indicate that you might have bottlenecks or inefficiencies in planning, development, or deployment.
How To Measure
Track the time from the initial request (e.g., in a ticketing system) to its completion and delivery. Like cycle time, strive for shorter lead times knowing that the ideal duration will vary based on the nature of the work.
Improvement Tips
- Optimize your workflow and eliminate waste.
- Improve communication and collaboration across DevOps teams.
- Automate tasks where possible.
7. Throughput
Throughput is a measurement of the number of work items (e.g., tasks, bug fixes, features) completed within a specific timeframe. Tracking this metric can help you understand team productivity and delivery velocity.
Why Is It Important?
Generally, higher throughput indicates greater productivity and efficiency. Low throughput might indicate inefficiencies, bottlenecks, or that you have too much work in progress.
How To Measure
Count the number of completed work items over a given period (e.g., sprint, week, month). You can compare trends over time to assess improvements.
Improvement Tips
- Optimize your workflow and reduce blockers and dependencies that slow progress.
- Balance workload distribution to prevent bottlenecks.
- Break down large work items into smaller, more manageable tasks.
8. Work In Progress (WIP)
This metric is straightforward: It tells you the number of work items currently being worked on (but are not yet completed).
Why Is It Important?
Having too much WIP can cause inefficiencies, longer cycle times, and a heavy cognitive load for developers. By limiting WIP, you can help teams focus efforts, reduce context switching, and improve flow.
How To Measure
Track the number of work items in an “in progress” state at any given time.
Improvement Tips
- Visualize your workflow to identify bottlenecks and areas with excessive WIP.
- Set WIP limits for different stages of your workflow.
- Use Kanban or other agile methodologies to manage work in progress.
9. Code Review Cycle Time
Code Review Cycle time measures the time it takes to complete a code review. This metric helps assess the efficiency of the review process.
Why Is It Important?
Faster code reviews help accelerate development and reduce lead times while maintaining quality. Long review times can delay releases and slow the development pipeline.
How To Measure
Track the time from when a code review is requested to when it is completed.
Improvement Tips
- Set clear expectations for code review turnaround times and establish clear review guidelines to make feedback more efficient.
- Use automated tools to assist with code reviews.
- Encourage smaller, more frequent code changes.
10. Review Depth
Review depth is a measure of how thoroughly code reviews are conducted. Often, review depth is based on the number of comments per pull request, the percentage of lines reviewed, or the time spent on reviews.
Why Is It Important?
Review depth is all about balance. Thorough code reviews help identify defects early, improve code quality, and share knowledge. On the other hand, excessive code scrutiny can slow development.
How To Measure
You can look at a few different metrics, such as the number of comments per line of code, the time spent on reviews, or the percentage of lines reviewed. Strive for a balance between thoroughness and efficiency in code reviews.
Improvement Tips
- Establish clear code review guidelines and checklists to encourage constructive feedback and avoid nitpicking.
- Use code review tools that provide insights and automate checks.
11. Pull Request Size
This metric looks at the number of lines of code or changes included in a pull request.
Why Is It Important?
Typically smaller pull requests are easier to review, test, and merge, leading to faster development cycles and reduced risk.
How To Measure
Track the number of lines of code changed or the number of files modified in each pull request. You should aim for smaller pull requests, ideally under 200 lines of code.
Improvement Tips
- Break down large features into smaller, more focused pull requests.
- Encourage developers to commit code changes
- Use tools that provide insights into pull request size and complexity.
12. Merge Frequency
Merge frequency measures how often code changes are merged into the main branch. This metric reflects your team’s deployment velocity.
Why Is It Important?
Frequent merges help keep branches up-to-date, reduce integration conflicts, and enable continuous delivery. In other words, frequent merges can indicate a healthy CI/CD pipeline.
How To Measure
Track the number of merges to the main branch over a specific period (e.g., per day, per sprint). Aim for multiple merges per day, but this will depend on your team’s workflow and release cadence.
Improvement Tips
- Encourage developers to merge smaller code changes more frequently.
- Use feature branching strategies to isolate code changes.
- Automate your merge process to reduce manual effort and errors.
13. Code Review Participation
Code review participation tells you the percentage of developers actively participating in code reviews.
Why Is It Important?
High participation promotes knowledge sharing, improves code quality, and fosters a collaborative culture. Low participation can indicate process inefficiencies or over-reliance on a few individuals.
How To Measure
Track the number of developers who provide code reviews compared to the total number of developers on the team.
Improvement Tips
- Make code reviews a mandatory part of your development process.
- Encourage a culture of peer review and feedback.
- Provide training and support for developers on effective code review
14. Defect Escape Rate
Defect escape rate measures the percentage of defects that “escape” testing and make it into production.
Why Is It Important?
A lower defect escape rate indicates higher-quality software and fewer production issues. A high defect escape rate suggests gaps in testing and quality assurance and can lead to costly fixes.
How To Measure
Divide the number of defects found in production by the total number of defects found. Aim for a low defect escape rate, ideally below 10%.
Improvement Tips
- Improve your testing practices, including automated testing and test coverage.
- Implement quality gates in your development pipeline.
- Conduct thorough root cause analysis for escaped defects.
15. Mean Time Between Failures (MTBF)
Track the MTBF for the average time between failures in your system or application. This metric can help you determine system reliability.
Why Is It Important?
A higher MTBF indicates greater reliability and stability.
How To Measure
Calculate the average time between failures over a specific period. Or, you can track the total uptime of a system divided by the number of failures over a given period.
Improvement Tips
- Improve your monitoring and alerting systems to detect issues early.
- Implement proactive measures to prevent failures (e.g., redundancy, failover mechanisms).
- Conduct thorough root cause analysis of failures to prevent recurrence.
16. Application Availability/Uptime
This is the percentage of time your application or service is available and operational for users.
Why Is It Important?
High availability is essential for user satisfaction, business continuity, and maintaining a positive brand reputation.
How To Measure
To get an uptime percentage, first identify the total time your application was operational during a specific period. Then, subtract the total downtime during that period, divide the resulting uptime by the total time, and multiply by 100. Mission-critical systems and applications often target an uptime of 99.9%.
Improvement Tips
- Implement redundancy and failover mechanisms in your infrastructure.
- Detect potential issues early with proactive monitoring and alerting.
- Follow thorough testing and quality assurance to prevent outages.
17. Application Performance
This includes metrics that indicate the health and performance of your application, such as latency, response times, and resource utilization.
Why Is It Important?
Good application performance is crucial for user satisfaction and business success.
How To Measure
Use application performance monitoring (APM) tools to track metrics such as response time, latency, throughput, and error rates.
Improvement Tips
- Optimize your application code and database queries.
- Scale your infrastructure to meet demand.
- Monitor application performance regularly and address any bottlenecks.
18. Time to First Review
As its name indicates, this metric tells you the time it takes to get the first review on a pull request.
Why Is It Important?
Faster reviews help accelerate development and reduce lead times.
How To Measure
Track the time from when a pull request is submitted to when the first review is received.
Improvement Tips
- Set clear expectations for review turnaround times.
- Use automation to notify reviewers and track progress.
- Prioritize pull requests based on urgency and impact.
19. Team Velocity
This metric is a measure of how much work a team can complete in a sprint or iteration.
Why Is It Important?
Tracking velocity can help you with planning, forecasting, and understanding team capacity. A fluctuating velocity may indicate blockers or inconsistent workflows.
How To Measure
Track the number of units of work completed in each sprint.
Improvement Tips
- Use consistent estimation techniques and team sizes.
- Break down large work items into smaller, more predictable tasks.
- Track and address any impediments that hinder team progress.
20. Deployment Size
Deployment size is the amount of change introduced in a single deployment, often measured in lines of code modified, number of features added, or files changed.
Why Is It Important?
Smaller deployments are generally less risky and easier to roll back, contributing to increased deployment frequency and faster feedback loops.
How To Measure
Track the number of code changes, features, or files included in each deployment.
Improvement Tips
- Break down large features into smaller, incremental changes.
- Encourage frequent commits and merges to keep changesets small.
- Use feature flags to enable/disable features independently.
21. Deployment Time
This is the time it takes to deploy a new version of your application to production, from initiation to successful rollout.
Why Is It Important?
Faster deployment times enable quicker delivery of value, faster feedback, and more agile responses to change.
How To Measure
Track the time elapsed from the start of the deployment process to when the new version is fully operational in production.
Improvement Tips
- Automate your deployment pipeline as much as possible.
- Optimize your infrastructure and deployment scripts for speed.
- Use techniques like blue/green deployments or canary releases for faster and safer rollouts.
22. Mean Time to Detection (MTTD)
MTTD is the average time it takes to detect an incident or problem in your system, from the time it occurs to when it is identified.
Why Is It Important?
Faster detection allows for quicker response and mitigation, reducing the impact of incidents on users and the business.
How To Measure
Track the time elapsed between the occurrence of an incident and its detection, often using monitoring and alerting tools.
Improvement Tips
- Leverage comprehensive monitoring and alerting
- Use anomaly detection and machine learning to identify unusual patterns.
- Encourage proactive communication and reporting of potential issues.
Make DevOps Measurable with Jellyfish
Make DevOps Measurable with Jellyfish
Once you know which metrics to track, it’s time to collect data. Data for DevOps metrics can be collected from various sources, including version control systems (e.g., Git), issue tracking systems (e.g., Jira), CI/CD tools (e.g., Jenkins, GitLab CI), monitoring tools (e.g., Datadog, Prometheus), and incident management systems.
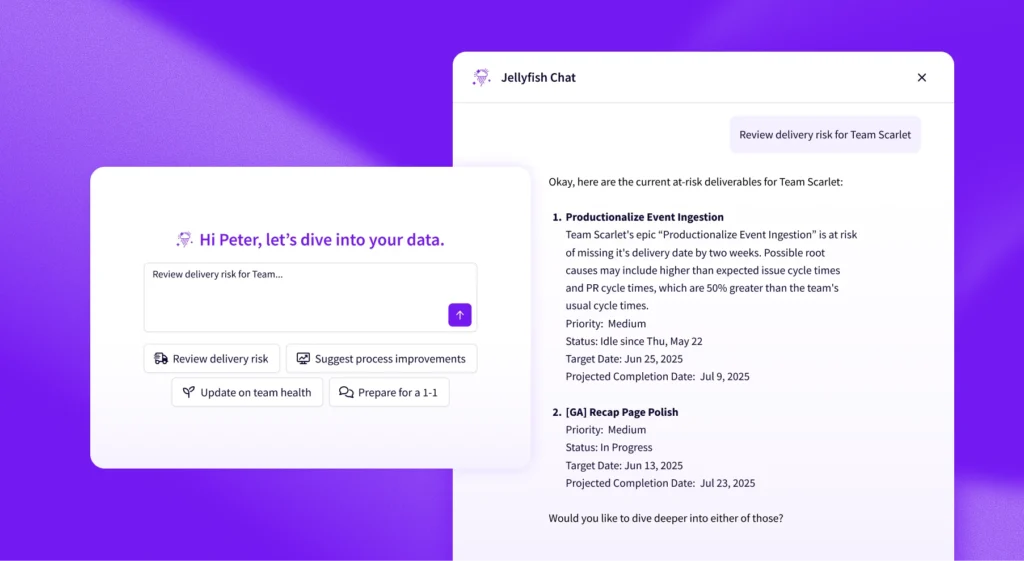
Alternatively, you can use an engineering management platform like Jellyfish to track everything in one place.
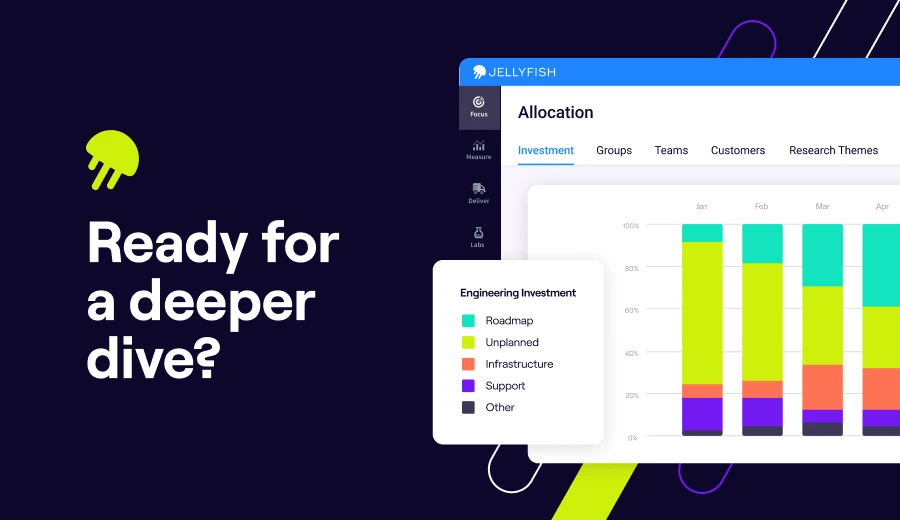
Jellyfish examines data from a variety of DevOps tools, including continuous integration, incident management, and issue tracking, to monitor key DevOps metrics. Track DORA metrics out of the box, or customize the Jellyfish platform with your own DevOps metrics to hone your DevOps performance and build an elite-performing team.
Ready to give Jellyfish a try? Book a demo here.
About the author