In this article
Engineering leaders are under constant pressure to accelerate delivery without compromising system stability, but you cannot optimize a pipeline you cannot see. While broad engineering metrics and KPIs provide a high-level view of team output, DevOps metrics and KPIs act as the diagnostic framework for your actual software delivery engine. They move the conversation away from anecdotal status updates and toward objective data, revealing exactly how code moves from a developer’s machine to the end user.
The value of these metrics lies in their ability to pinpoint specific friction points within your development process—whether that is a bottleneck in code review, a lack of test automation, or a brittle production environment. By mastering these signals, leaders can transition from reactive troubleshooting to proactive optimization.
This article breaks down the essential metrics you need to identify delivery hurdles, justify resource allocation, and ensure your organization consistently ships quality software at scale.
What are DevOps metrics?
What are DevOps metrics?
At their core, DevOps metrics are the quantifiable data points captured from your entire software development lifecycle (SDLC)—including issue trackers, version control systems, and CI/CD pipelines. They act as the operational ground truth for your engineering organization, providing an immutable baseline to measure the health of your technical infrastructure and team workflows.
Measuring these data points allows leaders to:
- Monitor the flow of work: Track the movement of code from the initial commit through to final production deployment.
- Evaluate infrastructure stability: Understand how your systems perform under different deployment loads and frequencies.
- Validate process changes: Use objective data to determine if a specific change in your development process actually improved delivery speed or quality.
- Identify systemic friction: Spot technical or procedural hurdles before they manifest as significant delivery delays or production outages.
By formalizing these data points into a consistent measurement strategy, you can verify that your delivery process remains predictable even as you scale your engineering teams.
DevOps metrics vs. DevOps KPIs
Though often used interchangeably, the distinction between a metric and a KPI determines whether your reporting structure provides clarity or creates dashboard fatigue. Distinguishing between tactical data and strategic outcomes is essential for maintaining alignment across your engineering organization.
- DevOps metrics are granular, diagnostic data points used to troubleshoot specific technical bottlenecks within a workflow. They are the tools engineering managers use to “look under the hood” and optimize team-level performance.
- Examples include: test execution time, pull request size, or the number of weekly commits.
- DevOps KPIs are the high-level indicators that directly correlate with your overarching business objectives. If a data point does not help you prove time-to-market, developer productivity, or system reliability to a non-technical stakeholder, it is a metric, not a KPI.
- Strategic focus: KPIs are the figures you present to the executive board to demonstrate the ROI of your engineering efforts and justify future resource allocation.
By categorizing your data this way, you ensure that engineering teams have the diagnostic depth they need to improve, while leadership stays focused on the outcomes that drive business growth.
The 4 Core DORA Metrics: The Gold Standard for DevOps KPIs
The 4 Core DORA Metrics: The Gold Standard for DevOps KPIs
When building a performance dashboard, you should ground your reporting in the industry standard. The DevOps Research and Assessment (DORA) metrics are the gold standard because they perfectly balance delivery velocity with system stability.
Here is how engineering leaders should interpret and act on these four core metrics.
Deployment Frequency
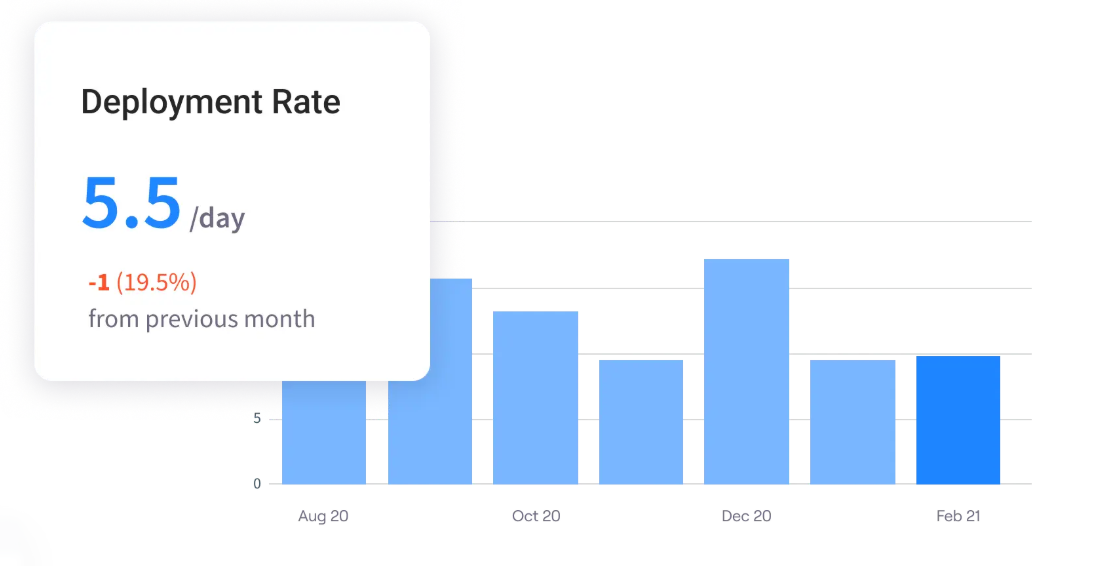
Deployment frequency (also known as deployment rate) is your ultimate proxy for batch size. High deployment frequency means your team is shipping small, incremental changes rather than massive, risky updates. It indicates strong automated testing and high developer confidence.
- The benchmark: On-demand (multiple deployments per day).
- Common bottlenecks: Heavy manual QA gates, tightly coupled monolithic architectures, or a cultural fear of breaking production caused by poor rollback
Lead Time for Changes
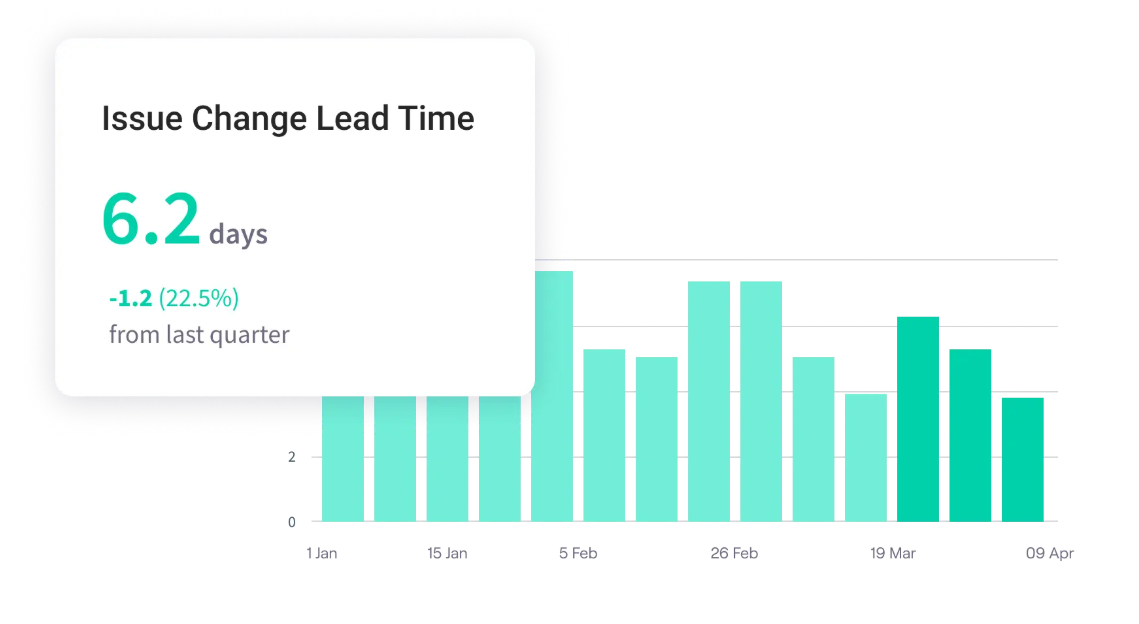
Lead time for changes measures the friction in your delivery pipeline. It tells you exactly how long engineering capital (code) sits idle before it actually delivers value to the customer.
- The benchmark: Less than one hour from code commit to running in production.
- Common bottlenecks: Code review gridlock (pull requests sitting unassigned), manual approval boards (CABs), or localized environments that force developers to wait for dedicated testing servers.
Change Failure Rate (CFR)
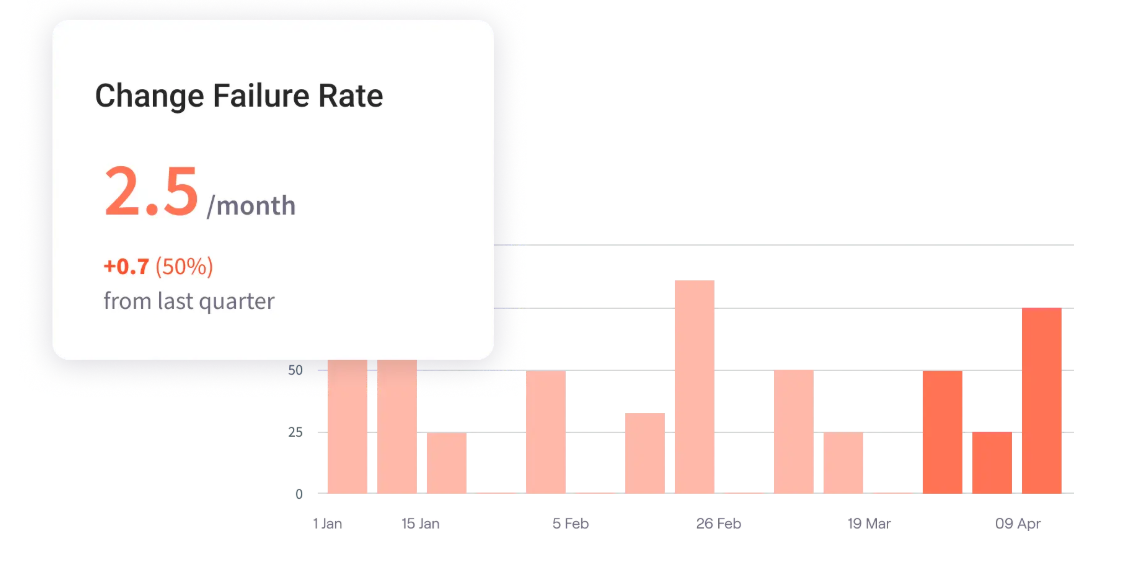
Change failure rate measures the effectiveness of your quality gates. While the first two metrics measure speed, CFR tells you if your speed is reckless. It tracks the percentage of releases that result in degraded service or require immediate remediation.
- The benchmark: Between 0% and 15%.
- Common bottlenecks: Flaky automated test suites, environments that do not mirror production deployment (e.g., code works in staging but breaks in prod), or a lack of shift-left testing practices.
Mean Time to Recovery (MTTR)
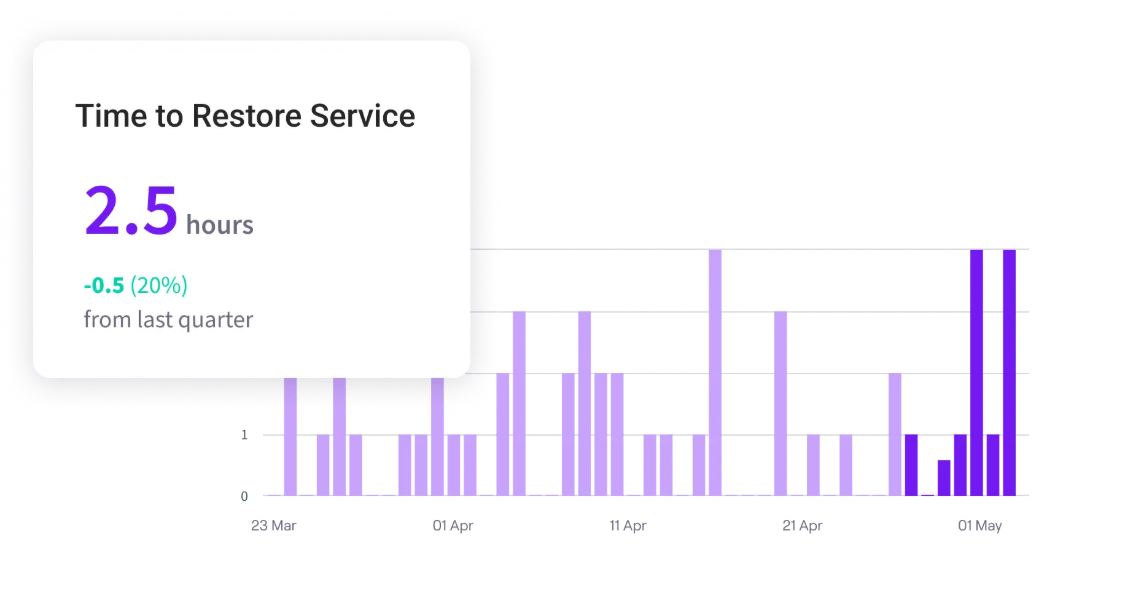
Mean time to recovery (also known as mean time to resolution or time to restore service) reflects your operational resilience. In modern software, failures are inevitable; MTTR measures how effectively your team navigates that chaos. It shows whether your team can detect, diagnose, and restore applications or systems to normal functionality without causing massive customer disruption.
- The benchmark: Less than one hour.
- Common bottlenecks: Failing observability (unreadable logs, missing alerts), a lack of automated rollback scripts, or “hero culture” where only one specific senior engineer knows how to fix a critical system.
PRO TIP: Jellyfish automates DORA metric tracking by integrating directly with your existing delivery toolchain. By aggregating signals from your CI/CD, incident management, and issue tracking systems, the platform provides a centralized view of lead time, deployment frequency, and recovery rates. This visibility allows engineering leaders to move beyond manual data collection and manage their delivery pipeline with objective, real-time data.
Additional DevOps Metrics to Track
Additional DevOps Metrics to Track
While DORA metrics tell you if your delivery pipeline is healthy, secondary metrics tell you why it might be failing. When your primary KPIs slip, engineering leaders use these diagnostic metrics to drill down into the daily workflows and pinpoint the exact source of friction.
Diagnose Speed and Delivery Bottlenecks
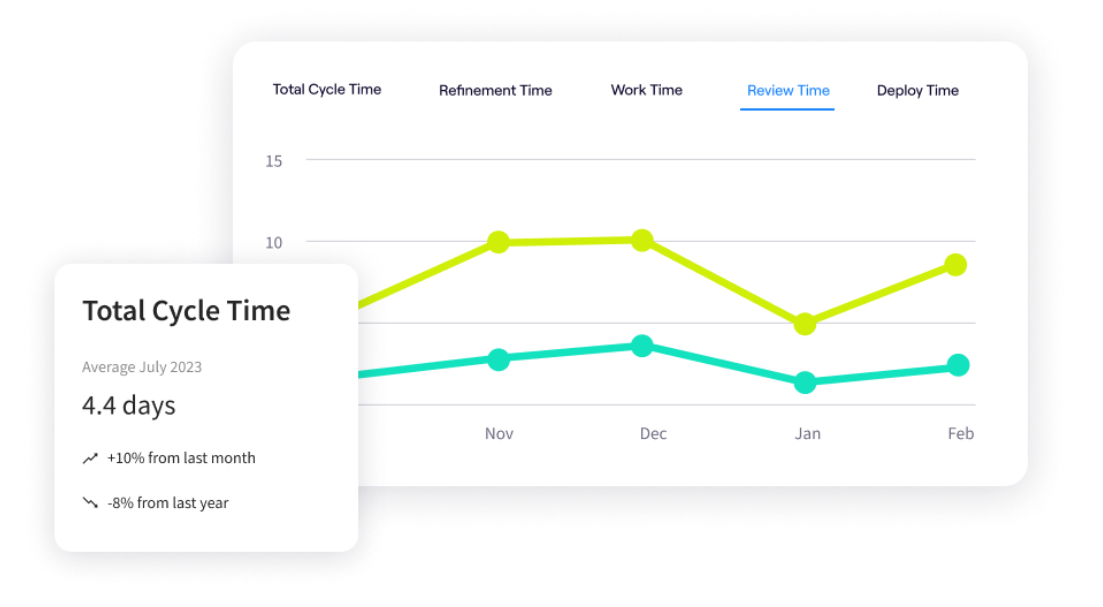
- Cycle time: This tracks the total time it takes for a task to move from “in progress” to “done.” If lead time is high, cycle time helps you see if the delay is in active development or if the code is sitting idle in a QA queue.
- Throughput: The total number of work items (features, bug fixes, tickets) your team completes within a specific timeframe. Tracking this helps you understand team capacity and prevents you from overloading developers.
- Work in progress (WIP): A count of how many tasks are currently active. High WIP limits are a massive red flag for context switching, which destroys developer productivity and severely inflates cycle times.
Diagnose Code Quality and Workflow Friction
- Pull request (PR) size: The number of code changes in a single PR. Massive pull requests are notoriously difficult to review, leading to delayed approvals and a higher likelihood of introducing bugs.
- Code review cycle time: Tracks how long a pull request takes to be reviewed and merged. If your deployment frequency is low, code review gridlock is often the primary culprit.
- Defect escape rate: The percentage of software bugs that slip past your testing phases and make it into the final release. A rising escape rate means you need to tighten your automated testing before prioritizing new features.
Recommended read → Better Code, or Just Bigger? AI-Assisted Pull Requests Are 18% Larger
Diagnose System Stability
- Deployment success rate: The percentage of deployments that execute without pipeline errors or infrastructure failures. If this is low, your CI/CD pipeline itself requires maintenance.
- Incident volume: The total number of alerts generated over a given period. A spike in volume often points to mounting technical debt or flaky infrastructure that needs immediate attention.
- Uptime and reliability: The percentage of time your systems are fully operational for the end-user. This is the ultimate baseline for customer trust.
How to Choose the Right DevOps KPIs
How to Choose the Right DevOps KPIs
The fastest way to fail at measuring DevOps performance is to track everything. When you monitor 25 different data points with equal weight, you create dashboard fatigue. The signal gets lost in the noise, and your team stops paying attention.
To choose the right KPIs, engineering leaders must shift their focus from tracking activity to measuring outcomes. Here is a strategic framework for selecting the KPIs that actually matter to your organization.
Target Your Primary Constraint
Apply the Theory of Constraints to your delivery pipeline. Do not track metrics just for the sake of tracking them; track the metric that measures your current biggest bottleneck.
If your DevOps team can deploy in minutes but the code is riddled with bugs, stop focusing on Lead Time and obsess entirely over your Change Failure Rate and Defect Escape Rate until the bleeding stops.
Conversely, if your code is flawless but it takes three weeks of manual QA to release it, make lead time your singular focus. Let your current operational pain points dictate your KPIs.
Translate Engineering Output into Business Outcomes
Your CEO and CFO do not care about pull request sizes, commit frequencies, or the nuances of your CI/CD pipeline. They care about customer retention, time-to-market, and revenue generation. If you want executive buy-in (and budget), you must choose KPIs that directly map to these goals.
For example, do not present MTTR as just a technical metric; frame it as “minimizing customer downtime and protecting revenue.” Frame lead time as “accelerating our time-to-market against competitors.”
When you align DevOps metrics with business value, engineering transforms from a cost center into a strategic driver.
Establish a Baseline Before Setting a Benchmark
A common mistake engineering leaders make is looking at the DORA “elite” benchmarks and immediately demanding the DevOps team hit those targets. If you do not know where you currently stand, arbitrary goals will only demoralize your engineers.
Before you declare a target benchmark, measure your current performance for 30 to 60 days to establish a baseline. If your current lead time is two weeks, setting a goal of “under one hour” is unrealistic.
Instead, use your baseline to set an incremental, achievable goal—like reducing lead time by 20% next quarter. This approach fosters genuine continuous improvement rather than developer burnout.
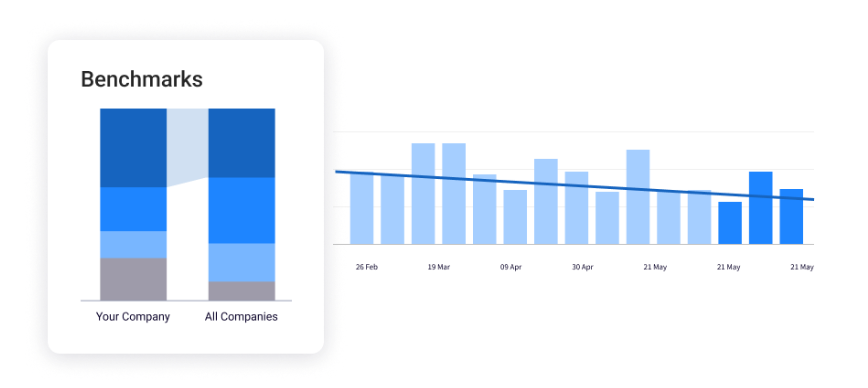
PRO TIP: Evaluate your engineering performance against industry standards to identify where your organization truly stands. Jellyfish Benchmarks provide the competitive context needed to validate your delivery speed and stability relative to your peers. Use these insights to guide strategic investments in the processes and workflows that move your teams toward elite performance.
Use the 3+1 Rule for Executive Reporting
When it is time to present to the board or the C-suite, keep it incredibly focused. The 3+1 rule limits your executive dashboard to a maximum of three primary delivery KPIs and one team health metric.
For example, you might report on deployment frequency, lead time, and MTTR to demonstrate delivery speed and stability, plus developer experience (or eNPS) to prove that your speed isn’t burning out the team.
Keep the rest of your secondary metrics—like PR size, mean time between failures, or code review cycle time—tucked away in your diagnostic toolkit. Use them internally to manage your engineering teams, but keep them off the executive slide deck.
Building Your Executive DevOps KPI Scorecard
Building Your Executive DevOps KPI Scorecard
A KPI scorecard is a translation layer between your engineering teams and the executive board. A strong scorecard pairs high-level delivery metrics with tangible business outcomes, while keeping the diagnostic metrics ready in the background for your engineering managers.
Here is a practical template for structuring your DevOps scorecard to balance speed and stability:
| Category | Business outcome | Primary KPI | Diagnostic metric |
| Speed | Faster time-to-market | Deployment frequency | Pull request size |
| Velocity | Reduced development friction | Lead time for changes | Code review cycle time |
| Quality | Higher customer satisfaction | Change failure rate | Defect escape rate |
| Stability | Maximum revenue protection | Mean time to recovery (MTTR) | Incident volume |
To operationalize this scorecard effectively, follow a simple cadence:
- Review primary KPIs weekly: Monitor these four core metrics in your engineering leadership meetings to gauge the overall health of your delivery pipeline.
- Investigate diagnostic metrics privately: If deployment frequency drops, do not immediately escalate the issue. Have your engineering managers look at pull request size and code review cycle time to find the exact bottleneck before reporting upward.
- Report business outcomes monthly: When presenting to the CEO or the board, focus entirely on the business outcome and primary KPI columns to prove the strategic ROI of your engineering department.
Make DevOps Measurable with Jellyfish
Make DevOps Measurable with Jellyfish
Engineering leaders need a reliable way to standardize measurement across their entire organization without stripping away the specific nuances of individual teams. The Jellyfish Data Hub provides a flexible intelligence layer, allowing you to define, track, and customize your delivery metrics to match your exact operational goals.
By moving away from rigid reporting structures, you can focus on the capabilities that actually drive team health and delivery speed.
- Standardize metrics with team-level flexibility: Every engineering team operates slightly differently. Jellyfish provides transparent logic that allows you to establish organization-wide standards for DORA metrics while retaining the ability to tailor calculations for specific workflows. You get the high-level visibility you need without forcing a one-size-fits-all process onto your developers.
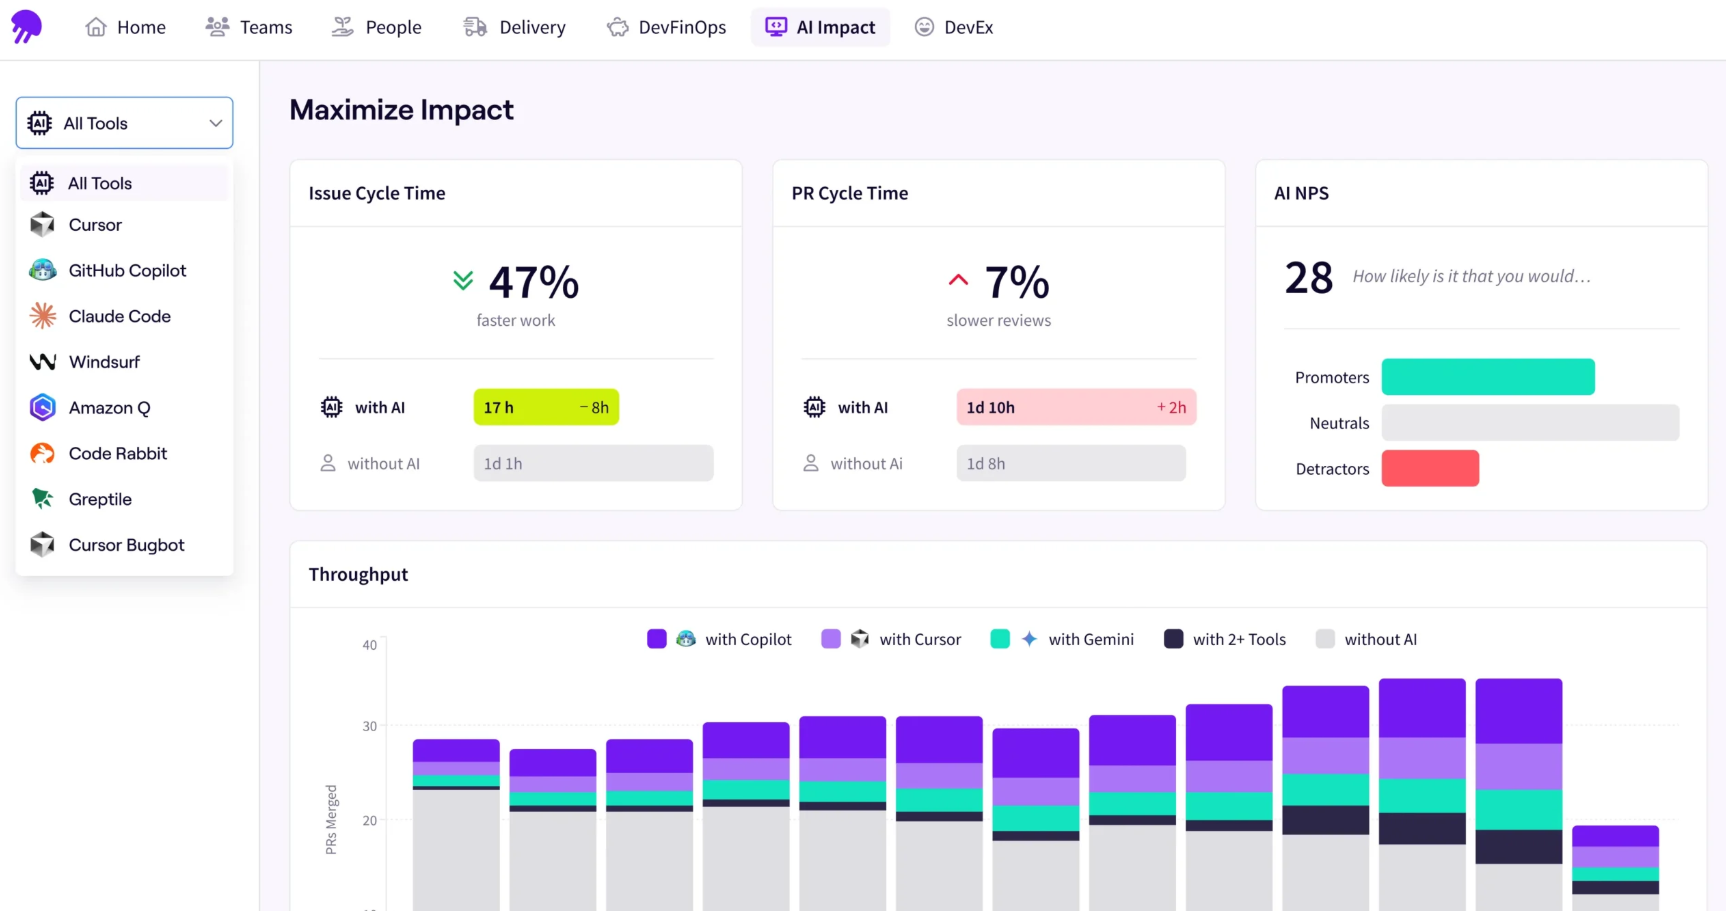
- Combine signals across the entire SDLC: Getting a true picture of team velocity requires looking beyond just code commits. Jellyfish connects issue-tracking data, pull request lifecycles, and AI usage trends into a single view. By bringing disparate data sources together—and offering AI-assisted natural language queries—you can uncover hidden bottlenecks and answer complex questions about throughput in seconds, not sprints.
- Translate engineering data into business outcomes: Raw technical metrics often fail to resonate with the executive board. With extensible dashboards, you can curate bespoke views that translate engineering signals into the language of your stakeholders. Whether you need to prove the ROI of a new CI/CD pipeline or demonstrate how infrastructure stability protects revenue, you can build the exact visualizations required to drive those conversations.
“Jellyfish brings everything into one place. Having Jira tickets, PR data, and AI usage presented in a single pane of glass provides real-time team insights that were previously hard to track. It’s an essential tool for any engineering org looking for seamless work tracking and clear delivery metrics.” — Pooja Erappa, Software Engineer II at Diligent Corporation
Build a culture of continuous improvement based on objective, customizable data.
Ready to give Jellyfish a try? Book a demo here.
FAQs
FAQs
How do you track DevOps metrics without burdening developers?
The most effective way to track performance metrics is through complete automation. Asking team members to manually log time leads to inaccurate data and resentment.
Instead, integrate your issue trackers (like Jira) and version control systems (like GitHub or GitLab) directly into an engineering management dashboard. This allows you to pull delivery data automatically without interrupting the development process.
What should we do if our change failure rate is consistently high?
A high change failure rate indicates that buggy code is reaching your production environments, leading to failed deployments and outages. To fix this, you must shift left on quality. This means heavily increasing your test automation during the continuous integration phase so that bugs are caught by machines long before a release candidate is finalized.
Should we use DevOps metrics to evaluate individual developer performance?
No. DevOps metrics are designed to measure team performance, workflow efficiency, and pipeline bottlenecks.
Using metrics like deployment frequency or amount of time spent on pull requests to evaluate individual developers usually backfires. It encourages gamification (developers pushing small, meaningless commits just to inflate their numbers) and ultimately degrades software quality and team morale.
How long does it take to see improvements after establishing DevOps KPIs?
Once you start tracking your development pipeline, you should spend the first 30 days simply establishing a baseline without trying to change behavior. After you identify your primary bottleneck and adjust your DevOps practices—such as enforcing smaller code batches to reduce deployment time—most engineering teams can see a measurable improvement in their target KPIs within a single quarter.
How do existing agile practices support long-term DevOps success?
True DevOps success is built on the foundation of iterative development. While agile helps your team prioritize work and manage their backlog, your DevOps processes ensure that work actually reaches the customer through continuous delivery.
By aligning these two methodologies, you create a feedback loop where developers can ship frequently and learn from production data. This synergy is what allows elite engineering organizations to scale their delivery without sacrificing the stability of their environments.
About the author

Lauren is Senior Product Marketing Director at Jellyfish where she works closely with the product team to bring software engineering intelligence solutions to market. Prior to Jellyfish, Lauren served as Director of Product Marketing at Pluralsight.