In this article
Claude Code has been part of engineering workflows long enough now that the honeymoon phase is over.
Teams are spending meaningful money on it, developers say it makes them faster, but nobody seems confident in how to measure what they’re getting back.
This is showing up in online communities too, with engineers who spend $1k or more a month on the Claude API asking how other people are thinking about ROI. The replies are all over the place, which tells you there’s no consensus yet.
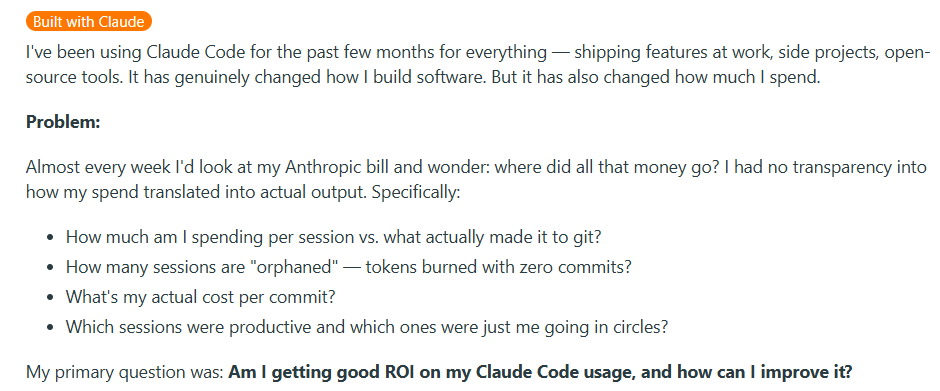
Some engineers have started trying to figure this out on their own. They’re tracking things like which Claude Code sessions lead to commits and which ones just burn through tokens without producing anything.
The pattern is pretty clear. Teams are bought in on Claude Code, but don’t have a structured way to measure what it’s doing for the organization.
This guide walks through how to measure Claude Code adoption in a structured way, connect it to the outcomes your company cares about, and build an ROI case you can defend in a budget review.
Claude Code Overview and Pricing
Claude Code Overview and Pricing
Claude Code is Anthropic’s AI coding assistant that runs in the terminal and helps developers write, refactor, debug, and ship code faster.
We won’t spend too long on the product itself here since the rest of this guide is focused on measuring its impact, but it helps to start with a clear picture of how teams access Claude Code and what the cost structure looks like.
Individual plans are for solo developers or small teams where each person manages their own subscription.
- Pro ($17/mo) includes Claude Code, Claude Cowork, Research, and access to all models. Good for developers who use the tool regularly, but not all day.
- Max (from $100/mo) includes everything in Pro but with 5x or 20x the usage limits. It’s primarily built for developers who spend most of their time in Claude Code and need higher output limits across all tasks.
Team and Enterprise plans are for organizations that need central billing, admin controls, and SSO:
- Team standard seat ($20/mo) gives you all Claude.ai features, including Claude Code, with more usage than Pro.
- Team premium seat ($100/mo) provides 5x the usage of a standard seat. Teams can mix and match seat types depending on each developer’s usage level.
- Enterprise starts at $20/seat but usage scales at API rates, meaning costs are directly tied to model usage. Enterprise brings role-based access, audit logs, SCIM, HIPAA-ready options, and a compliance API.
API access is for teams that skip the seat-based plans entirely and interact with Claude models directly through the API. Costs scale purely with token volume:
- Opus 4.7 runs $5 per million input tokens and $25 per million output tokens. It’s the most capable model and best for complex coding tasks.
- Sonnet 4.6 runs $3 per million input tokens and $15 per million output tokens. This model balances intelligence, cost, and speed.
- Haiku 4.5 runs $1 per million input tokens and $5 per million output tokens. It’s the fastest and cheapest model, particularly good for lightweight tasks.
On the API side, there are built-in ways to lower these numbers. Batch processing reduces token rates by 50%, and prompt caching can cut input costs considerably if your team’s usage patterns involve reusing the same context across sessions.
Why this matters for ROI → The cost baseline for Claude Code varies a lot depending on how your org is set up. A team of 50 engineers on standard seats pays a flat $1,000 per month. That same team on an enterprise plan with heavy Opus usage could be spending several multiples of that, and the number moves month to month depending on how much work runs through the models.
Why Measuring Claude Code AI Adoption Matters
Why Measuring Claude Code AI Adoption Matters
AI coding tools are spreading fast across engineering teams, but the data on what they’re delivering is mixed and sometimes contradictory.
The research on productivity impact is all over the place, developer perceptions don’t always match measured outcomes, and most teams still don’t have a framework for tracking any of it.
Here’s why that’s a problem:
- Adoption is near-universal, but impact is not: According to the Stack Overflow 2025 Developer Survey, 84% of developers are using or planning to use AI coding tools, and 51% of professional developers use them daily. But the same survey found that positive sentiment toward these tools dropped from over 70% in 2023 to just 60% in 2025, which means that widespread use doesn’t automatically mean widespread satisfaction. If you’re not measuring how your team specifically is using Claude Code, you’re relying on industry averages that might have nothing to do with how your team works.
- More code output from AI agents is coming with more defects, and most teams aren’t tracking the trade-off: A CodeRabbit analysis of 470 GitHub repositories found that AI-generated pull requests contain 1.7x more issues on average than human-written ones, with higher rates of critical and logic errors. If you’re measuring Claude Code’s value purely by output volume, you could be overlooking a quality bottleneck building up underneath.
- The productivity gains that do exist are concentrated in specific task types: A McKinsey study of 4,500 developers across 150 enterprises found that AI coding tools reduce time on routine coding tasks by 46%. But that number applies to boilerplate code, test writing, and documentation. For high-complexity tasks, time savings dropped to less than 10%, and junior developers sometimes took 7-10% longer with the tools than without them.
- Anthropic’s enterprise customer base is scaling fast, and so is the average spend: Anthropic has over 300,000 business customers as of late 2025, with customers spending $100K or more, growing 7x year over year. At that level of investment, the question of ROI moves from “nice to have” to “board-level priority.” If your engineering org is one of those accounts, having a clear measurement framework is no longer optional.
- Lack of ROI clarity is one of the top challenges enterprises report with AI, across every industry: NVIDIA’s 2026 State of AI survey of over 3,200 respondents found that 30% of organizations cited lack of clarity on AI’s ROI as a top challenge, right behind data issues and talent shortages. That number is especially relevant for engineering teams because developer productivity is inherently harder to quantify than cost savings in other departments.
PRO TIP 💡: Jellyfish tracks AI tool usage and delivery impact across hundreds of engineering teams and publishes the findings in a regularly updated AI Engineering Trends report. If you want to benchmark your Claude Code numbers against the broader industry, it’s a solid starting point.
Understanding Native Claude Code Analytics
Understanding Native Claude Code Analytics
Claude Code ships with built-in analytics that give engineering leaders a starting point for tracking how their team uses the tool. Before you bring on any external measurement, it’s worth understanding what’s already available and how far it can take you.
The analytics dashboard is the most accessible option. If your team is on a Claude for Teams or Enterprise plan, you already have access to a built-in analytics dashboard. The only setup involved is connecting your GitHub organization, and from there, the dashboard tracks two categories of data.
Usage metrics cover the basics of adoption:
- Daily active users and sessions show how many developers are working with Claude Code and how often, so you can track whether adoption is growing, flattening, or concentrated in specific teams.
- Suggestion accept rate tells you how frequently developers keep the code edits Claude Code proposes, which is a useful signal for whether the tool is producing output that developers find valuable.
- Lines of code accepted tracks the total volume of Claude Code-generated lines that developers chose to keep. This doesn’t include suggestions that developers rejected.
Contribution metrics connect usage to code output:
- PRs with Claude Code tracks how many of your merged pull requests include code that Claude Code helped write.
- Lines of code with Claude Code show the total volume of Claude Code-assisted lines across all merged PRs. The system filters out empty lines, bracket-only lines, and other non-meaningful content, so the count only shows real code contributions.
- PRs with Claude Code (%) gives you the percentage of your team’s total merged PRs that involved Claude Code, which is one of the clearest adoption-depth signals available natively.
- Leaderboard ranks your top 10 contributors by Claude Code usage, so you can pinpoint power users who can support internal enablement.
These contribution metrics are intentionally conservative. The system only attributes code to Claude Code when there’s a high-confidence match, so the true impact is probably larger than what shows up on the dashboard.
There’s also the API console dashboard, which serves a different purpose. It’s built for teams that access Claude Code through the API rather than through seat-based plans, and it leans more toward cost and usage tracking. It shows:
- Lines of code accepted and the suggestion acceptance rate for usage tracking
- Activity as daily active users and sessions over time
- Spend as daily API costs shown alongside the user count
This view is more useful for tracking costs than measuring contribution, but it gives you a clear picture of how spend is distributed across your team.
For teams that want more granular data, OpenTelemetry monitoring opens up a deeper layer. Claude Code can export metrics, logs, and traces through OpenTelemetry into whatever observability tools your team already runs. The metrics you can pull through this path include:
- Session count for tracking how many CLI sessions developers start across the organization
- Lines of code for measuring code additions and removals tied to Claude Code
- Pull request and commit counts for connecting Claude Code activity to version control output
- Cost and token usage for monitoring spend per session, token volume, and which models your team is using
- Active time for tracking how much time developers spend working in Claude Code, with idle time excluded
The benefit is granularity. You can break down all of these by team, department, or cost center, set up alerts for cost spikes or unusual token consumption, and compare usage patterns across different groups. For organizations that want full control over their Claude Code data, this is the path that provides it.
The tradeoff is overhead. Someone needs to configure the telemetry pipeline, build dashboards, maintain the infrastructure, and interpret the results. If you don’t have a mature observability setup, that can be a major lift.
What you still can’t see → Native analytics give you a solid read on how your team uses Claude Code and what it costs. But they stop at the boundary of the tool itself. Connecting Claude Code usage to engineering outcomes like cycle time, deployment frequency, or incident rates means pulling in data from your CI/CD pipeline, project management tools, and other systems that Claude Code doesn’t have visibility into on its own.
PRO TIP 💡: Jellyfish’s AI Impact platform pulls in Claude Code adoption data and maps it against delivery metrics like cycle time, throughput, and code quality automatically. If you want the insights without the OpenTelemetry setup overhead, it’s worth looking at.
Limitations of Claude Analytics and Reporting
Limitations of Claude Analytics and Reporting
What Claude Code gives you out of the box is a good starting point, but engineering leaders who try to build a full ROI case from this data alone will find gaps that are hard to work around.
These aren’t flaws in the tooling so much as boundaries of what any single tool’s analytics can reasonably cover. Here are the most common ones engineering leaders run into:
- Spend visibility doesn’t scale well across mixed plans: If your org has some developers on seat-based plans and others on the API, you’re looking at two different dashboards with two different data models. There’s no unified view that rolls up total Claude Code investment across both access paths, which makes it harder to calculate org-wide ROI or compare cost efficiency across teams.
- Before-and-after comparisons aren’t built in: If you want to show how Claude Code has changed your team’s performance over time, you need a baseline from before adoption. The native dashboards only show data from after Claude Code is in use and don’t integrate with historical engineering metrics, so building that comparison view means stitching together data from multiple sources on your own.
- Usage alone doesn’t tell you who’s getting value: Two developers can have identical session counts and lines of code accepted, but one might be shipping meaningful features while the other is going back and forth on the same file. The native analytics treat both as equally productive, and there’s no way to distinguish high-impact usage from low-impact usage without cross-referencing other systems.
- Cost per unit of work is hard to calculate: You can see total spend, and you can see total output, but there’s nothing built in to connect the two into a metric like cost per PR, cost per feature, or cost per story point. That kind of calculation needs data from your project management and delivery tools, and doing it manually across a large team is tedious and hard to maintain.
- What happens after the merge is a black box: The dashboards track how much code Claude Code contributes to your PRs, but they don’t track what happens to that code after it merges. Whether Claude Code-assisted PRs have higher or lower defect rates, get rolled back more often, or generate more incidents downstream are questions the native analytics can’t answer.
Key Metrics to Track for Claude Code ROI
Key Metrics to Track for Claude Code ROI
A strong Claude Code ROI case covers four things. Whether people are using it, whether it makes them faster, whether the output quality holds up, and whether the financial math works. Each one needs its own set of metrics.
Adoption is where most teams start, and the native Claude Code dashboards give you a decent baseline. But there’s a difference between knowing that people have access and understanding how deeply the tool has become part of their workflow.
- The percentage of the team actively using Claude Code gives you a proportional view of adoption. Raw user counts can look impressive on their own, but mean very little without the denominator.
- Session frequency per developer separates power users from occasional ones. The ROI profile of a developer who uses Claude Code five days a week looks nothing like someone who opens it twice a month.
- Suggestion accept rate is a signal for how well the tool fits your team’s workflows. If developers are consistently rejecting what Claude Code produces, that usually points to a prompt quality issue or a mismatch in how the tool is being applied.
- Adoption broken down by team and seniority helps you see where the tool has taken hold and where it hasn’t. That breakdown tells you where to invest in enablement.
Once you know people are using the tool, the next thing leadership wants to know is whether it’s making the team faster. This is where velocity metrics come in:
- Cycle time for Claude Code-assisted PRs vs. non-assisted PRs gives you a direct comparison of how fast AI-assisted work moves through the pipeline. A consistent gap in favor of assisted PRs is one of the strongest proof points you can put in front of leadership.
- PR throughput per developer over time tracks whether individual output is trending upward as Claude Code adoption grows. This one needs a quality counterweight though, since more PRs only count as progress if they’re holding up in production.
- Time to first PR for new hires shows whether Claude Code is helping new software engineers get productive faster. If developers who onboard with Claude Code reach their 10th merged PR sooner than those who don’t, that’s a direct reduction in ramp-up cost.
- Lead time for changes measures the full path from commit to production and is already a familiar DORA metric in most engineering orgs. That familiarity makes it easier to include in conversations with leadership since you don’t have to explain what it means.
None of the velocity metrics above mean much if the code shipping faster is creating more work on the back end. That’s why quality metrics are the third category, and arguably the one that matters most for credibility:
- Change failure rate split by Claude Code involvement lets you see whether AI-assisted changes are more or less likely to cause production issues. This is one of the first metrics a skeptical VP of Engineering will ask about.
- Defect rate by PR type gives you a direct read on whether Claude Code-assisted PRs introduce more bugs than your baseline. If they do, that’s a signal to tighten review practices or adjust how the team uses the tool.
- Rollback frequency is one of the simplest quality signals to track. If Claude Code-assisted changes get reverted more often than human-only ones, that’s cost and rework you need to factor into the ROI calculation.
- Code review time for Claude Code-assisted PRs is worth watching because it can cut both ways. If reviews take longer because AI-generated code needs extra scrutiny, that eats into the time savings. If reviews are faster because the code arrives in better shape, that strengthens the case.
Finally, you need to bring everything together in terms that finance teams and executives care about, which means cost and ROI metrics:
- Cost per developer per month is your baseline investment number. Depending on your plan type, this might be a fixed seat cost or a variable API cost.
- Estimated time savings in dollar terms translates hours saved into financial value using your average fully loaded developer cost. If Claude Code saves each developer 4 hours per week at $80/hour, that’s $320 per week in recovered capacity per person.
- Net ROI brings the whole framework together. Subtract total Claude Code costs from the combined value of time savings, faster delivery, and reduced onboarding time, and you have the number that determines whether the investment survives the next planning cycle.
You don’t need all sixteen metrics on day one. Start with adoption and cost since those are the easiest to pull from Claude Code’s native analytics, then bring velocity and quality as you connect other data sources. The important thing is to start measuring now and expand the framework over time.
PRO TIP 💡: If building this framework manually sounds like a lot of work, Jellyfish’s AI Impact platform handles most of it automatically. It connects Claude Code data to your Git and planning tool data and presents the adoption, velocity, quality, and cost metrics covered above in a single dashboard.
Measure Claude Code Usage, Adoption & ROI with Jellyfish
Measure Claude Code Usage, Adoption & ROI with Jellyfish
The metrics and framework covered in this guide are all trackable, but doing it manually is a lot of ongoing work. You’d need to pull data from Claude Code’s native dashboards, your CI/CD pipeline, project management tools, and incident tracking systems, and stitch it all together on a regular basis.
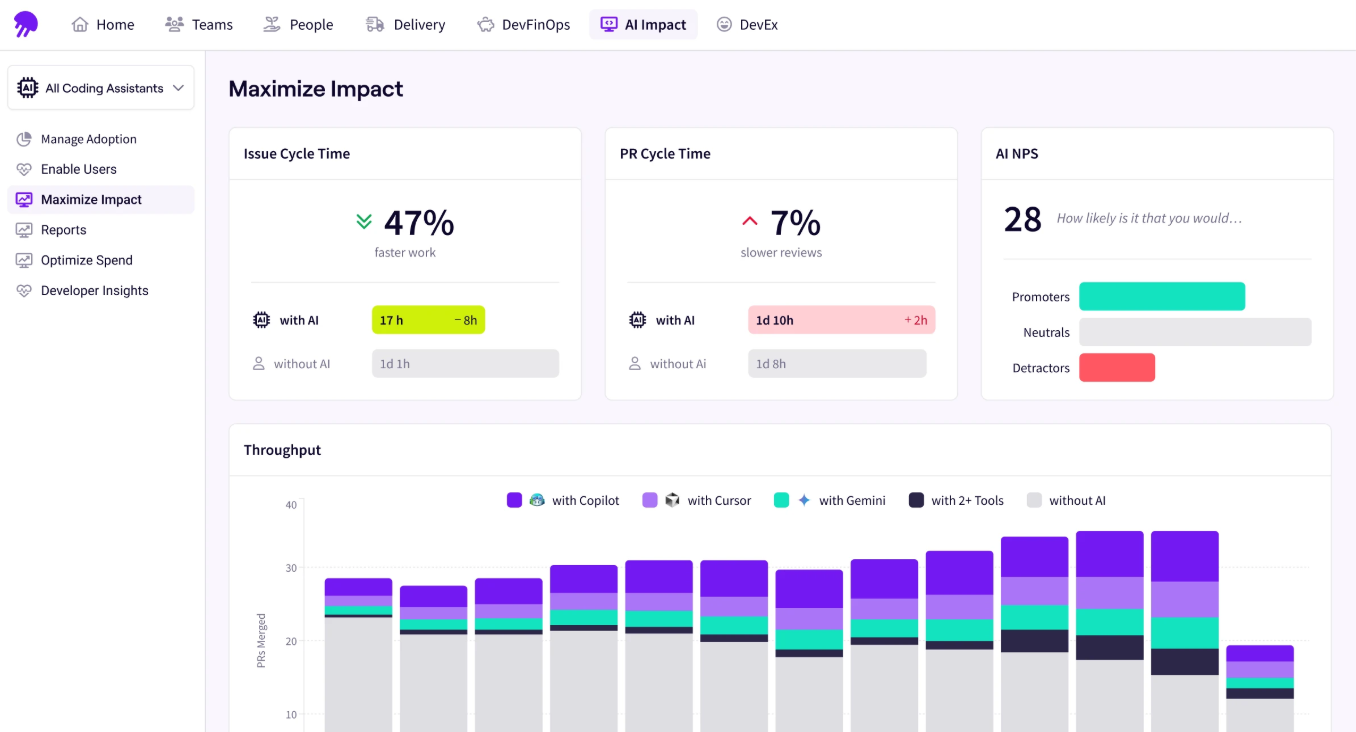
Jellyfish closes that gap with its AI Impact platform, which measures how AI coding tools affect delivery across your engineering org. It’s vendor-agnostic, meaning it tracks adoption, spend, and delivery outcomes for Claude Code alongside tools like GitHub Copilot, Cursor, Windsurf, Amazon Q, and others in a single view.
There’s also a dedicated Claude Code dashboard that goes a level deeper. You can see how adoption is spreading across teams, compare delivery metrics for Claude Code-assisted PRs against non-assisted ones, and track how autonomous workflows are performing relative to human-assisted work.
Here’s where it fills the gaps covered earlier in this guide:
- Spend visibility connected to outcomes lets you see how much each team spends on Claude Code and what that investment produced. You can go from “we spent $X last quarter” to “we spent $Y per feature shipped” without building the calculation yourself.
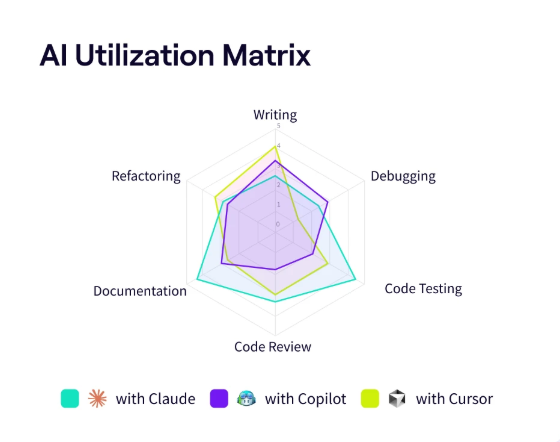
- Multi-tool benchmarking lets you compare Claude Code against GitHub Copilot, Cursor, and other tools in your stack using the same measurement framework. Instead of evaluating each tool through its own dashboard with its own metrics, you get a consistent, vendor-neutral comparison of adoption and delivery impact.
- Enablement guidance shows you where adoption is strong and where teams haven’t gained traction yet. You’ll know where to focus training and where to look for best practices worth spreading across the org.
- Before-and-after delivery analysis connects Claude Code usage to SDLC metrics like cycle time, throughput, and code quality over time. You can see whether teams that adopted Claude Code are delivering faster and whether that improvement holds up as adoption matures.
- Agentic workflow tracking gives you visibility into how Claude Code’s autonomous capabilities are contributing to output as your team moves from assisted to more agentic workflows. You can see how agent-driven work compares to human-assisted work on the same delivery metrics.
![]()
- Executive-ready reporting packages your Claude Code adoption, delivery, and cost data into reports you can hand directly to leadership or finance. The platform does the formatting work, so you’re not spending time building decks from raw data every review cycle.
Jellyfish gives you a way to track Claude Code adoption, tie it to delivery outcomes, and present the results in terms that leadership can work with. If that’s the gap your team is trying to close, book a demo and see the platform in action.
FAQs
FAQs
How does Claude Code integrate with my environment?
Claude Code runs directly in the terminal and integrates with VS Code and JetBrains IDEs through dedicated extensions and plugins. You can install the VS Code extension from the marketplace or add the JetBrains plugin through your IDE’s plugin settings.
Both connect to Claude Code’s CLI and provide features like inline diff viewing, file context sharing, and diagnostic sharing.
You can also run Claude Code from any editor’s built-in terminal without an extension. It reads and writes files on disk, and your editor picks up the changes automatically.
What models power Claude Code?
Claude Code runs on three models from Anthropic’s Claude family. You can switch between them during a session or let Claude Code route tasks automatically based on complexity.
- Opus 4.7 is the most capable model, built for complex reasoning, multi-file coding tasks, large codebase analysis, and agentic workflows.
- Sonnet 4.6 balances intelligence, speed, and cost. It handles most everyday software development work and performs close to Opus on standard coding tasks at a lower price point.
- Haiku 4.5 is the fastest and cheapest option, suited for lightweight tasks like file reads, quick edits, and routine questions.
All three support context windows up to 1 million tokens.
Can I track custom metrics and KPIs with Claude Code?
Yes. Through OpenTelemetry, Claude Code exports metrics like session count, lines of code, commit count, token usage, and cost per session into your observability stack.
You can add custom attributes to tag metrics by team, department, or cost center, which lets you build whatever views and alerts your org needs. The data works with any backend that supports OTLP, including Prometheus, Datadog, and Honeycomb.
How does Claude Code compare to ChatGPT and GitHub Copilot?
All three tools help developers ship code faster, but each one fits different use cases.
- ChatGPT works best as a general assistant you paste code into for quick explanations or one-off fixes.
- Microsoft’s GitHub Copilot exists inside your IDE and focuses on inline autocomplete.
- Claude Code runs in the terminal and handles full agentic workflows, which cover multi-file refactors and real-world end-to-end tasks that span the whole repo.
Most teams pair more than one tool based on the job at hand, so the right way to decide is to track productivity metrics and developer experience signals for each tool against your own baseline.
Can I use Claude Code with open source projects and prompt templates?
Yes. Claude Code works the same on open source repos as it does on private ones.
You can set up custom prompt templates through Claude Code’s configuration files, so your team follows a consistent approach to writing code and can optimize token spend across the org.
Claude Code also supports automation hooks, which lets you tie it into CI/CD pipelines or run it headlessly for batch jobs. Engineering leaders often combine templates with real-time usage alerts to catch spend issues before the monthly bill shows up.
Does AI code generation impact review times?
It varies. AI-powered code can speed up reviews when it arrives clean and well-structured, but it can also slow them down if reviewers need to catch subtle logic errors. The only way to know is to track review time for Claude Code-assisted PRs separately and compare it to your baseline.
About the author

Lauren is Senior Product Marketing Director at Jellyfish where she works closely with the product team to bring software engineering intelligence solutions to market. Prior to Jellyfish, Lauren served as Director of Product Marketing at Pluralsight.