In this article
You can list the four DORA metrics quite easily. You’ve got deployment frequency, change lead time, change failure rate, and time to restore service.
But measuring them accurately is rarely that simple.
For starters, delivery data lives across code repositories, CI/CD systems, ticketing tools, incident platforms, deployment logs, and team workflows. That means the numbers can quickly become inconsistent if the tool cannot normalize how different teams ship software.
For engineering leaders, that creates three problems:
- If the data is incomplete, teams do not trust it.
- If the metrics are disconnected from context, they do not explain what needs to change.
- And if the reporting takes too much manual work, it stops being useful.
The tools in this guide help solve those problems.
We’ll look at eight top-rated platforms for measuring DORA metrics, how they collect and interpret engineering data, and which types of teams each tool is best suited for.
But first…
What are DORA Metrics Tools?
What are DORA Metrics Tools?
DORA metrics tools are platforms that connect to the systems engineering teams already use to build, review, deploy, and support software.
They pull data from tools like GitHub, GitLab, Bitbucket, Jira, Linear, Jenkins, CircleCI, PagerDuty, and incident management systems, then turn that data into a clearer view of software delivery performance.
The four metrics they calculate:
DORA metrics tools measure two dimensions of engineering performance:
Velocity: how fast code moves from commit to production:
- Deployment frequency: How often your team successfully deploys to production. Elite teams deploy multiple times per day. Low performers deploy once per month or less.
- Lead time for changes: The time between a code commit and that code running in production. Measures the efficiency of your entire delivery pipeline.
Stability: how reliably that code runs once it’s there:
- Change failure rate: The percentage of deployments that cause a production incident, outage, or require a hotfix. Tracks the quality signal your deployment pipeline produces.
- Mean Time to Restore (MTTR): How long it takes to recover from a production failure. Measures your team’s ability to detect, respond to, and resolve incidents before they compound.
Example: How a DORA metrics tool works
Let’s assume a team opens a Jira ticket, creates a pull request in GitHub, merges the change, runs a deployment through CircleCI, and later links an incident in PagerDuty to that release.
A DORA metrics tool can connect those events into one delivery timeline.
It can show when the work started, when the code was merged, when it reached production, whether the deployment caused an incident, and how long it took the team to restore service.

This gives engineering leaders context into where work slows down, where risk enters the release process, and which parts of the system need attention.
How are DORA Metrics Tools Used?
How are DORA Metrics Tools Used?
DORA metrics tools are used to make software delivery performance visible while work is still happening.
They work more as an active operational system that informs decisions at every level of the engineering organization.
For individual development teams
Development teams use DORA metrics tools to understand where work is slowing down before it becomes a missed release, delayed roadmap item, or production issue.
For example, a team may use live dashboards or Slack alerts to see when pull requests are sitting too long in review, when deployment frequency drops, or when batch sizes are getting too large.
Those signals help the team adjust quickly to the situation. A possible solution might be to break work into smaller changes, rebalance review load, tighten handoffs, or address release risk before it reaches production.
This makes DORA metrics useful at the workflow level. The aim here is to give the team enough visibility to improve how work moves from code to production.
For engineering managers
Engineering managers use DORA metrics tools to establish baselines, understand team trends, and identify structural problems in the delivery process.
A manager can look at lead time for changes to see where work gets stuck, compare deployment patterns across teams, or identify whether incidents are tied to rushed releases, unclear ownership, or recurring bottlenecks.
They can also use the data to spot signs of overload, such as long review queues, uneven work distribution, or a team constantly carrying too much work in progress.
This helps managers move from anecdotal status updates to a clearer view of the engineering value stream.
For engineering leaders
Engineering leaders use DORA metrics tools to connect software delivery performance to business outcomes.
At this level, the value is understanding how engineering throughput, reliability, tooling, and capacity affect roadmap delivery, customer experience, and investment decisions.
For example, leaders can use DORA data to justify headcount, evaluate whether CI/CD or developer productivity investments are working, identify teams that need platform support, and explain engineering performance in terms the business can understand.
When used well, DORA metrics tools help every layer of the engineering organization make better decisions. Teams improve daily workflows. Managers remove delivery friction. Leaders understand how engineering performance supports the business.
Recommended reading → GitHub Copilot ROI: How to Measure Team Adoption and Productivity
Native CI/CD Tracking vs. Dedicated Engineering Intelligence Platforms
Native CI/CD Tracking vs. Dedicated Engineering Intelligence Platforms
Most engineering teams do not start with a dedicated DORA metrics platform. They start with the tools they already use.
GitHub, GitLab, and CI/CD systems can show useful delivery signals, especially for smaller teams.
If most of your work happens inside one repository ecosystem, native dashboards can help you understand pull request activity, deployment frequency, workflow runs, build failures, and release patterns without adding another platform.
That is a good starting point. But it is not always enough once engineering gets more complex.
Where native CI/CD tracking works well
Native CI/CD tracking works best when the software delivery process is relatively contained.
For example, a small team running GitHub Actions across a few repositories can use GitHub’s built-in data to see how often workflows run, where builds fail, and how changes move through the pipeline.
GitLab can do something similar when issues, merge requests, pipelines, and deployments all live inside the same GitLab environment.
For smaller teams, open-source projects, or organizations with a simple toolchain, that level of visibility may be enough. The data is close to the work, easy to access, and useful for understanding basic delivery activity.
Where native metrics start to break down
The visibility gap opens up the moment your delivery process spans more than one platform — which is the case for most engineering teams at any meaningful scale.
Code may live in GitHub or GitLab. Project planning in Jira. Incidents are tracked in PagerDuty or ServiceNow. Automated testing runs across multiple CI tools. And deployments happen through separate release systems.
When delivery data is spread across that many systems, native dashboards only show part of the story. They can tell you what happened inside a repository or pipeline, but they cannot show how that work connects to tickets, incidents, roadmap commitments, team allocation, or customer-facing reliability.
That is where DORA reporting can become incomplete. You may know a deployment happened, but not whether it was tied to a business priority. You may see a failed workflow, but not whether it delayed a release.
You may see pull request activity, but not whether the work was stuck because of unclear requirements, review bottlenecks, or overloaded teams.
What dedicated engineering intelligence platforms add
Dedicated engineering intelligence platforms are built to connect those disconnected signals.
Instead of looking only at repository or CI/CD activity, they pull data from source control, project management, CI/CD, incident management, issue tracking, and other engineering systems. Then they organize that data into a clearer view of the engineering value stream.
This is important because DORA metrics are more useful when they come with context.
Engineering leaders need to know what kind of work is moving, where it slows down, which teams are blocked, how incidents affect delivery, and whether engineering investment is producing better outcomes.
| 🪼Jellyfish notes: Native CI/CD dashboards are a practical starting point.
But for larger teams with multiple systems, services, and stakeholders, dedicated engineering intelligence platforms provide the deeper context needed to measure DORA metrics accurately and improve delivery performance at scale. |
How to Choose the Right DORA Metrics Tool for Your Needs
How to Choose the Right DORA Metrics Tool for Your Needs
The right DORA metrics tool is one that fits how your engineering organization works.
For example, a small team shipping from one repository may only need basic CI/CD visibility.
Meanwhile, a larger organization with multiple teams, services, planning tools, deployment systems, and incident workflows needs something more connected.
So before comparing vendors, you need to know where your delivery data lives, who needs to use the insights, and what decisions the tool should help you make.
Make sure it fits your engineering stack
A DORA metrics tool is only useful if it can ingest the data that matters. At minimum, look for native integrations with your source control system, issue tracker, CI/CD pipelines, deployment tools, and incident management platform.
For most teams, that involves tools like GitHub, GitLab, Bitbucket, Jira, Linear, Jenkins, CircleCI, Buildkite, Argo CD, PagerDuty, Opsgenie, or ServiceNow.
The key here is to avoid a setup that requires too much custom engineering just to get basic reporting working. If your team has to spend months stitching together APIs, cleaning data, or manually mapping workflows, the tool will be hard to trust and harder to maintain.
Look for actionable intelligence
A dashboard that shows deployment frequency, lead time, change failure rate, and MTTR is a good starting point. But you also need to understand what is driving those outcomes.
Choose a platform that connects metrics to the underlying work. It should identify delivery bottlenecks, link incidents to the relevant pull requests, tickets, services, and teams, and provide visibility into where processes are slowing down.
Balance delivery speed with developer experience
DORA metrics can help improve delivery performance, but they can also create the wrong incentives if they are used carelessly.
If teams feel like every metric is being used to rank, pressure, or punish them, the data will lose trust quickly. The right tool should help leaders understand both delivery outcomes and the conditions behind them. That includes signs of overloaded teams, long review queues, too much work in progress, high interruption load, or quality tradeoffs that may not show up in DORA metrics alone.
Match the tool to your organization’s maturity
Not every organization needs the same level of engineering intelligence.
- Early-stage teams may need simple visibility into PR flow, build health, and deployment activity.
- Scaling teams may need better DORA tracking across multiple squads and services.
- Larger engineering organizations may need a platform that connects delivery metrics to investment allocation, roadmap execution, capacity planning, and business outcomes.
This is where dedicated engineering intelligence platforms become more valuable. It helps leaders understand how engineering work flows across teams, how capacity is being used, where delivery bottlenecks are forming, and how software delivery connects to business priorities.
Consider time-to-value and maintenance overhead
Choose a platform that can start producing useful insights quickly through native integrations and ready-made workflows.
Some tools can show reliable data within days. Others need heavy setup, custom data mapping, or engineering support before the numbers can be trusted.
You should also look at how much work the platform will require over time.
Check how integrations are maintained when your tools change, how easy it is to add new teams or repositories, and whether your team will need analysts to keep dashboards clean and fix data issues.
| 🪼Jellyfish notes: Run a two-week proof of concept against a single team before rolling out platform-wide.
Use a team whose delivery performance you already understand well enough to use as a benchmark. If the tool’s numbers don’t roughly match what you’d expect from that team, the integration setup needs work before the data means anything. |
8 Best DORA Metrics Tools on the Market Right Now
8 Best DORA Metrics Tools on the Market Right Now
1. Jellyfish2. Swarmia3. LinearB4. Code Climate Velocity5. Waydev6. Haystack7. Pluralsight Flow8. GetDX (now DX)
1. Jellyfish

Jellyfish is a software engineering intelligence platform that helps engineering leaders understand how work moves across the software delivery lifecycle.
It tracks areas like planning, code review, deployment, incidents, investment allocation, and business outcomes. While it does measure DORA metrics, Jellyfish goes a bit deeper with its ‘Work Allocation’ model.
The platform pulls data from tools engineering teams already use, including GitHub, GitLab, Jira, PagerDuty, and other systems. It then maps that work into business-level categories such as product development, technical debt, reliability work, and other investment areas defined by the company.

This gives engineering leaders a clearer view of where team effort is going. They can see whether engineering time matches the priorities the business agreed to fund, instead of relying on manual updates or rough estimates.
For example, if change failure rate increases, Jellyfish can help leaders see whether the issue is tied to a specific team, initiative, service, or shift in engineering focus.

Key features
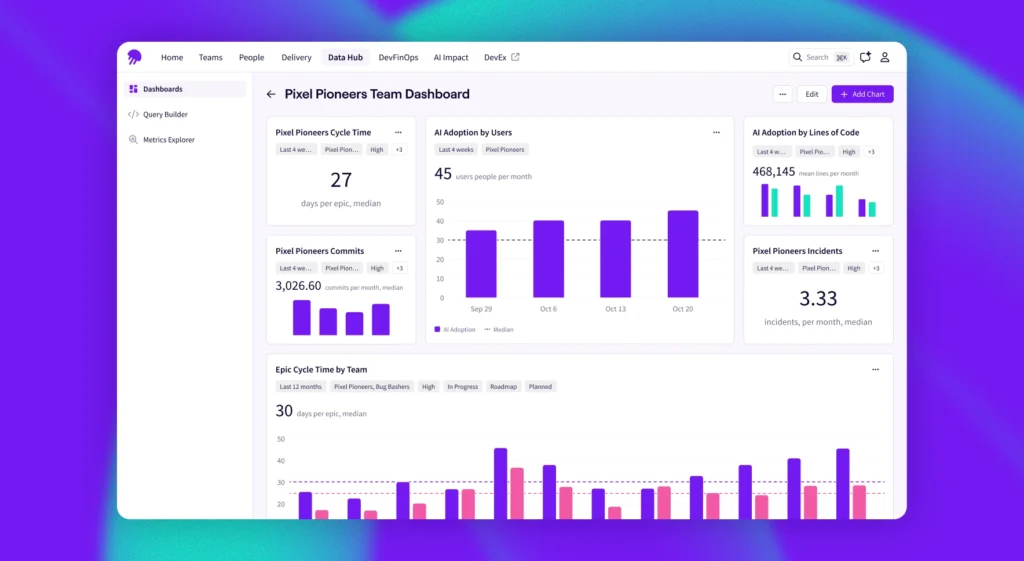
- DevOps metrics: Jellyfish collects the four core DORA metrics from CI/CD pipelines, version control, and incident management tools. Metrics can also be viewed by team, service, or organization.

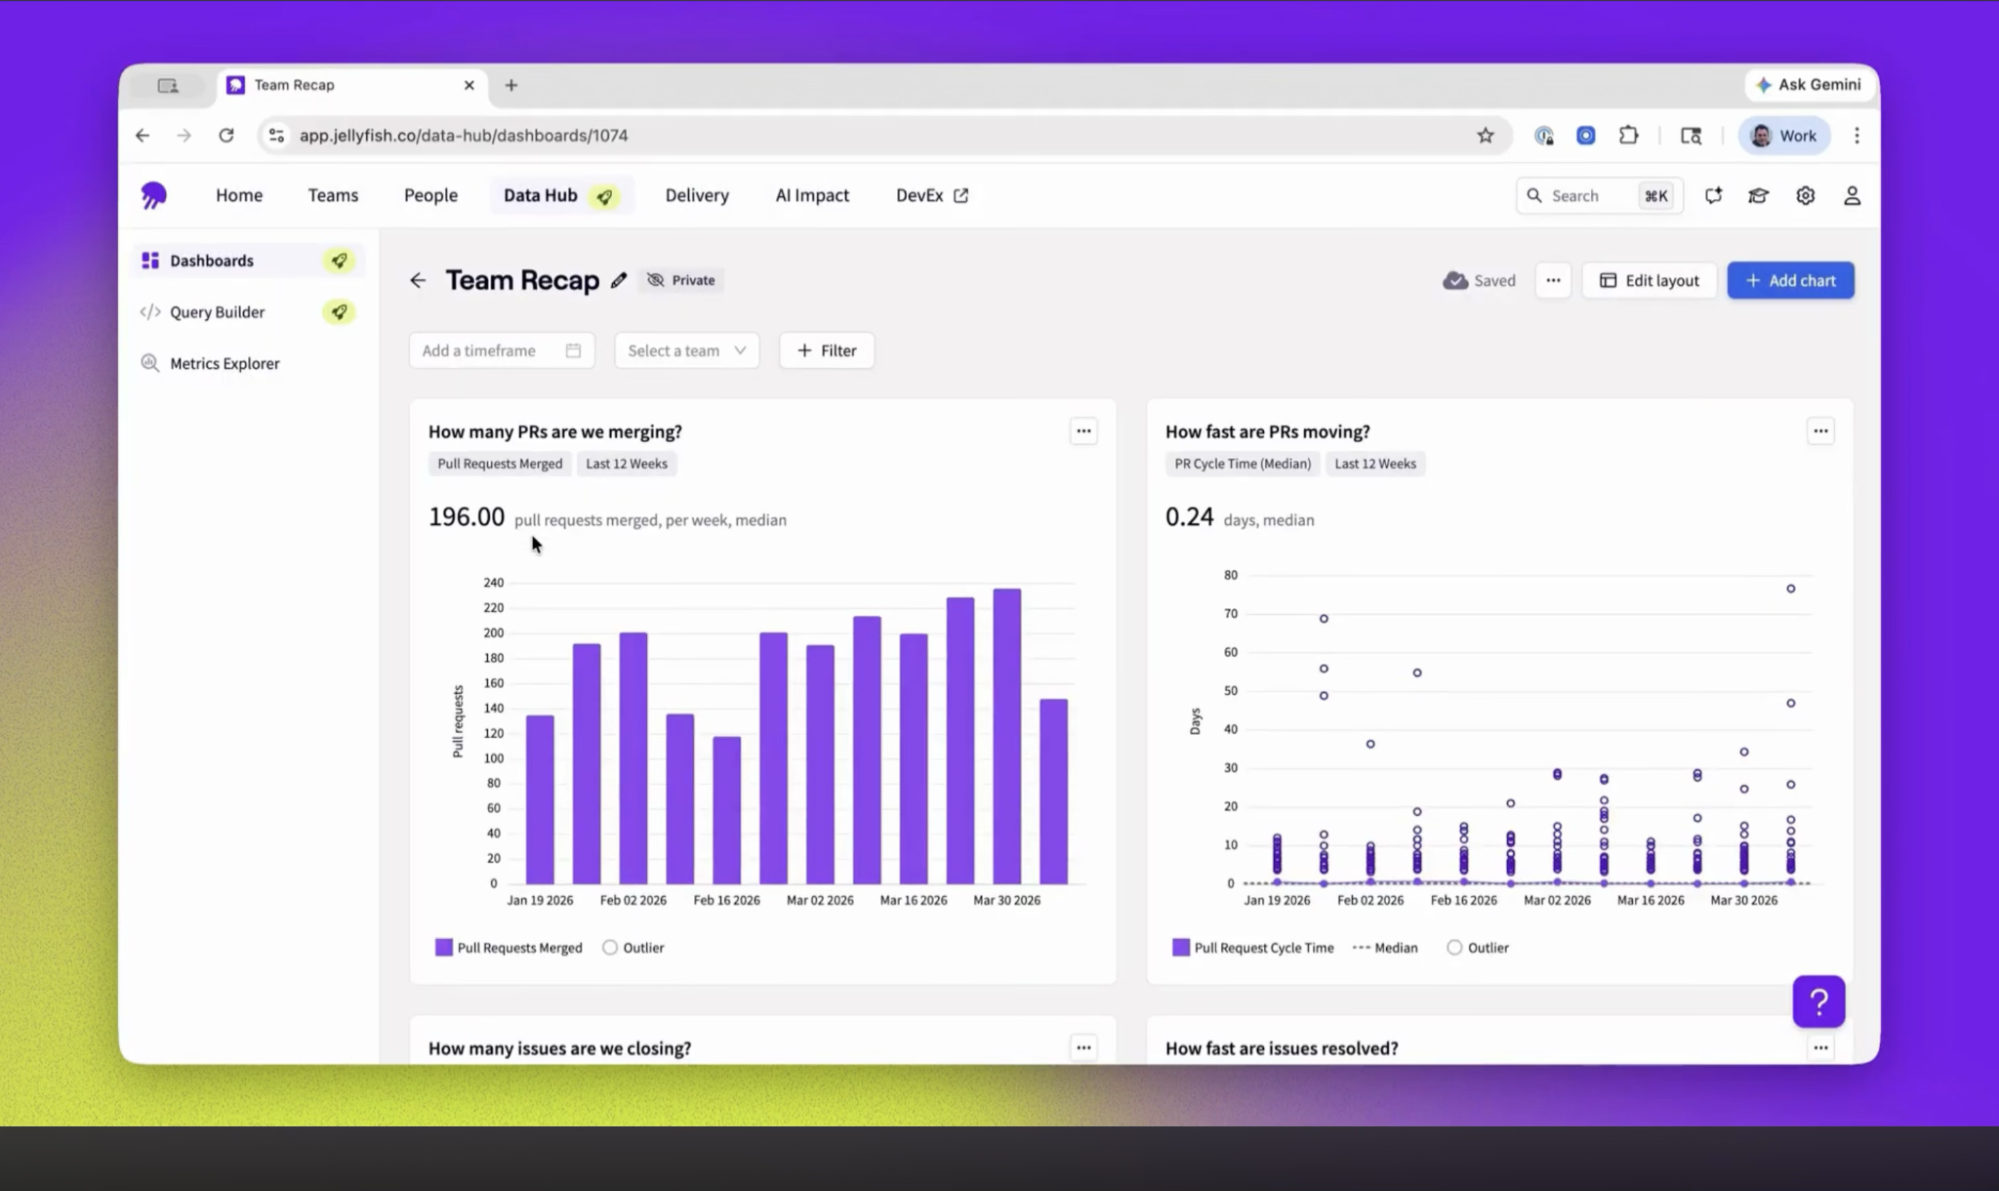
- Data hub: Brings data from engineering tools like Git, Jira, CI/CD systems, incident tools, and AI coding tools into one normalized view. It shows you patterns, anomalies, and areas that need attention.

- AI impact: Tracks AI tool adoption, usage, spend, and impact across different teams and tools. This helps leaders see which teams are using AI assistants, how often they are using them, and whether those tools are improving delivery metrics.

- Team Pulse (DevEx): Uses structured surveys to collect feedback on workflow friction, tool satisfaction, team health, and developer sentiment.

- Resource allocation: Shows how engineering effort is being spent across roadmap work, KTLO, support, infrastructure, innovation, and other business priorities.

- Capacity planning and forecasting: Shows whether teams have enough capacity for committed roadmap work, where teams may be overextended, and where unplanned work is eating into planned capacity.

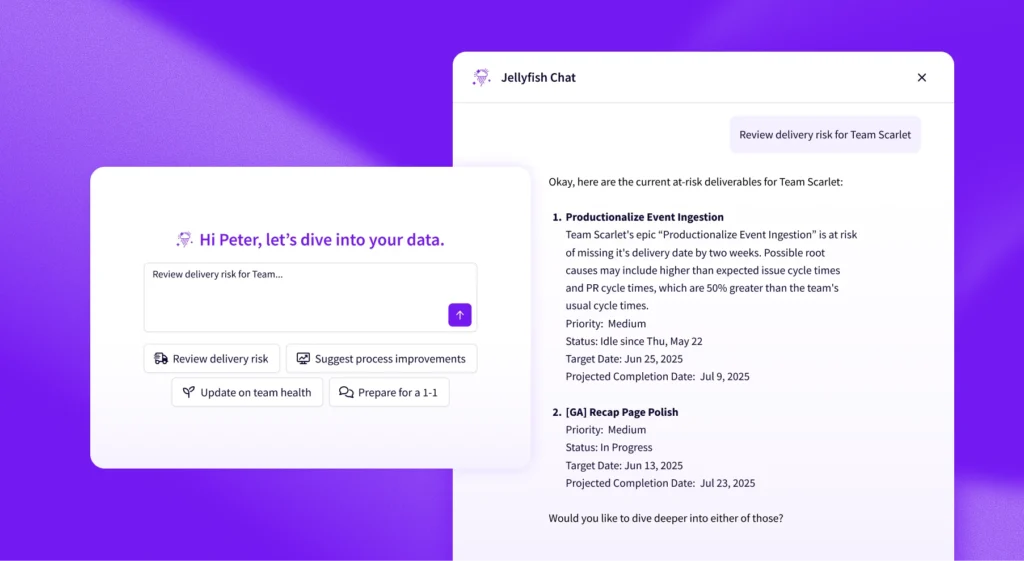
- Delivery risk: Jellyfish can surface early delivery risk signals. For example, it can flag when an initiative is falling behind, when allocation changes may affect delivery, or when work is not progressing at the expected pace.

How Jellyfish Performs in Engineering Organizations
| “Jellyfish has provided us with full visibility across our product portfolio into both execution and fundamental metrics.”
Leonid Igolnik, EVP of Engineering at Clari. How Clari used Jellyfish to reach 79% on-time delivery and increase roadmap spend |
| “With Jellyfish, I could take a quick look and see that the project was tracking. I was able to go back and say with confidence that we’re going to deliver before the projected date.”
Richard Hunt, Vice President of Engineering, Teachable. How Teachable learned to anticipate, build, and deliver lasting engineering impact |
| “We’re getting subjective information from the surveys and corroborating it with objective information in Jellyfish. This has had a positive impact on teams and morale.”
Michael Robinson, VP of Technology and Architecture, Kaleris. How Kaleris created happier and 21% more productive teams with Jellyfish |
What Jellyfish users are saying
- “I really like the interface and how easy it is to navigate through the data. If you have your hierarchy set up and use Jira effectively, the integration lets you move up and down through the different levels of your organization and see how data from smaller units rolls up into the larger picture.” (Read full review)
- “Jellyfish is very easy to use and has a lot of documentation, which is great. I love the look and feel of the service. I appreciate the ability to assign team priorities and see how a single individual is doing. The Daily Team Digest to Slack is vital for monitoring across teams, and the Team Summary Dashboard offers an excellent snapshot of team performance and an insight into sprint trends.” (Read full review)
Is Jellyfish the right choice for your engineering team?Depends on what you want from a DORA metrics tool. If your team only needs a simple view of deployments and pipeline health inside one repository system, native GitHub or GitLab dashboards may be enough. But if your engineering work spans multiple teams, services, tools, and business priorities, Jellyfish gives you the broader layer of visibility needed to understand delivery performance in context. With Jellyfish you can connect DORA metrics to capacity planning, roadmap execution, developer experience, and investment decisions. |
2. Swarmia

Swarmia is another software intelligence platform that engineering teams use to measure delivery performance, improve developer productivity, and create healthier software delivery habits.
This workflow typically starts from the engineering team. Swarmia sends Slack notifications to the people who need to act on them.
It lets teams set their own ‘Working Agreements,’ such as review time targets or limits on work in progress. It also combines delivery metrics with developer experience surveys, so leaders can understand both the output and the human side of engineering work.


There’s also the ‘Investment Balance,’ which shows how engineering time is split across roadmap work, bug fixes, and technical debt.
Key features
- Pull request inbox: Teams get a clear view of open pull requests across connected repositories. It shows which PRs are waiting for review, how old they are, who needs to act, and whether CI checks are failing.
- Flow insights: Shows how work moves through the delivery process, from issue creation to deployment. It breaks down cycle time across different stages, such as development, review, QA, and deployment waiting time.
- CI visibility: Enables teams understand how their CI/CD pipelines are performing. This includes build duration trends, failure rates, flaky tests, and where teams are losing time inside the pipeline.
- SPACE framework metrics: Helps understand team health in terms of performance. Swarmia pulls this insight from developer surveys, focus time data, collaboration patterns, and work activity.
What Swarmia customers are saying
- “All team metrics in one location between GitHub and Jira. Set up and Integration was quick and painless. Easy team configurations and even tools to narrow scope for our needs.” (Read full review)
- “The pricing model is tightly tied to GitHub seats, even though not all users in the GitHub organization necessarily require analytics (to be tracked).” (Read full review)
Is Swarmia the right fit for you?Swarmia is a considerable option for engineering managers and team leads who want to improve flow without creating a surveillance culture. The combination of working agreements, PR visibility, Slack or Microsoft Teams notifications, and developer experience feedback makes Swarmia feel more collaborative than top-down. But its main limitation is depth at a larger scale. Swarmia is easier to adopt than many enterprise platforms, but it may not be the best fit if you need advanced financial reporting, deep initiative tracking, public API access, or highly customized data exports. |
3. LinearB

LinearB is an engineering management platform that helps teams measure delivery performance and improve the workflows behind those metrics.
This works in three layers:
- LinearB Metrics is the analytics layer: It tracks DORA metrics like deployment frequency, lead time, change failure rate, and MTTR, along with other software delivery metrics. It also benchmarks teams against a large dataset of pull requests from engineering organizations around the world.
- gitStream is the automation layer: It helps teams turn metric insights into workflow rules that improve how code moves through review and merge.
- WorkerB is the assistant layer: It works in Slack and Microsoft Teams to remind developers about stalled pull requests, automate updates, and keep work moving without manual follow-up.
For example, instead of just notifying a team that a pull request has been waiting too long, gitStream can assign the right reviewer, add the right label, enforce a merge rule, or route the PR to someone with the right code knowledge.

Key features
- Monte Carlo project forecasting: Uses historical throughput and cycle time data to simulate thousands of potential project delivery outcomes.
- For example, a project may have a 70% chance of shipping by one date and a 90% chance of shipping by a later date.
- Dev coaching: Gives managers and engineers a clearer view of individual and team work patterns. It can show trends like pull request size, review participation, code churn, and delivery habits.
- Investment profile: Visualizes how engineering effort is split across new feature work, maintenance, and bug fixes.
- One-click ticket: Enables developers to instantly create a Jira or project management ticket for an unlinked code branch without leaving Slack.
What LinearB customers are saying
- “It’s easy for any team member or leader to understand how our time is used, what’s currently going on, and how we can measure improvement through process changes.” (Read full review)
- “While LinearB works seamlessly with Github and Jira, which are the platforms we use, broader integrations could elevate its value even further.” (Read full review)
Is LinearB the right fit for you?Yes, for teams looking to move from measurement to workflow automation. If you have a poor delivery timeline due to slow PR reviews, unclear ownership, or large pull requests, LinearB gives you tools to act directly on those problems. |
4. Code Climate Velocity

Code Climate Velocity is an engineering management platform that helps teams measure delivery performance, workflow health, and code quality in one place.
While it does track DOR A metrics, it also shows the quality of the code being shipped. That includes maintainability, test coverage, code churn, rework, and technical debt.
For example, leaders can see whether slower cycle time is tied to larger pull requests, more rework, or poor test coverage.
Velocity also pulls deployment and incident data directly from connected tools. This can make DORA reporting more accurate for teams with complex release processes, where deployments are not always easy to infer from merge activity alone.
Key features
- Developer360 and Team360 reports:
- Developer360 shows an individual engineer’s contribution patterns, such as commits, pull requests, reviews, code churn, and areas of codebase knowledge.
- Team360 brings those signals together at the team level. It helps leaders understand delivery patterns, collaboration, workload distribution, and team health.
- Timeline annotations: Enables teams mark important events directly on metric charts. For example, a leader can mark when a new CI/CD pipeline was launched.
- Test coverage analysis: Tracks test coverage across repositories and shows where coverage is missing. It can highlight coverage gaps by file or function and track coverage trends over time.
- Multi-repository application view: Groups multiple repositories into one application view. This is great for teams working with microservices, monorepos, or applications spread across several repositories.
What Code Climate Velocity customers are saying
- “It’s very good to see things like how many lines are covered by unit tests, how many issues we have or how many code duplications we have.” (Read full review)
- “Some thresholds are very hard to understand at first glance, like code duplication, we have some code that for us is not very similar but Code Climate is still complaining about duplication.” (Read full review)
Is Code Climate Velocity the right fit for you?Code Climate Velocity is a good fit for engineering teams that want better visibility into cycle time, pull request flow, review speed, and team-level delivery patterns. It’s also great for managers who want to improve team execution without building custom analytics from Git and Jira data. |
5. Waydev

Waydev is another SEI platform for engineering leaders to measure productivity, quality, DevOps performance, process health, and team effectiveness.
Based on its broad design, Waydev tracks more than 130 metrics across areas like DORA, SPACE, code quality, productivity, churn, and commit risk.
One of Waydev’s stronger areas is AI adoption tracking. Its AI Adoption, Impact, and ROI module helps leaders see which teams and developers are using AI coding tools, how often they are using them, and whether that usage is improving delivery outcomes.

There’s also the Waydev Agent, a conversational interface that lets leaders ask questions about engineering performance, costs, output, team trends, or AI impact.
Key features
- Developer experience: Collects structured feedback from engineers and connects it with delivery and productivity data.
- Cost capitalization: Show project-level costs, resource allocation, roadmap versus unplanned work, and cost capitalization data for R&D tax and accounting needs.
- Sprint analytics: Waydev helps teams inspect sprint execution, planned work, completed work, carryover, and delivery risk.
- Custom dashboards: Teams can build dashboards around the metrics and workflows that matter most to their organization.
What Waydev customers are saying
- “WayDev makes it simple to gain meaningful visibility into your IT organization — whether you’re on the engineering team in GitHub or just interacting with Jira.” (Read full review)
- “Some of the AI-related insights could benefit from more customization, especially when trying to tailor views for different stakeholders like engineering managers vs. executives.” (Read full review)
Is Waydev the right fit for you?Teams that want historical reporting, sprint visibility, AI productivity tracking, and custom dashboards will likely find Waydev useful. Although it can feel more reporting-heavy than the rest. While it gives leaders many ways to view engineering performance, teams still need to make sure the insights connect to better business decisions. |
6. Haystack

Haystack is a lightweight engineering analytics platform that focuses on a smaller set of useful engineering signals.
The platform’s workflow is based on what it calls the ‘NorthStar metrics.’ These include the four DORA metrics, along with supporting signals like cycle time, review latency, merge latency, and pull request size. Together, these help teams understand how work moves from code to delivery.
Haystack also includes Delivery Pulse, which helps automate release notes, sprint summaries, and milestone updates. This reduces the manual work managers often do when preparing stakeholder updates.

Key features
- Metadata-only analysis: Haystack analyzes metadata only. This includes pull request timestamps, titles, descriptions, commit messages, and issue transitions. It does not access, scan, or store source code.
- Real-time slack alerts: Sends Slack alerts when important workflow issues appear.
- For example, it can notify the team when a pull request has been waiting too long for review, when review queues are building up, or when work patterns suggest possible burnout risk.
- AI-assisted weekly insights: Uses AI-assisted summaries to highlight weekly changes in team metrics.
- Domain knowledge: Uses commit history and review activity to show which engineers have the most context on specific repositories or services.
What Haystack customers are saying
- “Provides engineering North Star metrics from the top-down, allowing you to find where bottlenecks are in the software development lifecycle. Risk alerts provide very easy to understand, fast insights.” (Read full review)
- “The web interface works slow sometimes. I would be happy to use a more modern interface.” (Read full review)
Is Haystack the right fit for you?If your team needs to connect Jira and Git, track sprint health, surface delivery risks, automate updates, and understand DORA-style trends, Haystack gives you a clean way to start. The Slack alerts and weekly insights make the platform feel operational, which is helpful for teams that want metrics to shape their weekly delivery habits. |
7. Pluralsight Flow

Pluralsight Flow (now moving under Appfire as Appfire Flow) is an engineering analytics platform that helps software teams understand how work moves through the development lifecycle by analyzing commit, ticket, and pull request data.
Flow connects Git activity to DORA metrics, investment reporting, and developer productivity analytics. It tracks metrics like lead time, deployment frequency, change failure rate, and MTTR using data from CI/CD, incident management, and issue tracking tools.

It also includes ‘Investment Profile’, which helps leaders see how engineering time is being spent across business priorities. For example, teams can see how much effort is going toward roadmap work, maintenance, bugs, technical debt, or capitalizable R&D work.

There’s also individual and team-level activity data for leaders to understand what may be driving performance. Like if DORA metrics show that delivery is slowing down, Flow can help managers look at review patterns, commit activity, work distribution, and other signals behind the numbers.
Key features
- Check-in: This is Flow’s 1:1 conversation tool for managers and engineers. Managers can use it to talk through progress, blockers, goals, workload, and development areas with each engineer.
- Learning recommendations: Flow can connect engineering analytics to Pluralsight’s learning content. It can use patterns from code activity to suggest relevant training for engineers. For example, if the platform identifies a skill gap, it may recommend a related Pluralsight
- Multi-Git provider support: Supports multiple Git providers, including GitHub, GitLab, Bitbucket, and Azure DevOps. It also connects with Jira and Azure Boards for issue tracking context.
- Mob and pair programming support: Supports teams that practice mob or pair programming by recognizing and distributing credit for shared code commits.
What Pluralsight Flow customers are saying
- “The tool is quite user-friendly, which makes the initial setup process easy and allows me to start working without delays.” (Read full review)
- “One area where Flow could improve is customization. Sometimes I feel limited in how I can structure or personalize workflows to match my exact way of working.” (Read full review)
Is Pluralsight Flow the right fit for you?Pluralsight Flow is a good fit for organizations already using Appfire tools like 7pace Timetracker or BigPicture PPM, especially if they want engineering analytics to sit closer to their Jira, Azure DevOps, or portfolio management workflows. The Learning Recommendations feature also drives interest. This can be useful for organizations with a strong learning culture, where managers and engineers actively use development plans to improve skills. |
8. GetDX (now DX)

DX is a developer intelligence platform that helps engineering leaders understand both delivery performance and developer experience.
While it does track DORA metrics based on speed and quality, it also looks at ‘Effectiveness’ through its Developer Experience Index, or DXI.

DXI is a survey-based score that measures the friction developers face in their daily work, such as tooling issues, slow processes, unclear priorities, meetings, interruptions, and poor workflows.
It also extends this capability into supporting different survey types like pulse checks and deep studies into specific problems. For example, if cycle time increases, DX can help show whether the issue is tied to tooling friction, review delays, unclear requirements, or developer experience problems.
Key features
- Workflow analysis: Visualizes where time is being lost across the software delivery process. It can show which teams, roles, or workflows are losing the most time to friction.
- Snapshot, experience sampling, and targeted studies: DX collects developer feedback in three main ways.
- Snapshot surveys run on a regular schedule and give leaders a broad view of developer experience across the organization.
- Experience sampling is lighter and more frequent. It helps catch smaller issues between larger survey cycles.
- Targeted studies are deeper investigations into specific problems, such as tooling friction, a slow workflow, or a team-level blocker.
- Industry benchmarking: Helps teams compare their metrics against similar organizations, roles, or industries.
- Engineering allocation: Shows how much engineering effort is going toward new product work, maintenance, or other business priorities.
What DX customers are saying
- “The heatmap is a bit hard to see, not very organized, the colors are very similar, and it’s difficult to understand the differences in the heatmap.” (Read full review)
- “I like the Slack integrations because they notify me when things are fully out of scope, like PRs needing review, which is really helpful.” (Read full review)
Is DX the right fit for you?DX is worth considering for organizations that want to understand developer productivity from the developer’s point of view. By pairing DORA metrics with survey-based insight, organizations can easily build a credible internal DevEx program. |
How Do the Best DORA Metrics Tools Compare To Each Other?
How Do the Best DORA Metrics Tools Compare To Each Other?
The overall ‘best’ DORA metrics tool depends on what your engineering organization needs to improve.
Some of the platforms here are better for pull request automation. In other instances, some are stronger for team-level workflow visibility.
We’ve created a side-by-side comparison to help you out:
| Tool | Best For | Where It’s Strongest | Main Limitation |
| Jellyfish | Engineering intelligence and DORA metrics at scale | Connects DORA metrics to resource allocation, roadmap execution, developer experience, AI impact, and business outcomes | May be more platform than a small team needs if they only want basic CI/CD visibility |
| Swarmia | Team-level DORA improvement and working agreements | Strong for pull request flow, team habits, Slack/Teams feedback loops, developer experience surveys, and continuous improvement | Less comprehensive for executive-level investment allocation and business alignment |
| LinearB | Workflow automation and predictable delivery | Strong for PR automation, gitStream, WorkerB, cycle time breakdowns, delivery forecasting, and project risk visibility | More focused on workflow automation than broad engineering intelligence |
| Code Climate Velocity | Cycle time visibility and engineering workflow analytics | Strong for PR cycle time, review speed, workflow bottlenecks, and team-level performance trends | Narrower than platforms that connect engineering work to business outcomes and resource allocation |
| Waydev | Custom engineering analytics dashboards | Strong for DORA, SPACE, sprint analytics, developer experience reporting, AI adoption, and customizable dashboards | Can feel more reporting-heavy than operationally connected |
| Haystack | Lightweight delivery analytics and risk detection | Strong for Jira/Git visibility, delivery risks, Slack alerts, sprint health, release notes, and weekly insights | Less comprehensive for executive planning, AI ROI, and business-level engineering intelligence |
| Pluralsight Flow | Workflow analytics and team health visibility | Strong for commit, ticket, PR, sprint movement, retrospective, and collaboration analytics | More focused on workflow diagnostics than modern engineering operating insights |
| GetDX | Developer experience measurement and productivity research | Strong for survey-backed DevEx measurement, DX Core 4, SPACE, DORA, friction analysis, and productivity research | Less focused on delivery operations, investment allocation, and executive engineering management |
| “Visibility into adoption is our number one Jellyfish use case, but after adoption, we’re going to want to know how this is helping with our efficiency.”
Director of Technical Program Management. Read case study → How an Enterprise Gaming Company uses Jellyfish to drive continuous improvement for 1,500 engineers |
Build a Clearer View of Engineering Performance With Jellyfish
Build a Clearer View of Engineering Performance With Jellyfish

The seven other tools in this guide calculate DORA metrics well. LinearB, for example, automates workflow improvement through gitStream. Haystack keeps things lightweight and surfaces delivery risk fast.
Each one, in its own way, helps you understand how fast and how reliably your engineering team ships.
Jellyfish does that too and connects delivery activity to business outcomes.
Here’s what that looks like for you:
- DORA metrics that don’t stand alone: Deployment frequency, lead time, change failure rate, and MTTR tracked at the team, service, and org level, with the business context layer that shows which initiatives and investment categories those numbers reflect.
- Allocation insights for resource planning: See whether planned versus actual engineering allocation matches, where unplanned work is affecting capacity, and how that’s shifted over time.
- Benchmarks that mean something: Compare your DORA metrics against Jellyfish’s anonymized dataset, segmented by company size and engineering org size.
- Reporting stakeholders outside engineering can use: Pre-built executive reporting that translates engineering performance into the language product, finance, and leadership need. Plus you won’t have to build the translation layer yourself every quarter.
- Integration depth across your existing stack: GitHub, GitLab, Bitbucket, Jira, Linear, PagerDuty, Opsgenie, and major CI/CD platforms.
| “If someone asks me about reporting and Jira in the same sentence, I direct them to Jellyfish. I always offer myself for a personal demo for anyone who needs it.”
Rebecca Lewis, Agile Coach, Keller Williams How Jellyfish helped Keller Williams Realty improve data accuracy by 20% |
Pick the tool that fits where your team is today.
- If that’s a clean DORA dashboard with no overhead, several tools in this guide will get you there faster.
- If it’s a platform that grows with the questions you’re asking, Jellyfish is built for that conversation.
| Discover how Jellyfish helps leaders understand what’s driving delivery performance across teams → |
FAQs: DORA Metrics
FAQs: DORA Metrics
What are DORA metrics based on?
DORA metrics come from years of DevOps research into what separates high-performing engineering organizations from slower, less reliable teams.
The core idea behind DORA research is that software delivery performance can be measured through a small set of practical indicators tied to speed, stability, and recovery.
What are the key metrics in DORA?
The four key metrics are deployment frequency, lead time for changes, change failure rate, and mean time to recovery.
These KPIs help engineering leaders understand how quickly teams ship, how often changes create problems, and how fast teams recover from incidents or downtime.
How do DORA metrics tools collect data?
DORA metrics tools automate data collection by connecting to the systems engineering teams already use.
These data sources often include Git providers, CI/CD platforms, issue trackers, incident tools, deployment systems, and sometimes plugins that extend visibility across the delivery workflow.
How can a DevOps team use DORA metrics?
A DevOps team can use DORA metrics to find bottlenecks in the development process and optimize how work moves from code to production.
For example, if lead time is increasing, the team can investigate review delays, slow CI pipelines, large batch sizes, or other inefficiencies slowing delivery down.
How do DORA tools help with failed deployments?
A good DORA metrics tool helps teams understand what happened before and after a failed deployment.
It can show the related pull request, ticket, service, incident, rollback, or remediation work, so teams can identify the cause and reduce the chance of repeating the same failure.
Do feature flags affect DORA metrics?
Yes. Feature flags can help teams ship smaller changes more safely, separate deployment from release, and reduce the risk of exposing unstable work to end users.
They can also improve recovery because teams may be able to disable a feature quickly instead of rolling back an entire deployment.
Why do DORA metrics matter for organizational performance?
DORA metrics turn software delivery into measurable engineering metrics that leaders can use to improve organizational performance.
When engineering teams can ship faster, recover faster, and reduce failure rates, the business gets more predictable delivery, fewer disruptions, and better alignment between engineering work and customer impact.
About the author

Lauren is Senior Product Marketing Director at Jellyfish where she works closely with the product team to bring software engineering intelligence solutions to market. Prior to Jellyfish, Lauren served as Director of Product Marketing at Pluralsight.