The State of AI
A Research Review on AI in Software Engineering – H1 2026
Introduction
Introduction
In March 2026, we saw the first user spend more on tokens in a month than a junior developer earns. Power users are bending what is possible in the new AI-SDLC, pulling away from the median engineer. Spend is exploding, returns are diverging, and most teams cannot yet tell which side of that divergence they are on.
Whether AI helps engineers write code is no longer the interesting question. The sharper one is about outcomes: can an agent accomplish a goal when it is set up for success, and what does that setup actually cost? Two more sit behind it. Why is the bill rising faster than the sticker price, and why do a few teams convert tokens into throughput while most do not?
This release concentrates our H1 2026 research from Jellyfish to answer those questions.
Exploding spend, diverging returns is the story of H1 ’26. This report highlights a major shift in how AI is used in software development:
- The cost shock. Spend has gone from a rounding error to a real constraint, rising 16x across the board with a tail that now rivals a junior engineer’s salary.
- The economics of tokens. What AI actually costs, why effective cost keeps rising even when sticker prices hold still, and where more tokens stop buying more output.
- The harness advantage. What the best teams invest in instead of raw spend: context, harnesses, and agent-friendly codebases.
Leading teams are chasing what we call the “AI pop”: a clear jump in productivity and throughput. Standing in their way is what our research calls the agentic barrier: the hurdles in human attention, infrastructure, and cost that teams hit as they push agents further. There is no single way through it, but the industry is pressing on two fronts:
- Running agents on more complex, longer tasks with less supervision: Autonomy
- Running more agents in parallel: Concurrency
Both patterns drive an explosion of token consumption. At the same time, new models and agentic features keep raising the effective cost of running the same workload, so bills pile up and become unsustainable for users who are not converting tokens into productivity. A minority is converting, and converting hard. That is the divergence we are witnessing.
AI is collapsing old processes and creating new ones at an extremely fast pace. We hope this research helps you navigate what comes next in 2026.
Part 1: The Cost Shock
Part 1: The Cost Shock – Explosion of Intelligence
Cost is rising across the board, with a runaway tail.
For most of 2025, AI spend in software engineering was a rounding error. It was a predictable utility: you spent a little more on tokens, you got a little more code. It scaled linearly, cleanly, and predictably.
In the first half of 2026, that relationship broke.
The shift to autonomous, long-running agentic workflows didn’t just increase usage; it fundamentally changed the unit economics of software development. As teams moved from ‘AI as a chat assistant’ to ‘AI as an engineer,’ token consumption exploded – not by percentage points, but by orders of magnitude. By March 2026, we saw the first users spending more on tokens in a month than a junior developer earns. We call it the cost shock: a structural decoupling of spend from output that has caught the industry off guard.
Cost per user has risen across the board: at a typical company the median user went from about $5 a month to $81 in ten months, a 16x climb, and even mid-tier (P75) companies went from $10 to $170. This is a broad-based shift in what software development costs in the new AI-SDLC.
Supports cost in AI is rising broadly for all companies, a typical company’s cost per user grew 16x in ten months
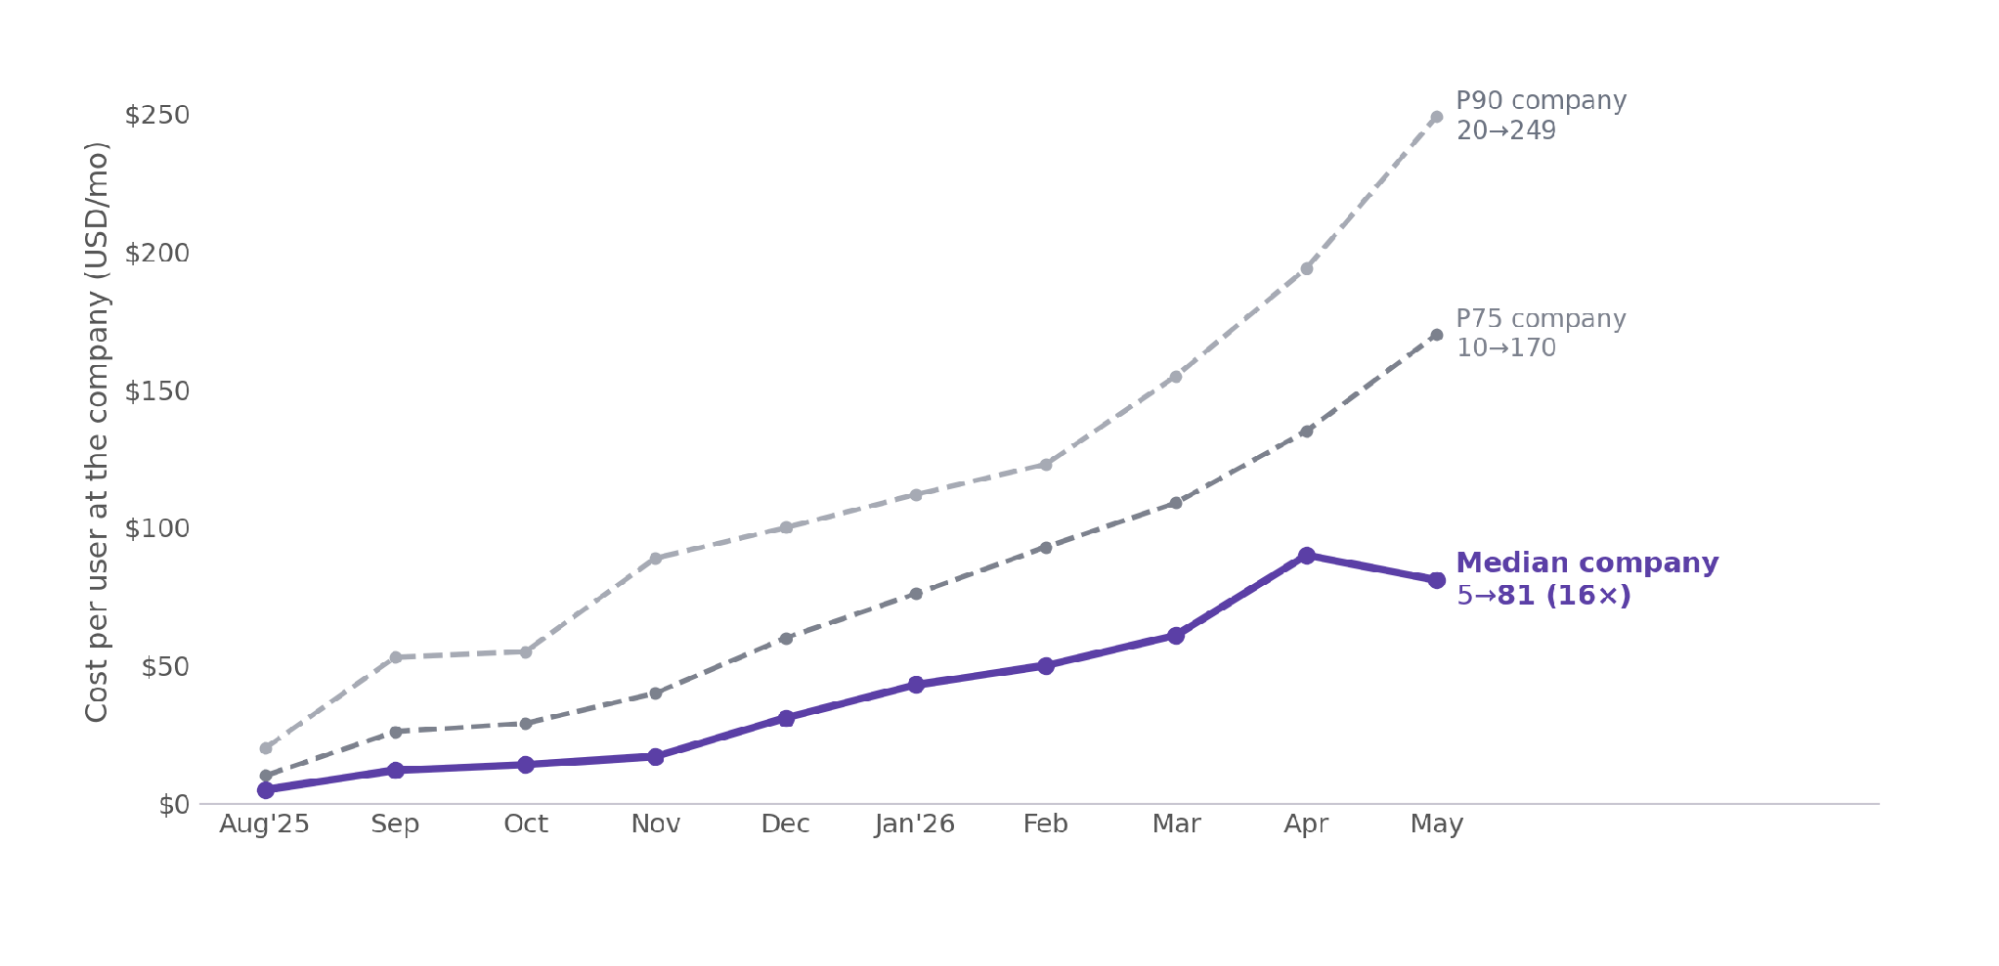
Figure 1. Per-company cost per user by company percentile, Aug 2025 to May 2026. The median company’s typical user went from $5 to $81 a month, a 16x rise, increase is broad-based
Spend is rising across the board, and the extremes are shocking
On top of that broad rise sits an extremely skewed tail. In May 2026, more than half of users still spent under $100 a month, yet the mean ($248) ran 3.5x the median and the 99th percentile ($2,452) ran 35x it. A small number of power users spend enormously, and at the very end of that tail the numbers start to rival human salaries.
Charting the single heaviest user’s monthly spend against a US junior developer’s salary (about $12,500 a month) shows how far the tail reaches: that user touched and at times exceeded the line in spring 2026.
At the very tail, a single user’s bill has touched a junior engineer’s salary
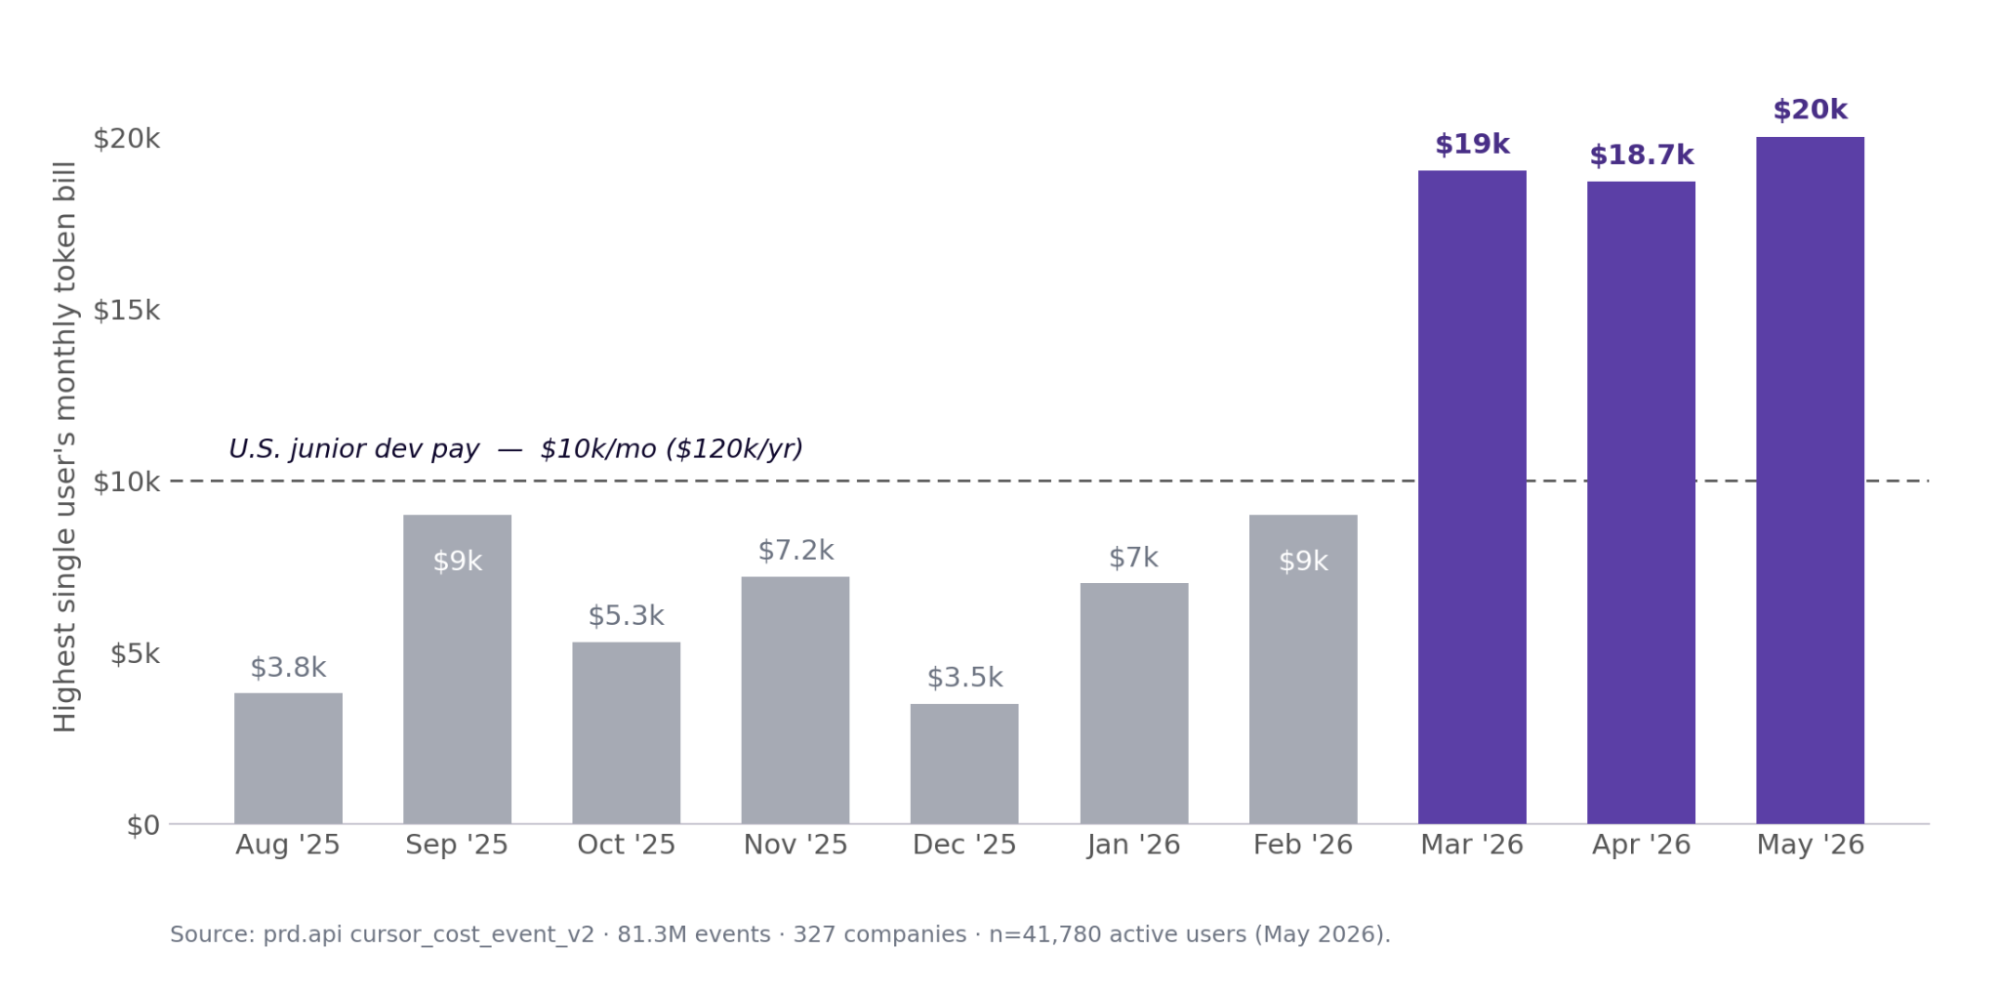
Figure 2. Highest single-user monthly spend vs a US junior developer salary (~$12,500/mo). The tail touches salary territory but does not hold there.
Although this behavior is concentrated only on the top few percent of users at the top few percent of companies, it might be a light of the future we might expect on AI usage in software development.
Dollars follow tokens, so the next question is how fast token consumption is climbing, and then, why the bill rises even when prices do not.
Token spend tripled since October, and power users are decoupling from the median
Tokens are how LLMs process text, and AI labs’ business models are based on how tokens are priced and charged per million.
We have been tracking token usage, and in January something changed. November 2025 brought the release of Opus 4.5, Anthropic’s main model, and usage patterns shifted sharply afterward.
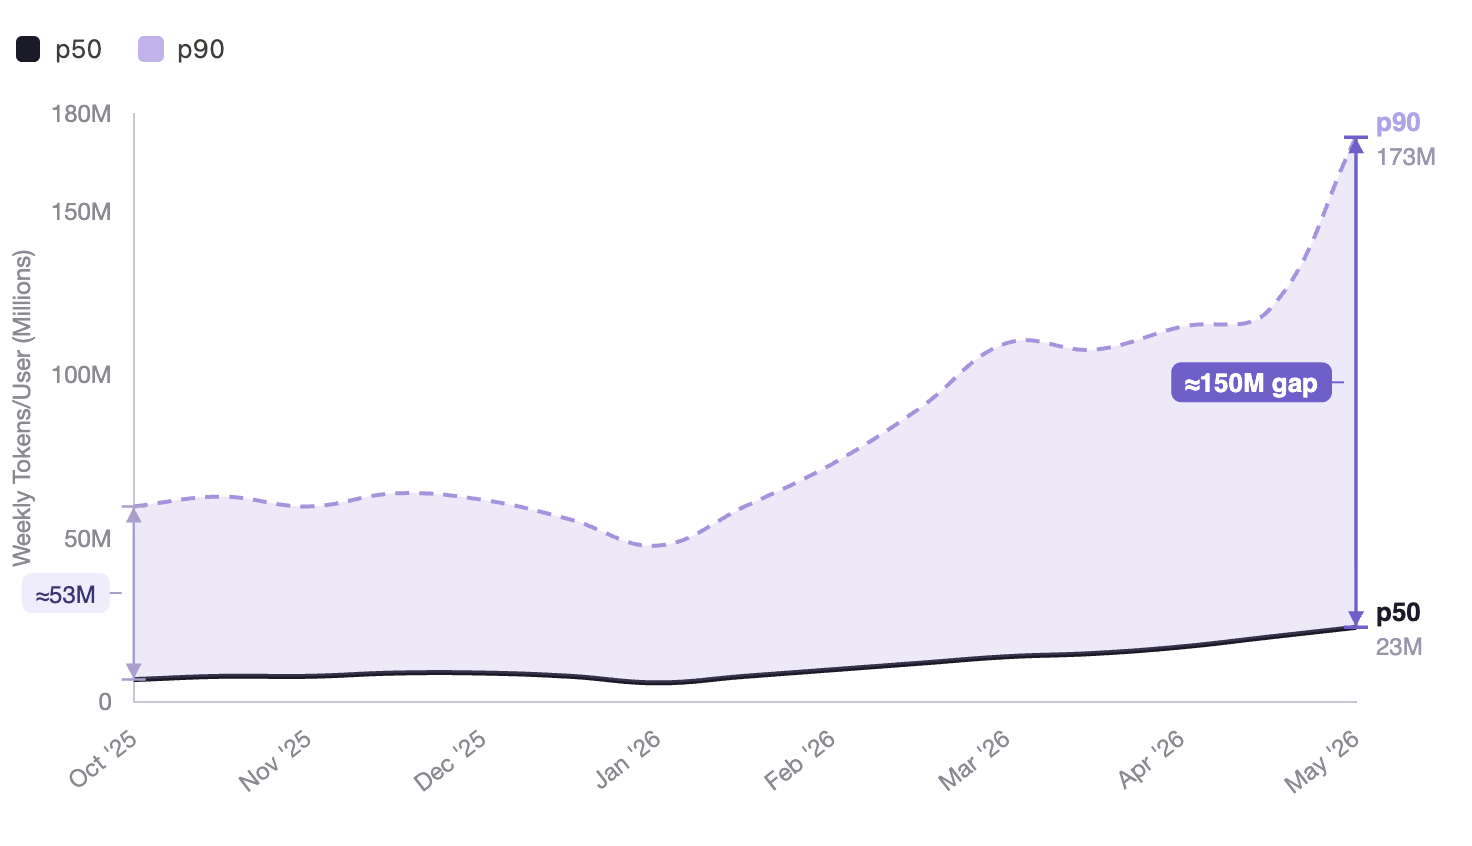
Figure 3. Weekly Claude Code tokens per user, by percentile. Median usage is flat; the top decile separates and accelerates.
Token consumption climbed steeply from the start of 2026, tripling for power users (P90) from 50M to 170M.
We can also see a divergence between power users (P90) and the median (P50). The first group completely decoupled from the rest of the group, benefiting from the increase in throughput and widening the gap from a 50M token difference to 150M tokens.
Who is justifying the bill, and why most cannot follow
If a thin tail is pulling away, the obvious question is what that tail does differently. Three frontier behaviors separate them: they put more work through agents, they let agents run longer with less supervision, and they push on running more agents at once. Each one helps explain who sits on the paying-off side of the divergence, and why the rest are locked out for now.
Autonomous agents are spreading, leading teams now run 1 in 3 PRs through agents
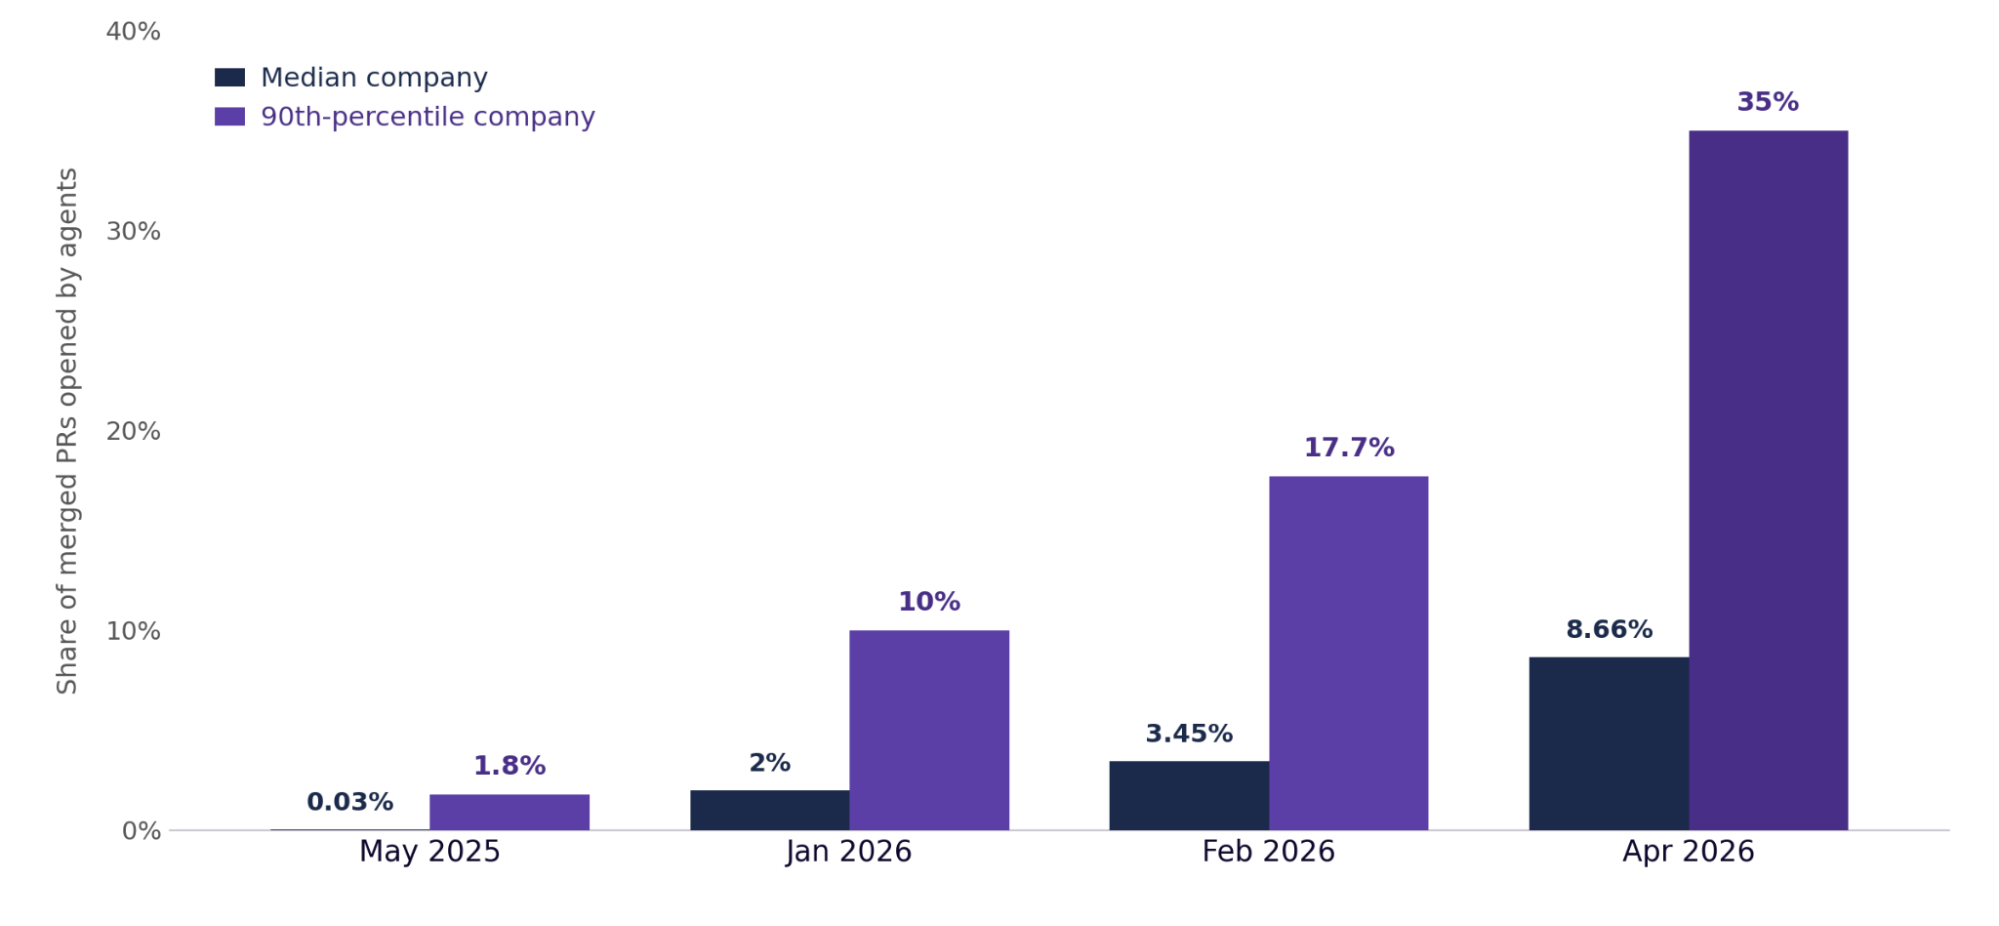
Figure 4. Share of pull requests opened by autonomous agents, by company percentile. The median holds near 2% while the 90th percentile bends steadily upward.
The clearest picture of the widening gap is the share of pull requests opened by autonomous agents, tracked at the company level. At the median, the line barely lifts off 2%. At the 90th percentile it rises and keeps rising: 10% in January, 14.5% by the end of February, 35% by April, against roughly 2% a year earlier. The top of the market is not adopting agents so much as compounding on them, and the distance to the median grows month over month rather than closing.
What are those leading teams doing differently while running autonomous agents? Sorting Claude Code agents by session length and by how often a human interrupted them, supervision barely matters in short and medium sessions.
In the longest sessions, the top 1% by duration, the pattern turns stark: runs left largely alone (under 30% human intervention) produce about eleven times the net lines of code of heavily supervised runs of the same length. Low supervision drives the most lines of code, but the biggest impact lands in the power-user segment. What duration measures here is whether the agent was set up to succeed without rescue, and the output gap suggests power users are engineering that setup differently from their peers.
Long-running agents with light supervision produce 11x more code
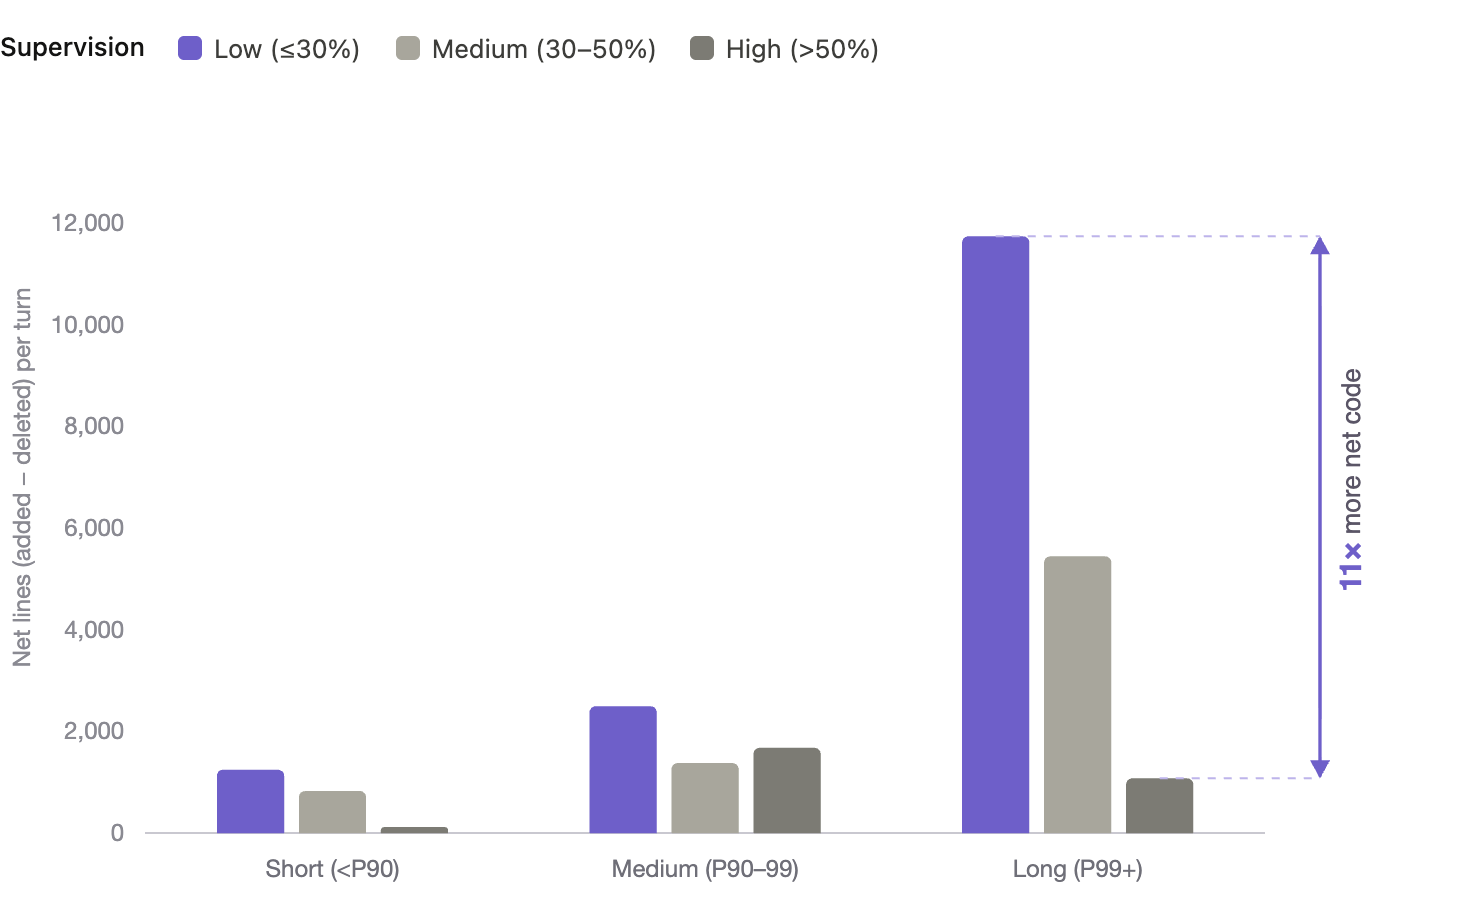
Figure 5. Average net lines per turn by session length and supervision level. Teams with low supervision and long running turns generate 11x more net code than turns with high supervision
The longest sessions in the dataset, the top 0.1%, ran past 94 minutes, and 83% of them involved little human contact start to finish. According to METR, the length of tasks AI can do is doubling every 7 months (at 50% success rate). At this pace, by the end of 2026 we will have agents that will be able to run for as long as 4 hours on a single task.
Setting agents up to complete long tasks autonomously is becoming a huge unlock, but only P99 users are seeing the gains so far. If net lines of added code is a signal of productivity of long workflows – power users understand how to run them and have increased productivity.
Autonomy is one of the challenges that teams are still trying to overcome. We asked ourselves: how many of these agents are power users able to run concurrently? To do so, we studied agent concurrency.
Concurrency hits a ceiling: 84% run just one or two agents at once
If running agents for long periods of time in a loop with a goal until it completes is what unlocks output, the obvious next step is to run more agents at once. But we discovered that high concurrency levels are rare.
Measuring peak concurrent agent use across customers’ turns (each session is composed of multiple turns) hit a ceiling: 84% of active users top out at one or two agents at a time, and even the small group launching four or more spends over 80% of session time attending to a single agent.
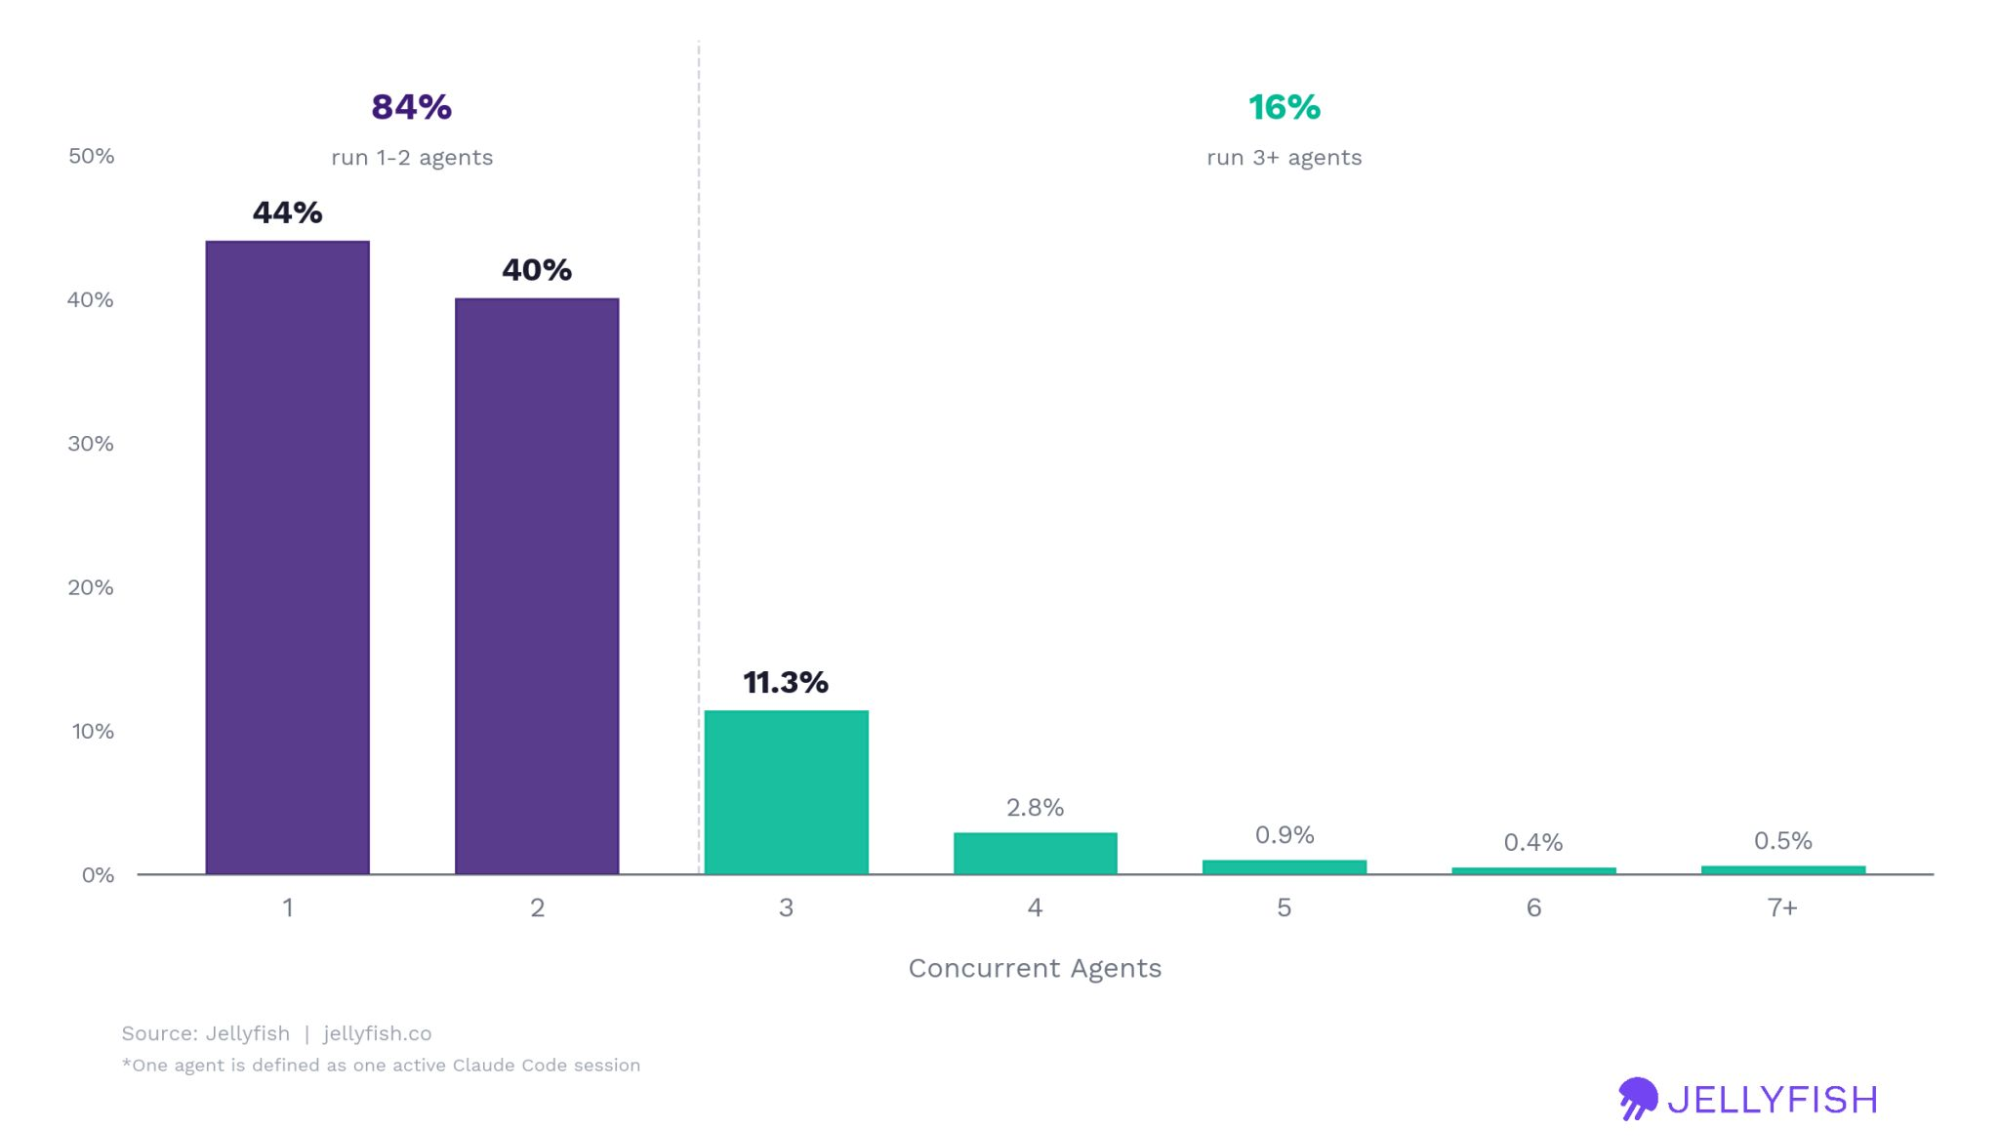
Figure 6. Peak concurrent agents per active user. Almost everyone runs one or two; the agentic barrier is human attention, not tooling.
This is the agentic barrier at its clearest. Human attention is the blocker on multi-agent workflows, and attention does not parallelize. Scaling infrastructure to orchestrate more than a pair of agents is not trivial either, and the industry is still building the tooling for users to scale agents. As Karpathy put it, we will need a bigger IDE.
While agent concurrency currently faces a functional ceiling, the market is introducing solutions to address these limitations. This includes Anthropic’s release of agent teams and platforms like Conductor that facilitate parallel agent execution. For organizations aiming to scale productivity, prioritizing new infrastructure and tools alongside strategies to manage human attention challenges has become essential. We think that the 16% of users running 3+ agents in multi-agentic workflows are highly correlated to teams spreading autonomous agents and getting the productivity gains we see in PRs from Figure 4.
Concentrated gains among elite teams are driven by these frontier behaviors. Because human attention remains a non-parallel resource, most users face rising costs with diminishing returns, while only a few outliers successfully convert high spend into significant output. Cost shock is affecting companies broadly, but these frontier capabilities are creating a divergence in productivity that median users aren’t seeing.
These three behaviors are why the gains stay concentrated. Attention does not parallelize, so only outliers turn heavy spend into output while everyone else pays a rising bill for less. The next part looks at why the bill climbs even when sticker prices hold still, and why more tokens eventually stop buying more output.
Part 2: Economics of Tokens
Part 2: The Economics of Tokens
Where the cost comes from, and why more stops working.
At GTC 2026, Jensen Huang told the room that a $500,000 engineer who isn’t spending $250,000 a year on tokens is a wasted seat. Tokens, in his framing, now belong in the comp package. Sam Altman went further, floating universal basic compute for everyone. The industry pitch is that more tokens are always worth buying, and this part is where that pitch meets the invoice. We looked into whether it is always true, and whether AI labs genuinely mean it or are selling a narrative.
To deep dive into this, we decided to study the price per token: how is the effective cost affected by the release of a new model, how are new agentic features pushing token consumption, and whether tokenmaxxing is the right strategy for companies to build.
How to read your AI bill
Token costs are defined by volume times price, summed over every kind of token, because a model run does not produce one kind of token, it produces four, and each is measured and priced separately.
Bill = Σ ( tokens of each type × price of that type )
The four token types, ordered from most to least expensive (per token):
- Output: The tokens the model generates: the code, the explanation, the edit. Billed at the highest rate of all (on Opus, about $25 per million, 5x input).
- Cache writes: The first time a chunk of context (a system prompt, a tool catalogue, a slice of the repo) is stored so it can be reused, you pay a write premium: about 1.25x the base rate for the five-minute cache, 2x for the one-hour cache. Small in volume, but expensive per token, which is why it carries a large share of the bill relative to its size.
- Input: The fresh text you send that the model has not seen before: your prompt, plus any new files or context. Billed at the base rate (on Opus, about $5 per million tokens).
- Cache reads: Every subsequent time that stored context is pulled back into the model before an edit, you pay only about 0.1x the base rate. Cheap per token, but the tool pulls so much of it (the whole point of an agent is to load your codebase as context) that it dominates volume. In our data, cache reads grew 49% and are the single largest line on the bill.
Why the bill climbs
Two things move the bill, and they move for different reasons: Volume and price
- Volume: While the platform manages the loading process, volume is significantly under user control via “context engineering” – specifically, the user’s decision regarding how much context and codebase information to add to their setup.
- Price: Price per token is set mostly outside user’s control, by tokenizer changes, new reasoning models, and new agentic features, each of which can raise the effective cost of the same workload even when the advertised rate per million holds steady.
Cost per token = f ( tokenizer , reasoning , agentic features )
How to measure tokens
Each call returns a usage object that breaks the tokens out by type and charges per price, below is an example of how the cache is written and charged in the first run.
Example of how tokens are measured and charged
The setup: an agent with a 40,000-token cacheable prefix (system prompt + instructions + context). It gets written on the first turn and read on every turn after.
Turn 1: Establishes the cache
| Token type | Calculation | Cost |
| Cache write (5-min) | 40,000 × $6.25 / 1M | $0.25 |
| Base (uncached) input | 10,000 × $5 / 1M | $0.05 |
| Output | 15,000 × $25 / 1M | $0.38 |
| Turn 1 subtotal | $0.68 |
Turn 2: Reuses the cache
| Token type | Calculation | Cost |
| Cache read (hit) | 40,000 × $0.50 / 1M | $0.02 |
| Base (uncached) input | 10,000 × $5 / 1M | $0.05 |
| Output | 15,000 × $25 / 1M | $0.38 |
| Turn 2 subtotal | $0.45 |
We analyzed how each of these variables behave as a function of the final cost of AI and which levers are under users control and which aren’t.
Tokenizers are driving effective cost of models
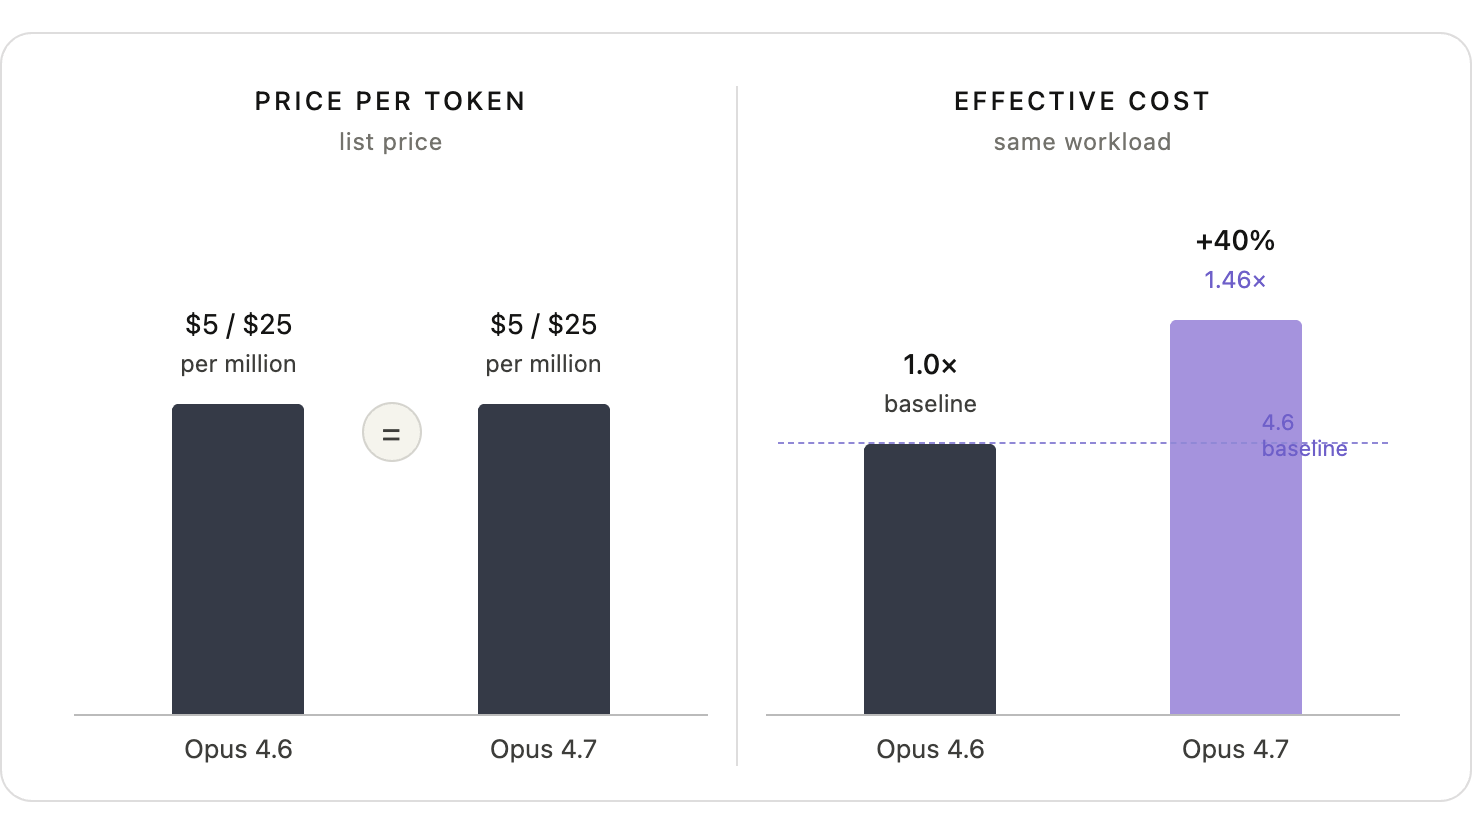
Figure 7. Identical advertised price, divergent effective cost on a matched workload. The variable that moved was the tokenizer, not the price.
What a workload costs depends on the price per token, but also on how a model tokenizes its input (turning text into tokens) and on how much it chooses to think. This implicitly affects how models charge per million tokens. Even when prices per million tokens are constant (as Fig 7 shows for Opus 4.6 and Opus 4.7), the number of tokens a new model release or thinking mode requires changes the total consumed for the same workflow. As Figure 7 shows on the right, you can have the same price per token between Opus 4.6 and 4.7, yet running the same workload costs 40% more, because of how the new tokenizer works.
If this is studied in detail per user cohorts, the distribution is surprising: heavy users absorbed the smallest hit, about +15%, because extended thinking dilutes the input-token premium, while light users took the worst of it at +21%. So, although a model release didn’t change the price per token, it implicitly raised the cost of running the same workflow, affecting progressively lighter users who use fewer tokens.
The tokenizer’s cost increase hit light users hardest
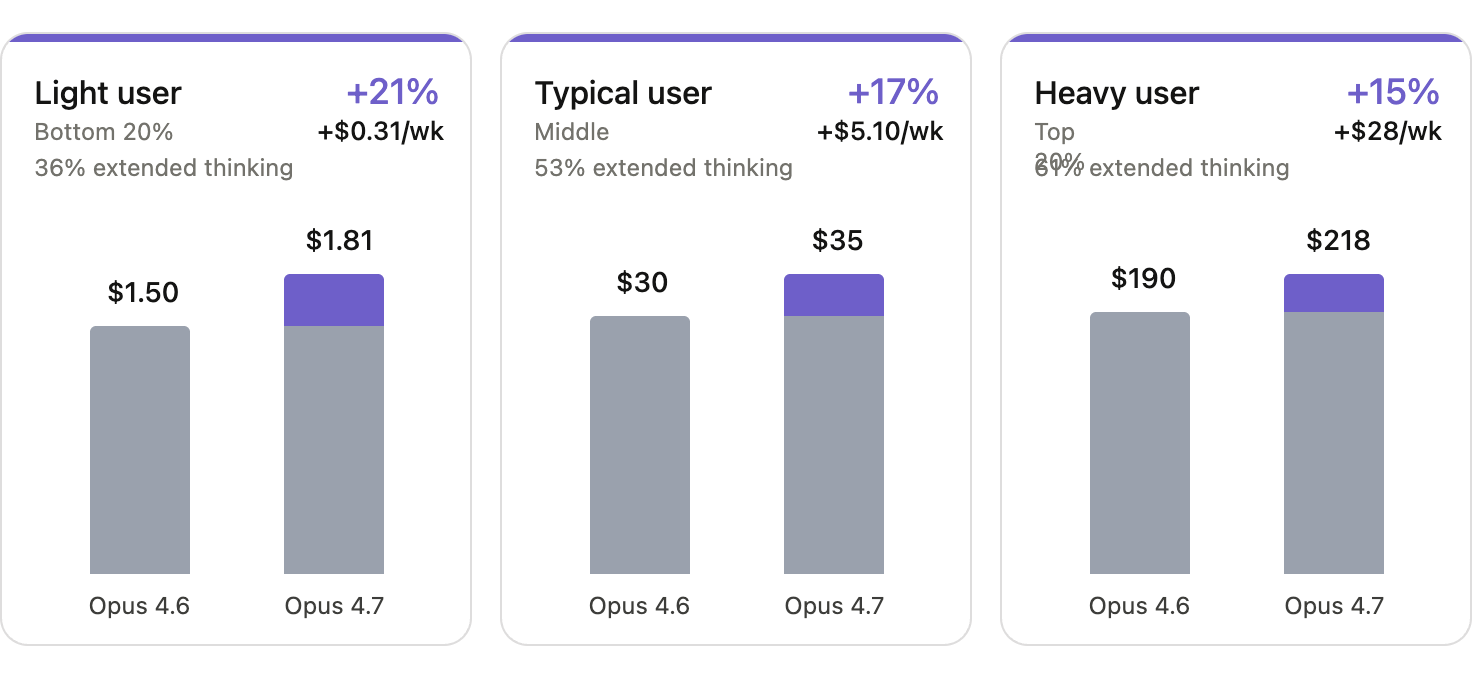
Figure 8. Effective weekly cost increase from Opus 4.6 to Opus 4.7 by user type. The rate card did not move; the realized cost did, and unevenly.
Effective token cost affects users disproportionately with new model releases, due to how these run and their agentic features, so looking at the price per token doesn’t translate into effective cost in practice.
To better understand these ways models are pushing the increase in token consumption we focused on reasoning capabilities and agentic features.
The First Force: Reasoning
Reasoning models are also driving the cost of AI
We analyzed the impact of reasoning-heavy models compared to standard ones, and the economic difference is clear across both monthly spend and per-call costs, as shown below.
Not only is total spend in reasoning models increasing the gap between non-reasoning models, but also per API call.
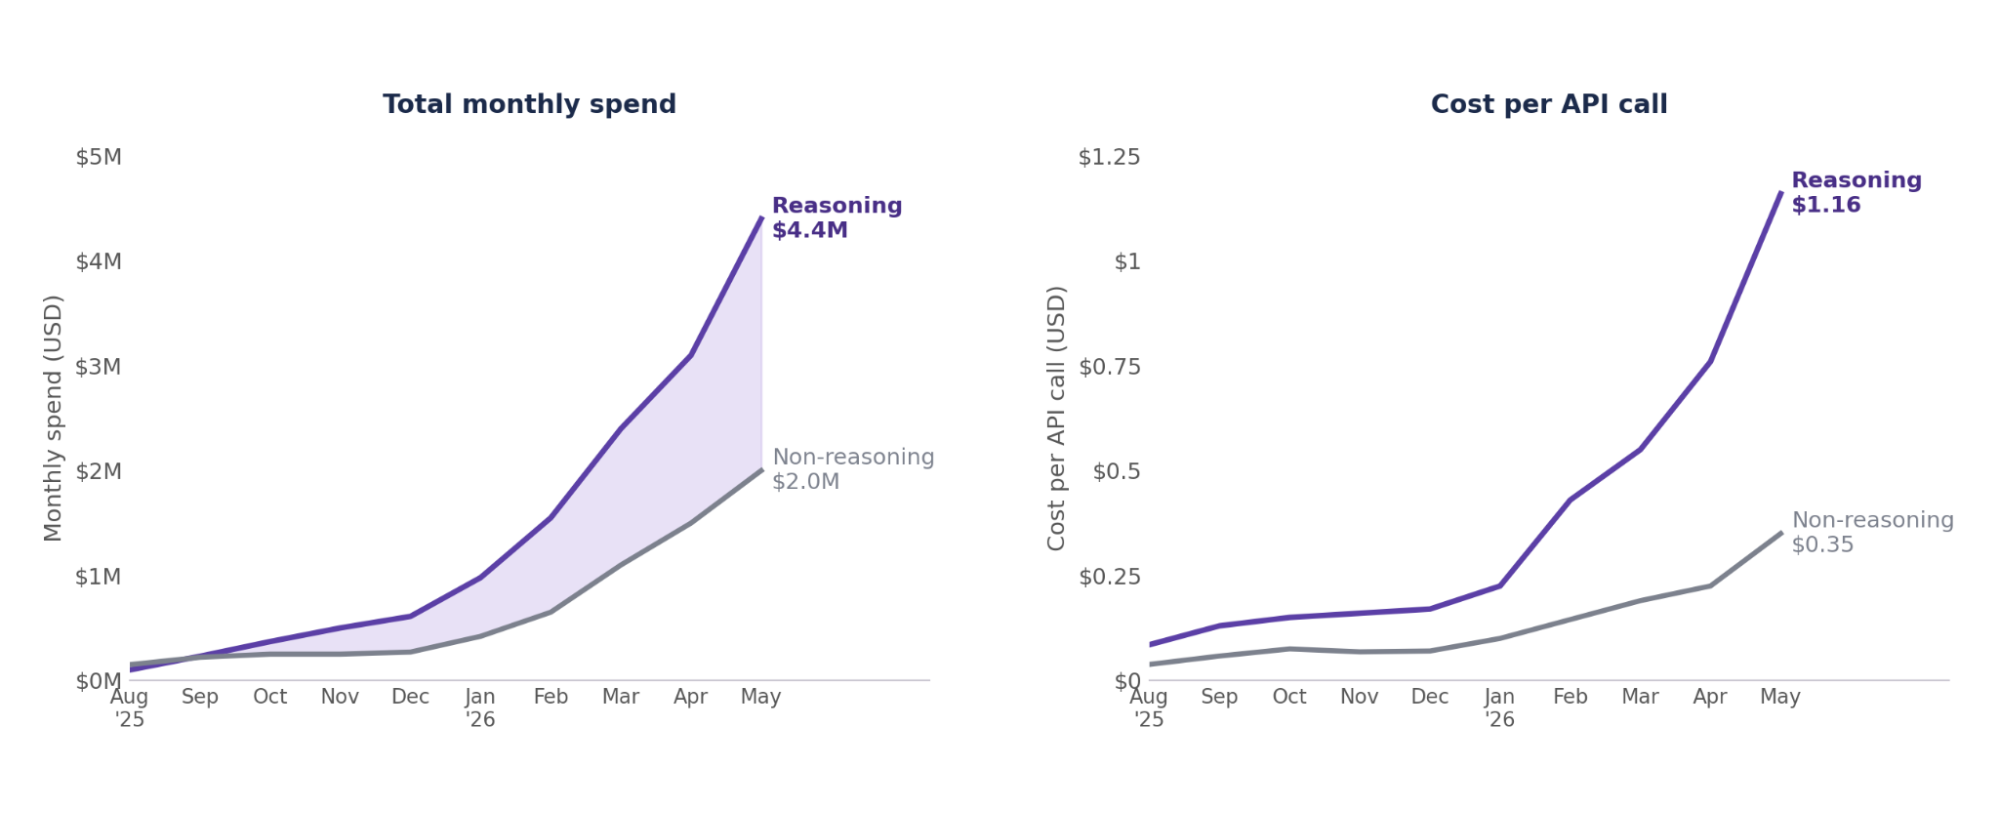
Figure 9. Reasoning vs. non-reasoning economics: (a) monthly spend by model type and (b) average cost per API call. Reasoning costs more on both, in total monthly spend and in the price of a single call.
The Second Force: Agentic Features
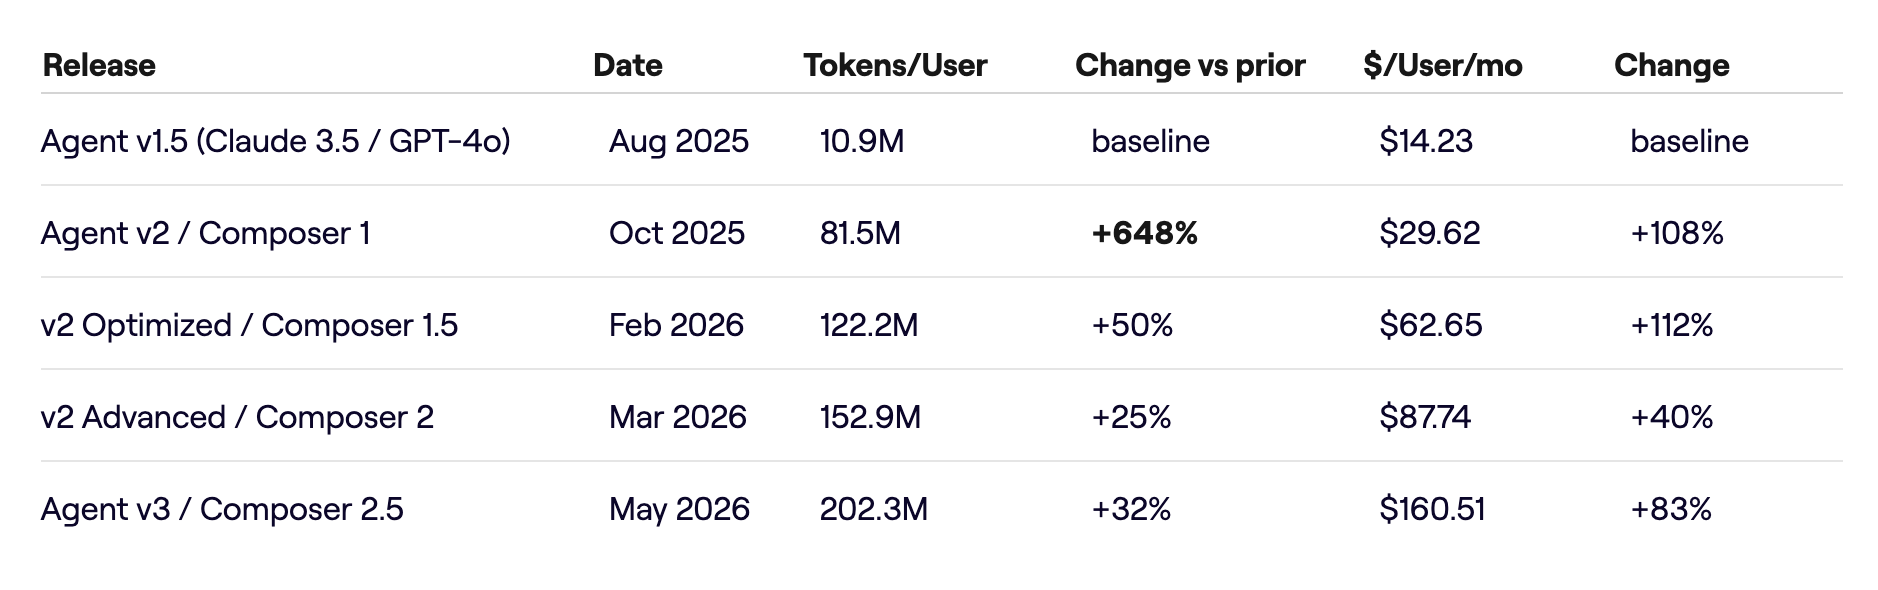
Plotting tokens per user against the release dates of new agent and Cursor capabilities shows how the line steps up at each launch.
Every agentic launch accelerates token usage
You can see the direct correlation between feature releases and token spikes in the chart below, where the vertical markers identify major agent and Composer capability rollouts.
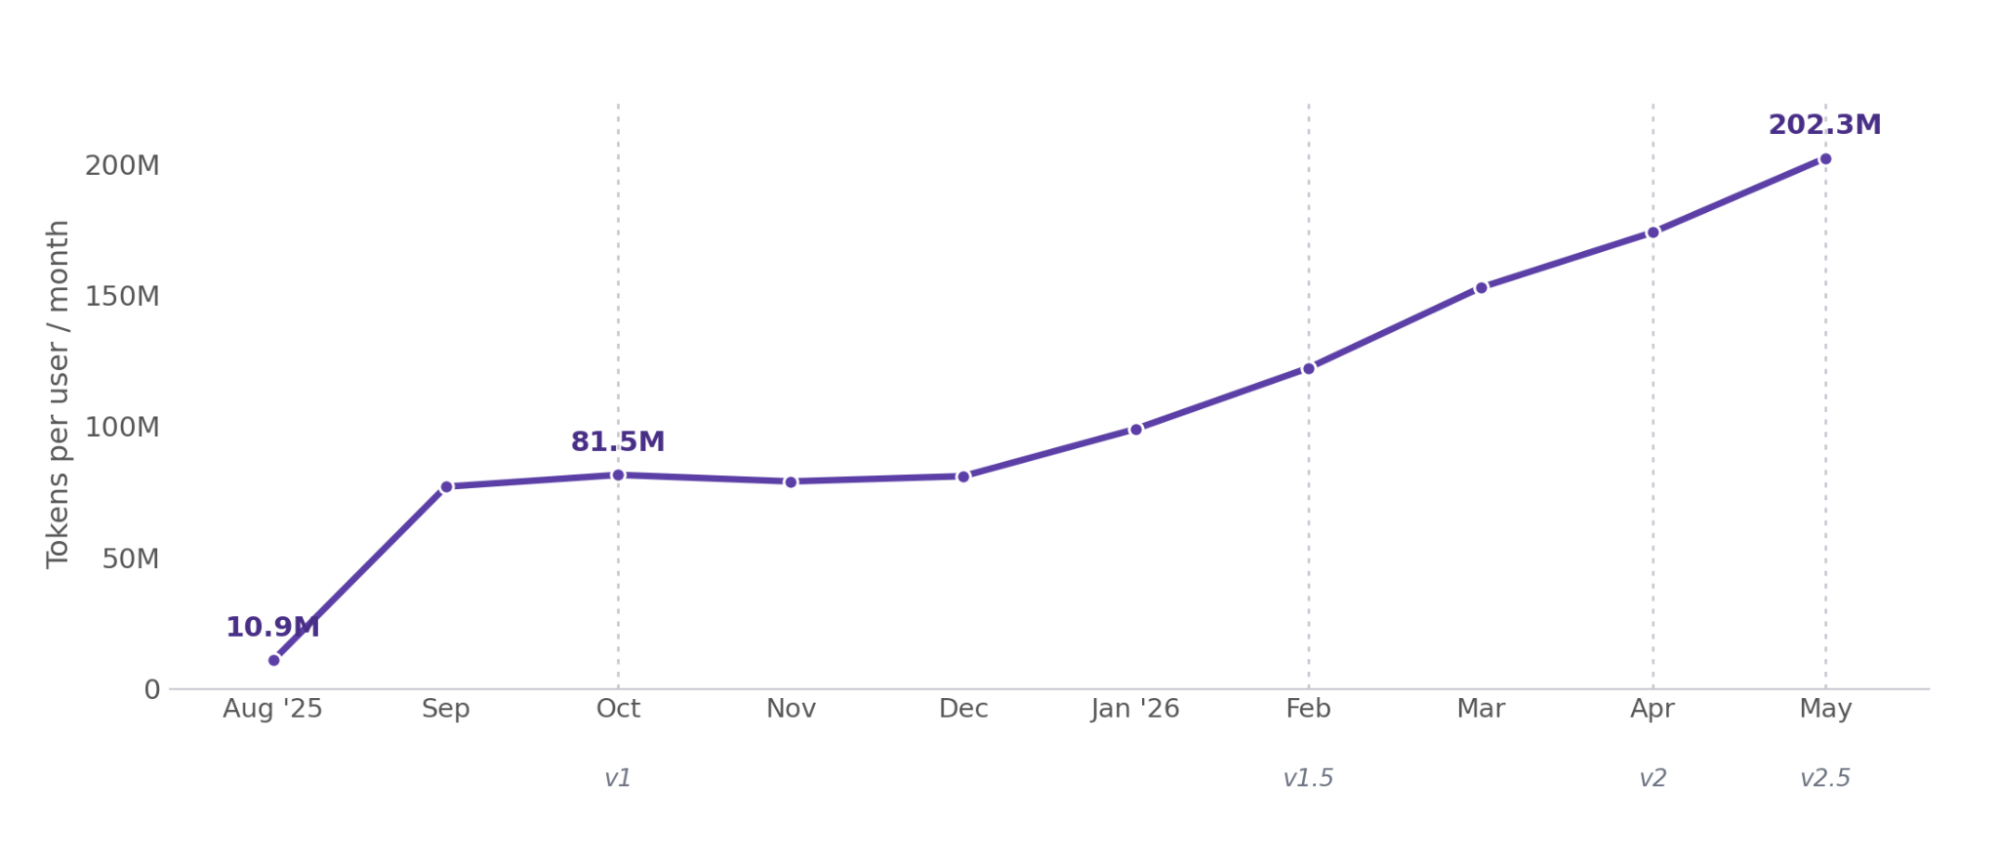
Figure 10. Per-user tokens and cost over time, with agent and Composer launches marked. Each release pushes both curves up.
The largest single jump came with the first native multi-agent release in August 2025: a 648% increase in tokens per user as parallel workflows switched on. Each release since has added another 25 to 50%. Across the full window, token consumption per user rose roughly eighteen-fold (see Reference Table 1 in the appendix).
The tools that we use are evolving, and evolving fast. This enables new use cases, with the promise of unlocking new levels of productivity, while at the same time increasing costs.
The Third Force: The Tool Reads More of Your Code
The first two forces are about price per token and new features. The third is about what each agent call actually does.
Tokens cached is driving increase in cost, driving the token bill
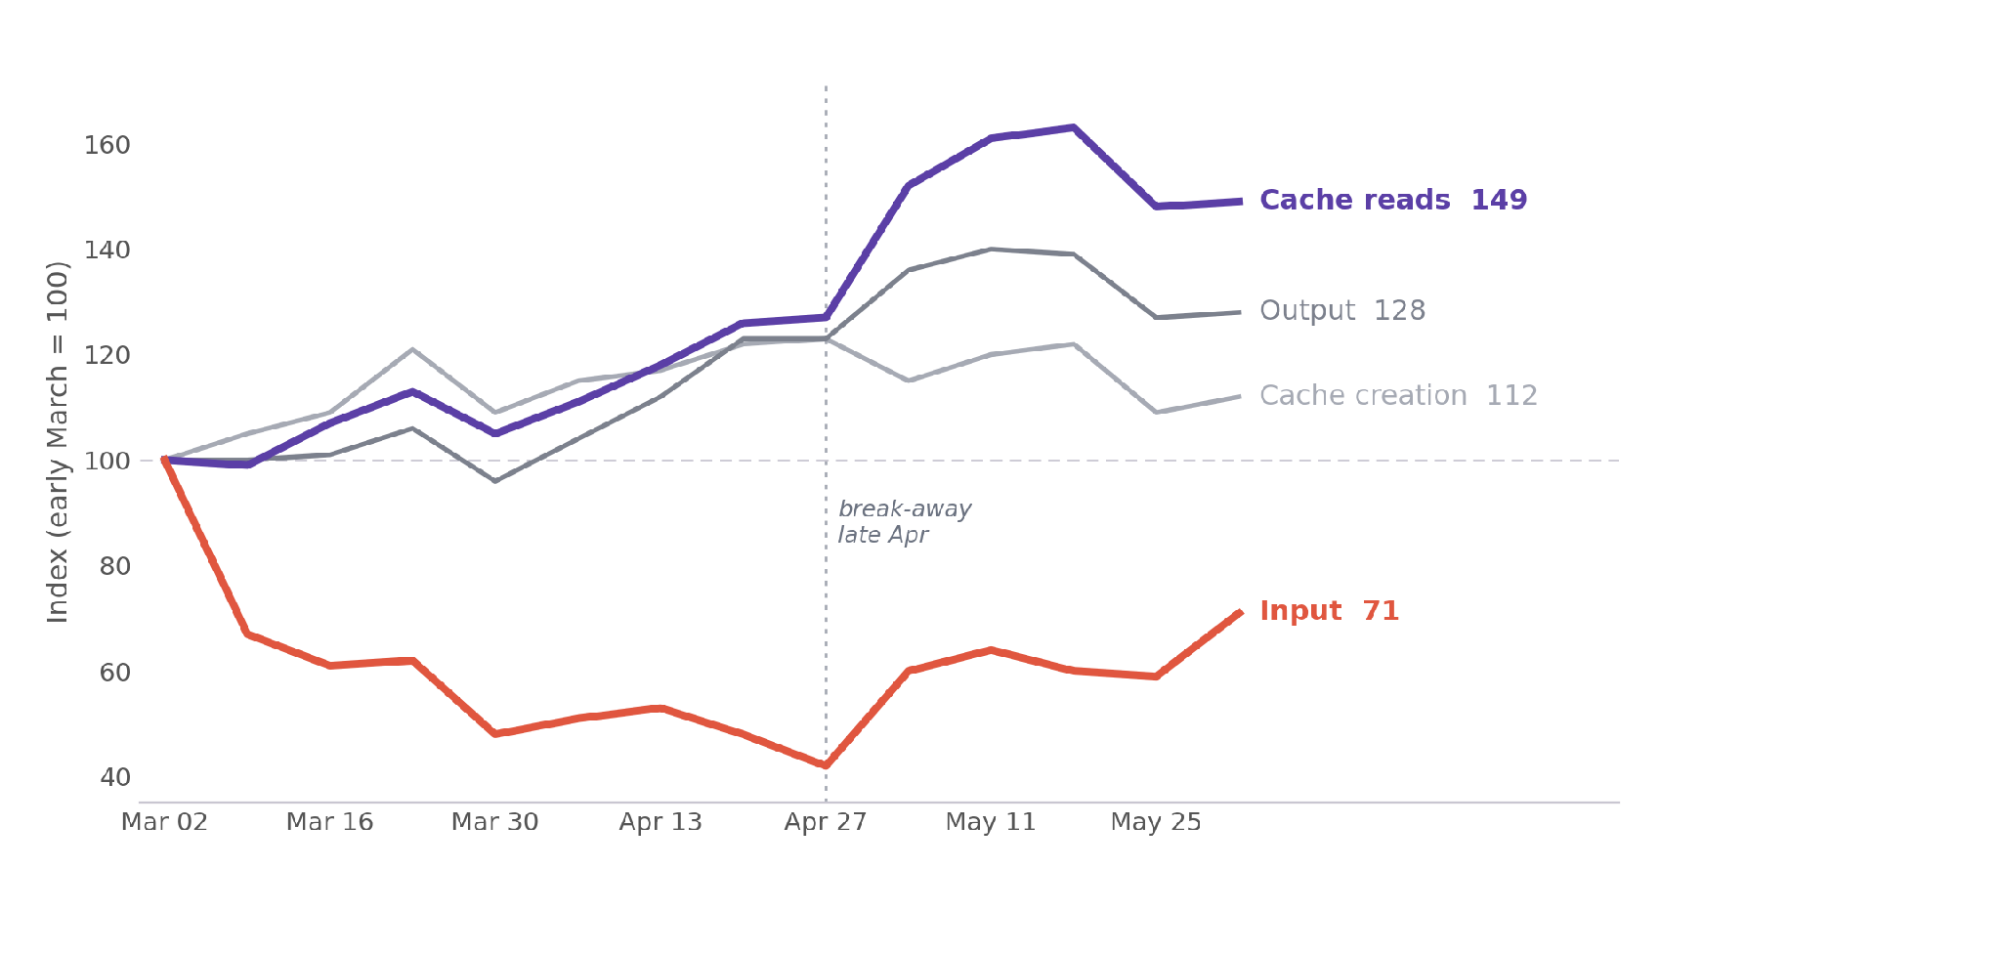
Figure 11. Weekly token volume by type, indexed to early March (=100). The four types moved together into April; around late April cache reads split off, ending at 149, while user input fell to 71.
Figure 11 shows the timing of that break-away, since April the cost of AI shifted from token output to cache reads. Cache reads, the platform automatically loading your repository into the model’s context before each edit, are 96% of all tokens. The code the model actually writes is 0.4%. So almost everything you spend tokens on is the agent reading your codebase, not generating changes. Cache reads are cheap per token, so by cost the split is less extreme but points the same way: cache reads and the cache writes that feed them are about 83% of the bill, against 16% for generated output.
The tokens spent rises because the tool reads more on your behalf, silently, to make better edits. We hypothesize that two primary factors that are driving the surge in cache-read volume:
- Context Engineering: Developers are proactively curating extensive context – such as custom rules and repository instructions – as a strategic effort to improve agent performance, which results in larger, more frequent cache loads.
- AI Loops: Users are increasingly utilizing autonomous agent loops that repeatedly reference the same codebase information, creating a multiplier effect on token consumption as the agent continuously re-evaluates the same context.
Why more tokens stop paying off
So we got to a point that new models and AI features will constantly be expanding token usage for harder tasks and new workflows that users will unlock. These are part of the journey we are seeing, and companies will need to create and budget around these “new realities” of spending tokens. But tokens spent can increase not only because of cost/token, but also because of user behavior and token ingestion, cache and output per task.
To see where extra tokens stop converting into merged PRs, we plotted output against token intensity across +300 companies. The gains are front-loaded: output jumps through the first quintile, then flattens, with only a slight uptick at the very top.
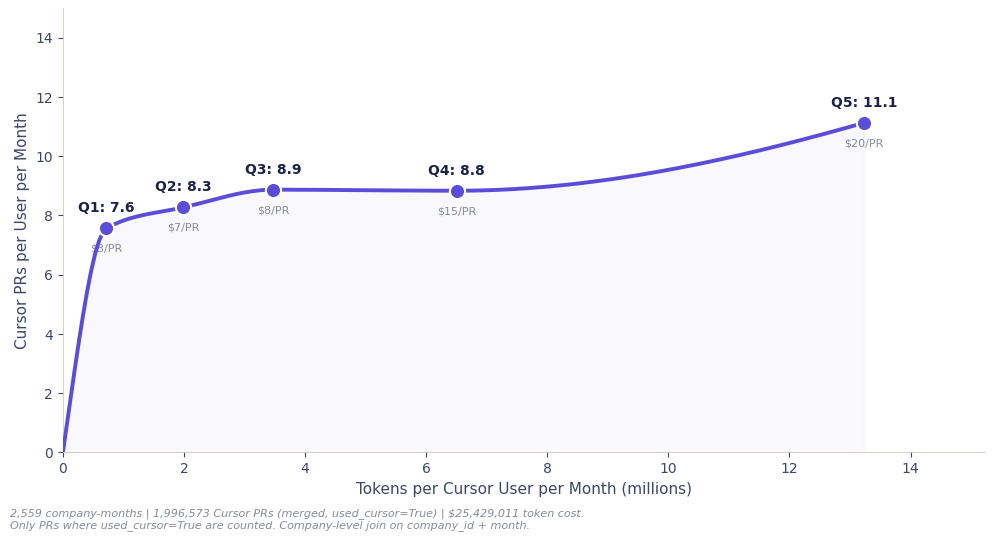
Figure 12. Cursor PRs per user against token intensity across 324 companies. Output jumps through Q1, flattens across the middle, ticks up again at Q5.
This shows two realities:
- New users spending a low amount of tokens, trying to learn how to use them and only having basic gains
- Heavy spenders see far smaller incremental gains, so the extra tokens largely stop translating into more merged PRs.
Users are climbing the hill to get incremental productivity gains, but companies see how the increase in cost starts to pile up a divergence not only between users, but also between employees and companies.
The first million tokens buys ~11 PRs – every million after buys almost none
To visualize this, Figure 13 breaks down the marginal return per extra million tokens across spend quintiles, highlighting where the returns actually turn negative.
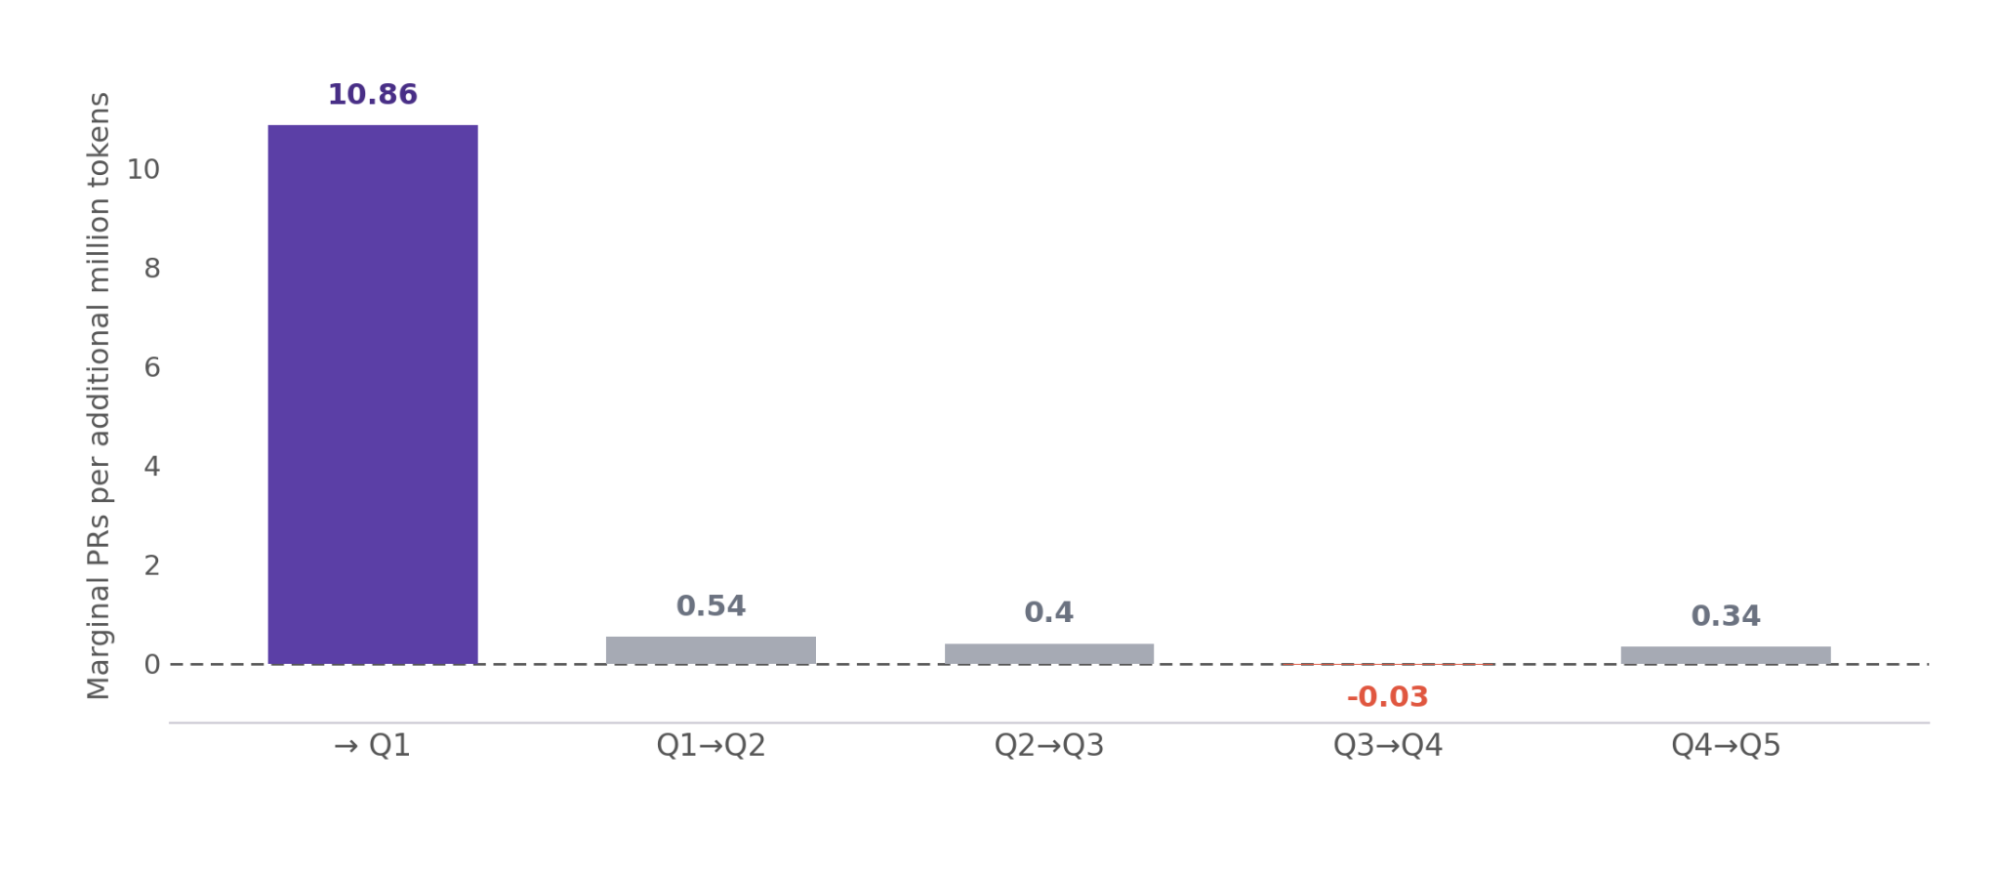
Figure 13. Marginal merged PRs per extra million tokens, between spend quintiles. The first million returns ~11 PRs per million; the Q3 to Q4 step is outright negative.
The first 0.7 million tokens return almost 11 PRs per million. Every step after returns well under one: the Q3 to Q4 step is briefly negative before a small rebound at the top, so past the first million, extra tokens buy almost no additional output.
To understand why diminishing returns are present we studied multiple hypotheses that we develop in the following section. We think that teams are facing a new process of reviewing AI code by agents but merge rate is affected by the trust on the produced output by agents.
The merge rate gap has been closed by agentic workflows
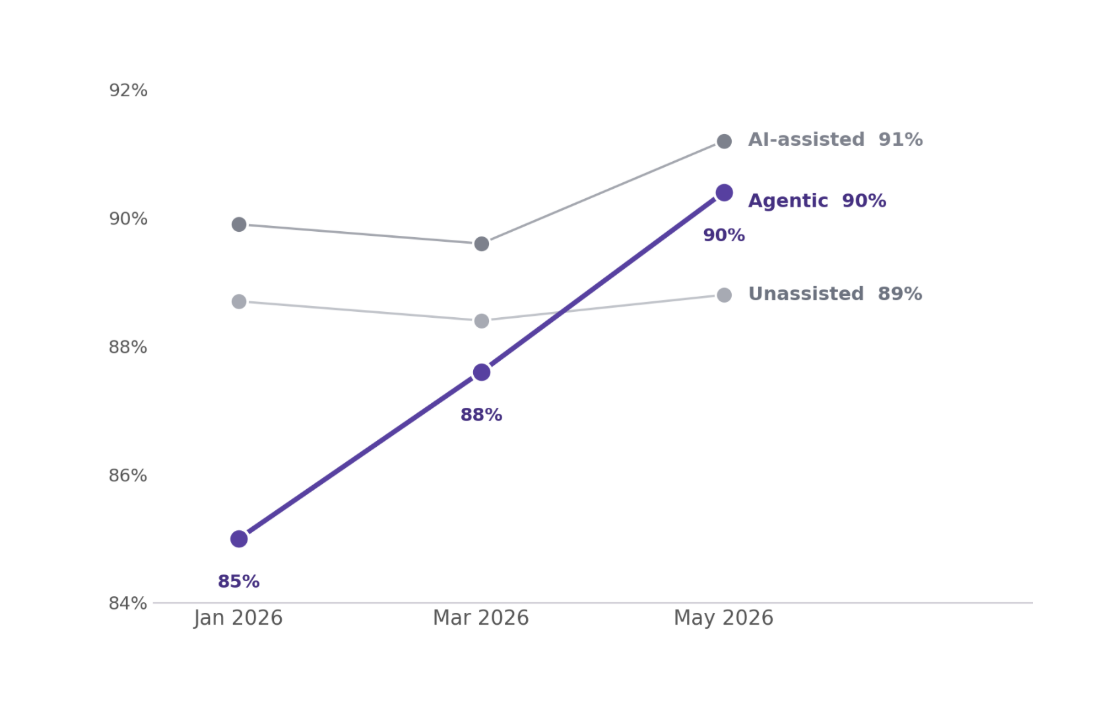
We divided PRs into three categories; Unassisted, AI-assisted and Agentic.
The first three months of 2026 showed how Agentic PRs, i.e. running Claude Code to create and merge a PR via an agentic workflow, were rejected and merged at slower rates than unassisted PRs.
We think this was because users were understanding how to run these new workflows, running a new setup and an initial mistrust with the output produced. But for the last 3 months we have seen models improving and more users understanding these tools – in consequence the “trust gap” has been closed and agentic PRs are on par with the merge rate we see for the rest of PRs. So, fully agentic workflows did partly affect H1 and is one reason we are seeing diminishing returns, but we believe there might still be other reasons that aren’t addressed in our data coverage.
Why returns diminish: three additional hypotheses
We suspect that there are multiple reasons this is true. Three explanations and hypotheses resonate most with what we are seeing in the industry:
- Metric Misalignment: When organizations treat tokens as a primary output metric, teams burn them simply because the burning gets rewarded. It creates a vanity metric where spend completely decouples from real-world outcomes.
- Prototype for Velocity: A growing share of agent activity is focused on prototyping, exploration, and throwaway tasks. This work is valuable for product iteration, but it’s essentially invisible under our success metric – merged PR counts.
- Scaling Overhead: Agent swarms aren’t magically efficient. Just like human organizations, adding more agents creates nonlinear coordination friction that eats into the productivity gains you’d expect. Issues such as scaling, orchestration, concurrency and autonomy affect throughput.
Optimal token usage on value creation
Deciding how many tokens to allocate can be defined depending on the return and value created at a PR level. How much revenue each merged PR generates decides which of two goals you optimize for:
- Value creation
- Return on investment (ROI)
Value Creation is defined as: Net value per user = (Revenue per PR − Cost per PR) × PRs produced per user
The higher the revenue per PR, the easier it is to justify heavy spend because more value is created.
For a given revenue per merged PR, the return on token spend can be written as:
ROI = (Revenue per PR − Cost per PR) / Cost per PR
Using these equations we developed a sensitivity analysis to understand how these curves behave under different scenarios and how companies should think on optimizing their token allocation.
Spend heavily when a PR drives at least $100 in revenue
Fig. 14 shows how tokenmaxxing on low-revenue PRs turns value creation negative(red line), which helps explain why some companies are now retreating from burning tokens indiscriminately. It also reveals the 6.5M-token band (Q4) as a dead spot where value created drops: for most revenue levels you are better off spending fewer tokens, and heavier spend starts to pay off once a PR clears roughly $69, comfortably so by $100, where heavy spend (Q5) clearly wins.
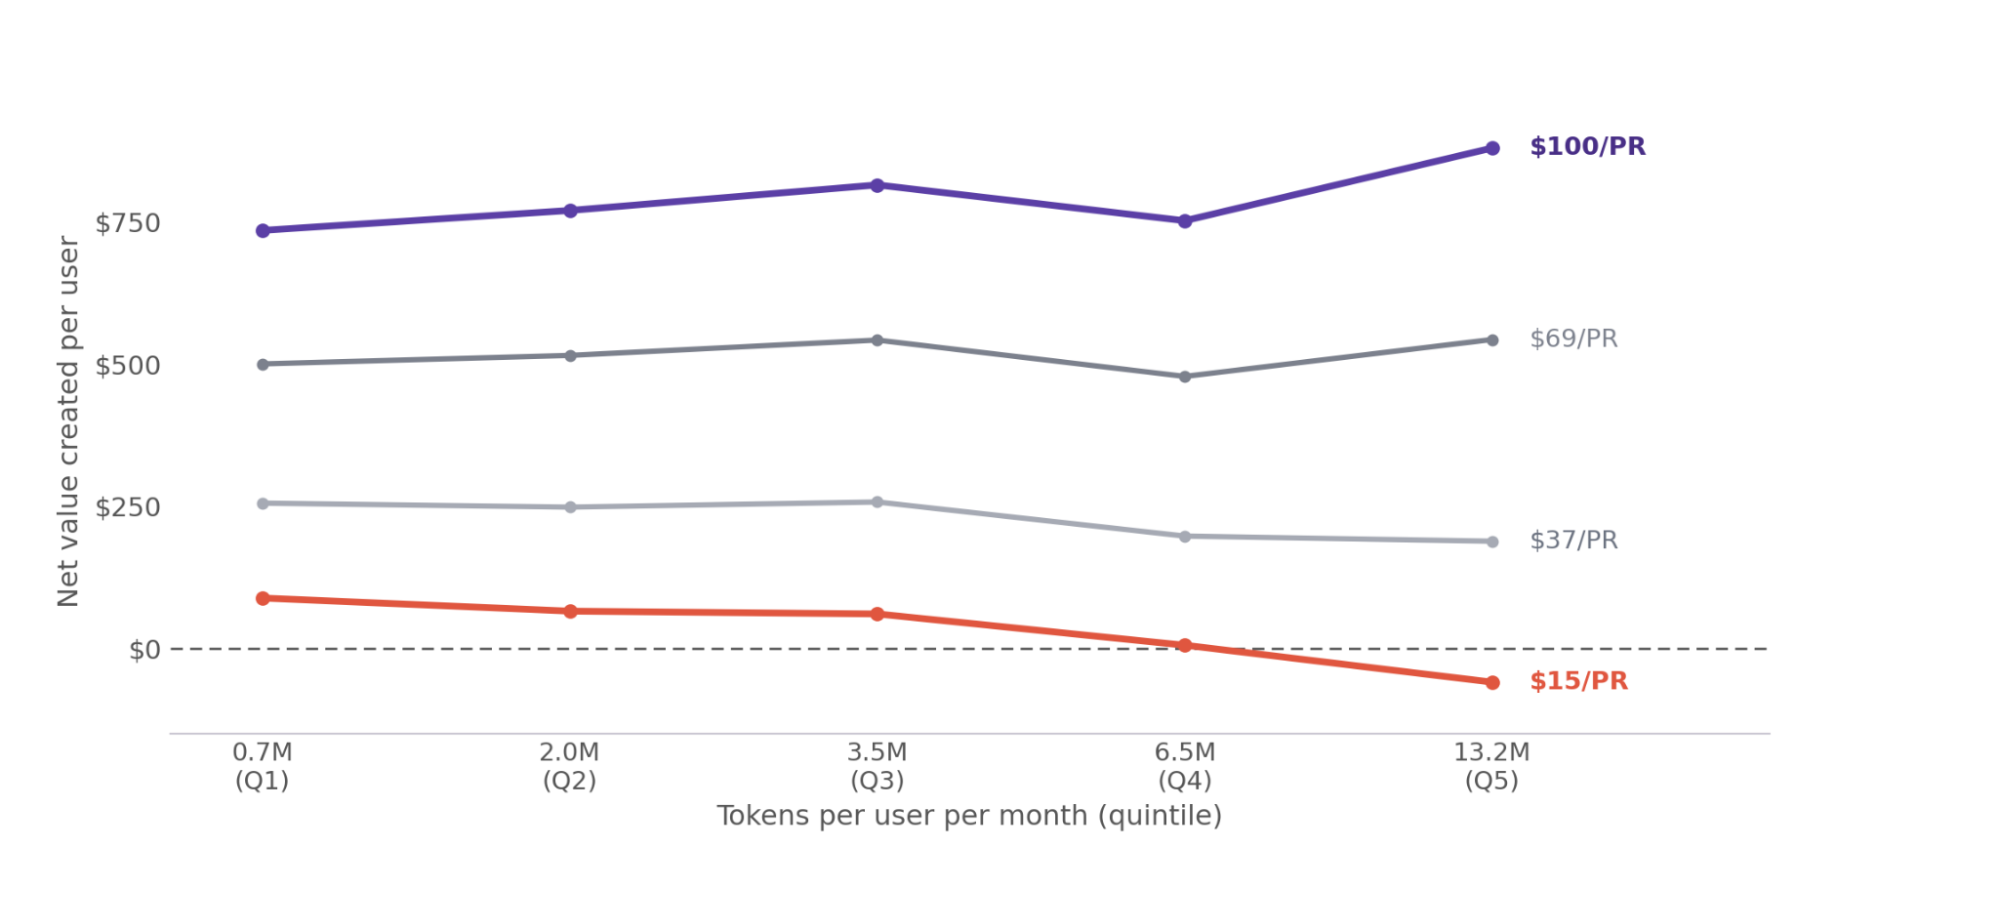
Figure 14. Net value created per user by token-intensity quintile at four revenue-per-PR levels. The optimum migrates right as revenue rises, Q1 below $37, Q3 between $37 and $69, and Q5 above $69, and at $15/PR, tokenmaxxing (Q5) drives net value below zero.
The following chart shows the ROI curves for different revenue levels
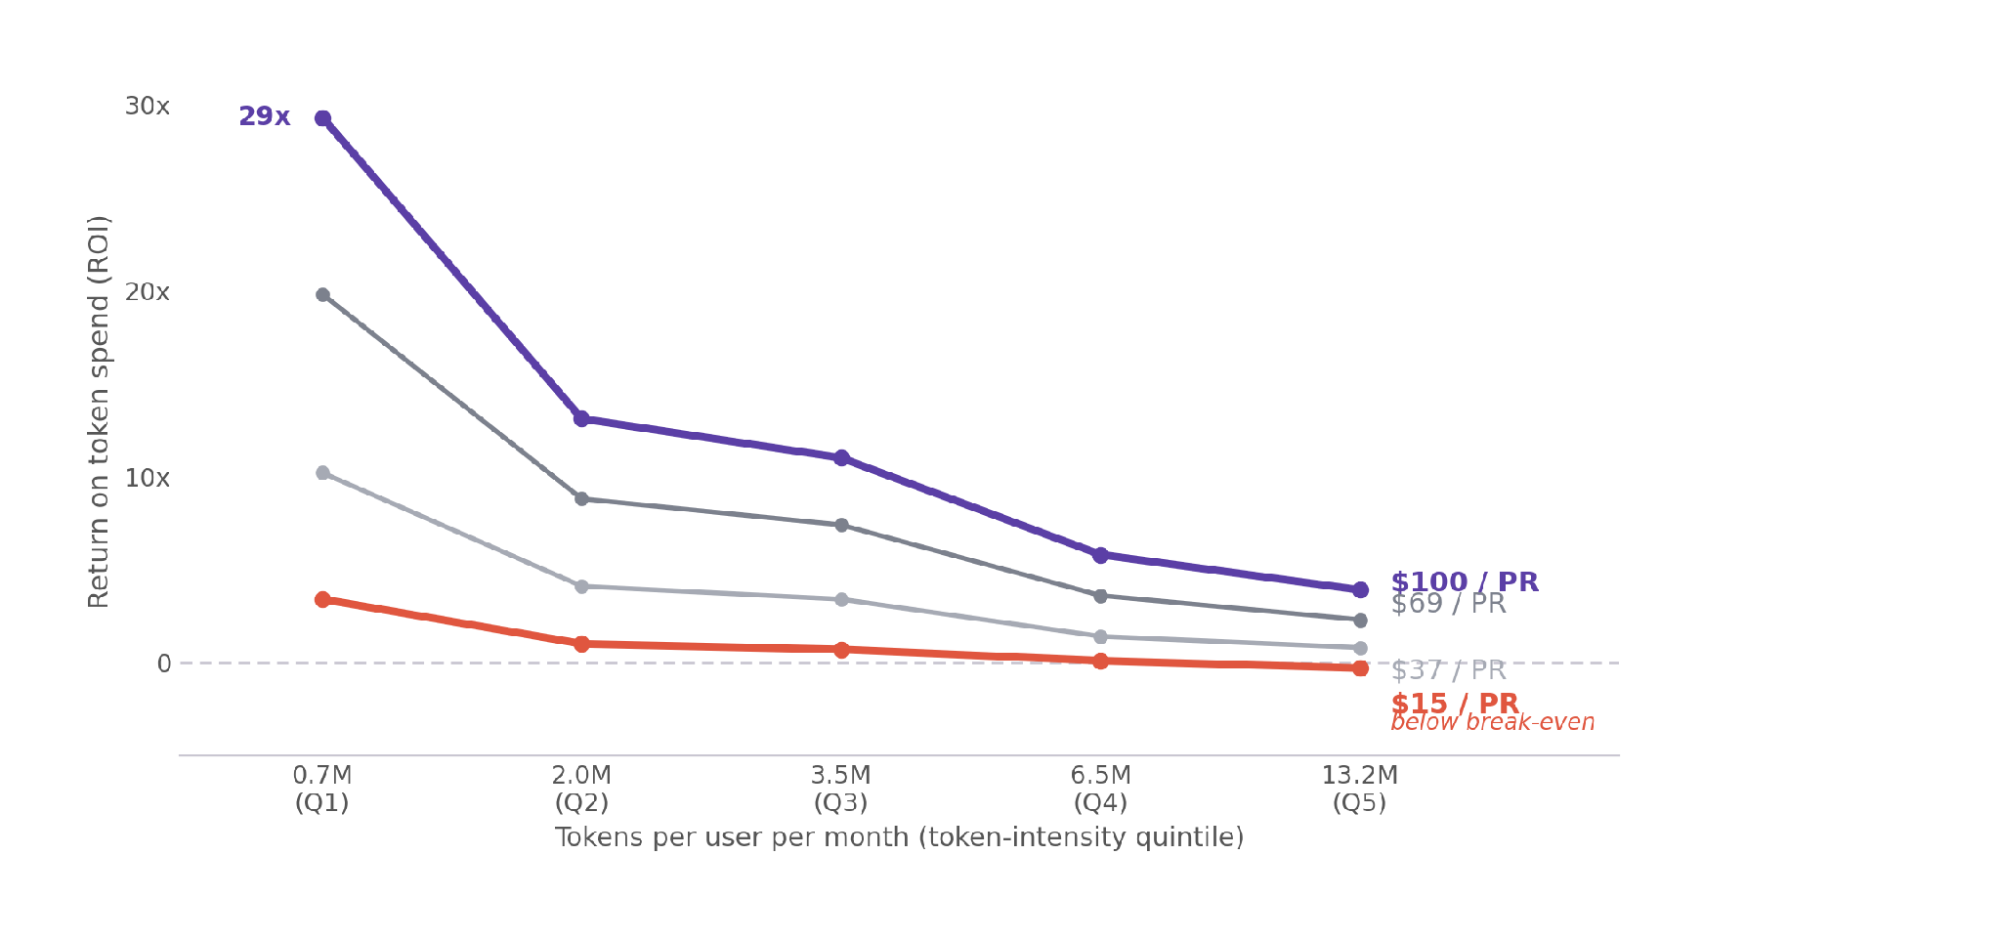
Figure 15. The same data as Figure 14, read as ROI = (revenue − cost) / cost. Return collapses as token intensity rises; only PRs worth about $69 to $100 keep heavy spend clearly above break-even. At $15 per PR, the heaviest quintile falls below break-even.
So tokens only pay off where a PR clears real revenue, when running agents for velocity like prototyping or getting fast answers with no revenue linked avoiding tokenmaxxing will provide the highest ROI.
In conclusion, we have seen how improvements in the AI development ecosystem is driving more usage of tokens, most of these tokens are being used as cache to provide context to coding agents. We have seen how spending tokens (aka tokenmaxxing) isn’t always the right strategy because we are seeing diminishing returns after the 2M of tokens per user per month.
Finally we discovered how companies optimize for value creation or ROI depends ultimately on the level of revenue generated and allocating the right amount of tokens to hit the right level of productivity.
Part 3: The Harness Advantage
Part 3: The Harness Advantage
What to invest in instead of token spend.
If raw spend has a ceiling, the gains come from the system around the model. This section looks at what leading teams invest in instead, context and codebase architecture, and how steeply those returns compound.
Since tokens per user show diminishing returns against productivity, becoming token-efficient is a rational move, especially when the workflows consuming the most tokens are not driving enough revenue to justify the spend.
In this section we studied two ways companies can think of optimizing agentic systems:
The first is context, since agents act as “new junior employees”. It is smart to provide context and onboard an agent as an employee would be. In 2025, “context engineering” emerged as the trend for optimizing context, and we have seen patterns that validate higher levels of productivity when this is done correctly, proving out the phrase “context is king”
Context is the New King
Time spent shaping what the agent sees (CLAUDE.md files, Cursor rules, custom prompts) tracks directly with throughput, and the payoff accelerates rather than fades.
Teams who invest lightly here gain about 0.7 extra merged PRs a week; the middle band gain 1.1; the heaviest investors gain 2.3. Each doubling of context investment buys roughly 29% more PRs per developer per week. More context means more input tokens, but developers teaching their AI tools are shipping meaningfully more code. The teams treating it as a repeating practice are pulling away from those treating it as a one-time setup.
More context investment, more merged PRs
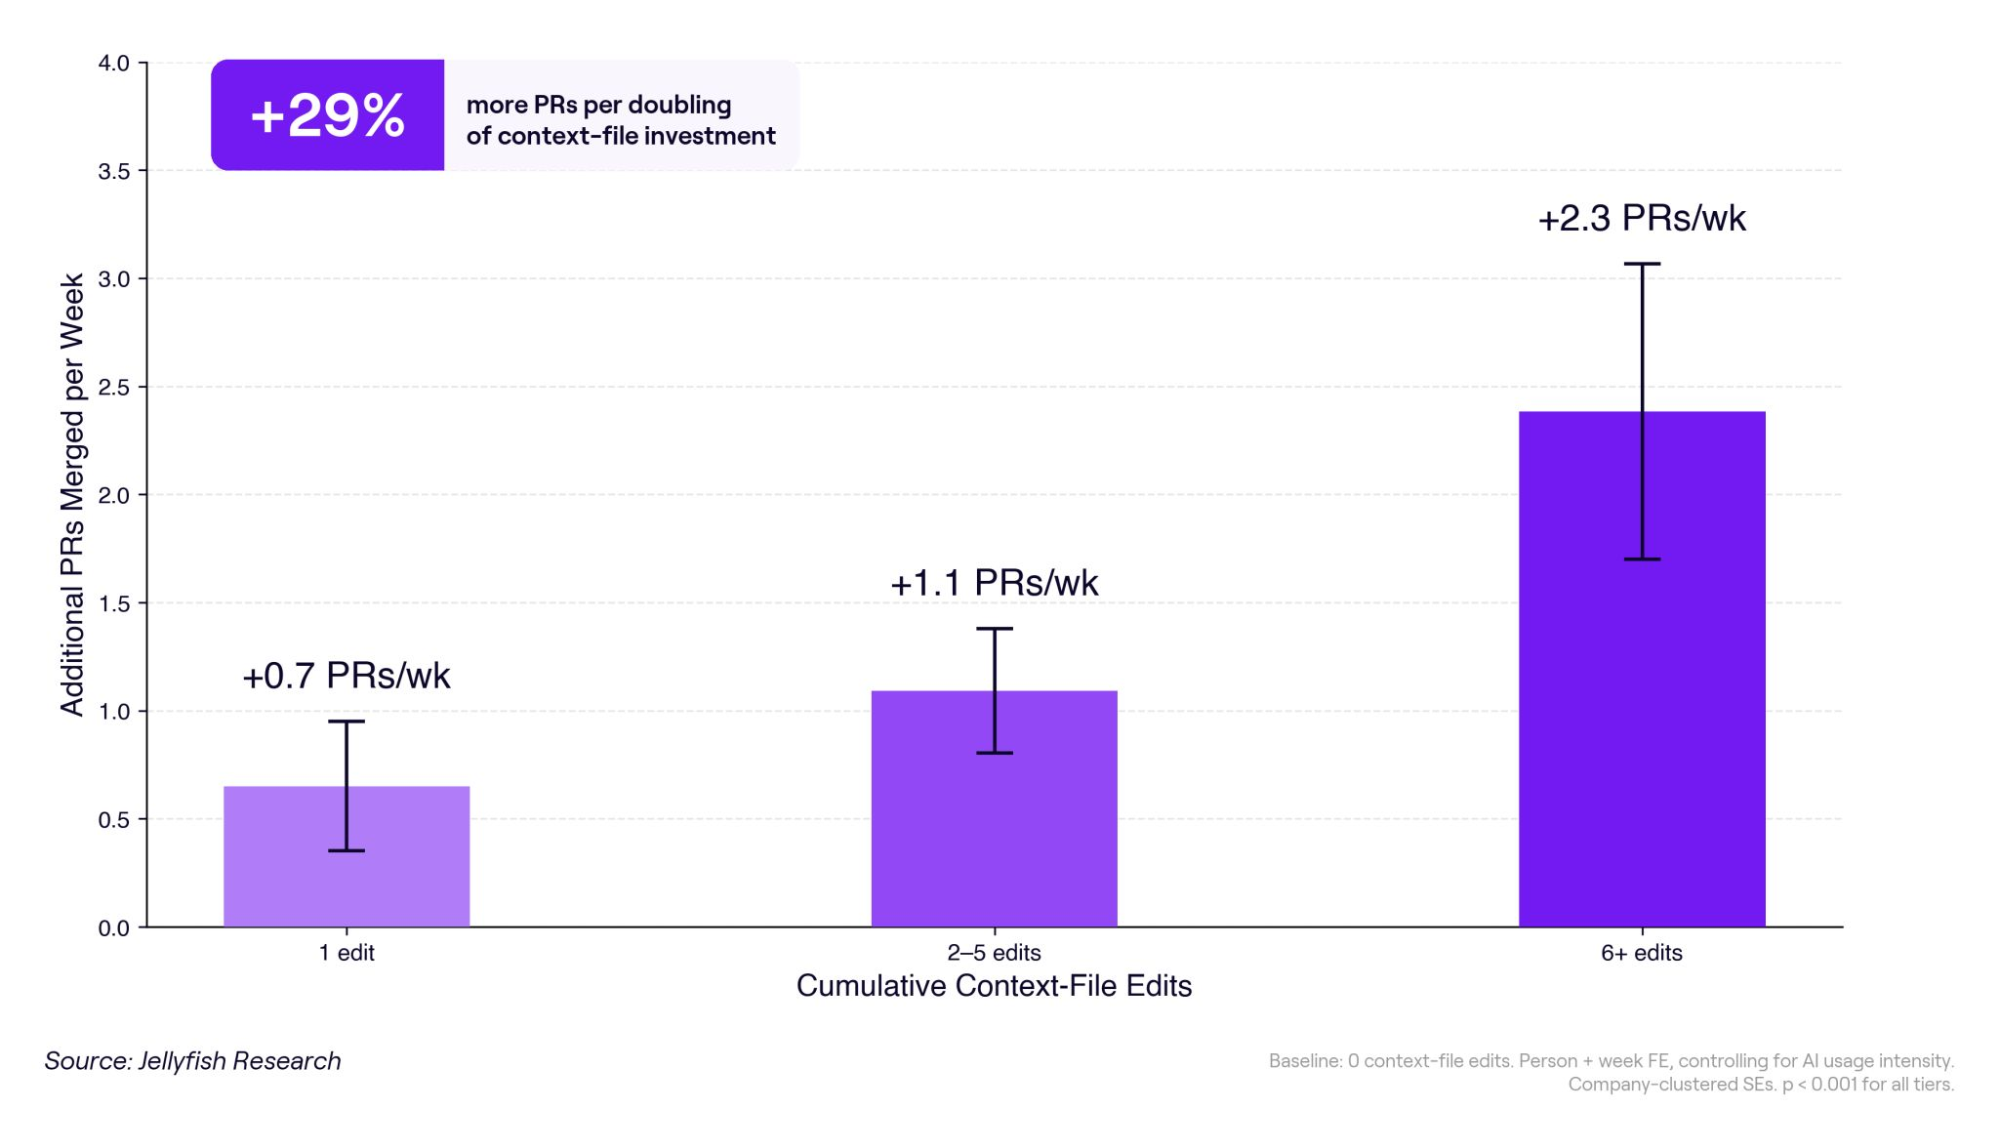
Figure 16. Additional merged PRs per week by cumulative context-file investment. Returns hold up across tiers rather than flattening, with wide confidence intervals at the top.
A new discipline has emerged around the context that is fed into the agent, agent harnessing. It refers to not only feeding context to the agent, but to the right environment for the agent to thrive. This includes the set of tools the agent has access to, the loops, the evals, and the codebase. All of these affect the levels of productivity an agent can deliver. There is no one “easy recipe”, rather, the key is creating the system by thinking in an “AI-first world”, not in a “human-first” one. With this in mind, we looked into the structures of codebases to understand which attributes most benefit agentic coding.
Agentic Codebases
The design of modern codebases was originally optimized for human navigation and pre-ai era. To determine if these architectures require adaptation for agentic workflows, we categorized repositories into four distinct tiers, ranging from highly centralized to deeply fragmented (per-engineer) environments. By mapping PR throughput against AI adoption rates across these groups, we found that centralized and balanced architectures yielded the highest returns, at approximately 4x. Conversely, productivity gains diminish as code becomes more distributed, with the most fragmented setups falling to a 0.9x return, where AI usage actually correlates with a marginal decrease in overall throughput.
AI pays off in centralized and balanced codebases, and backfires in fragmented ones
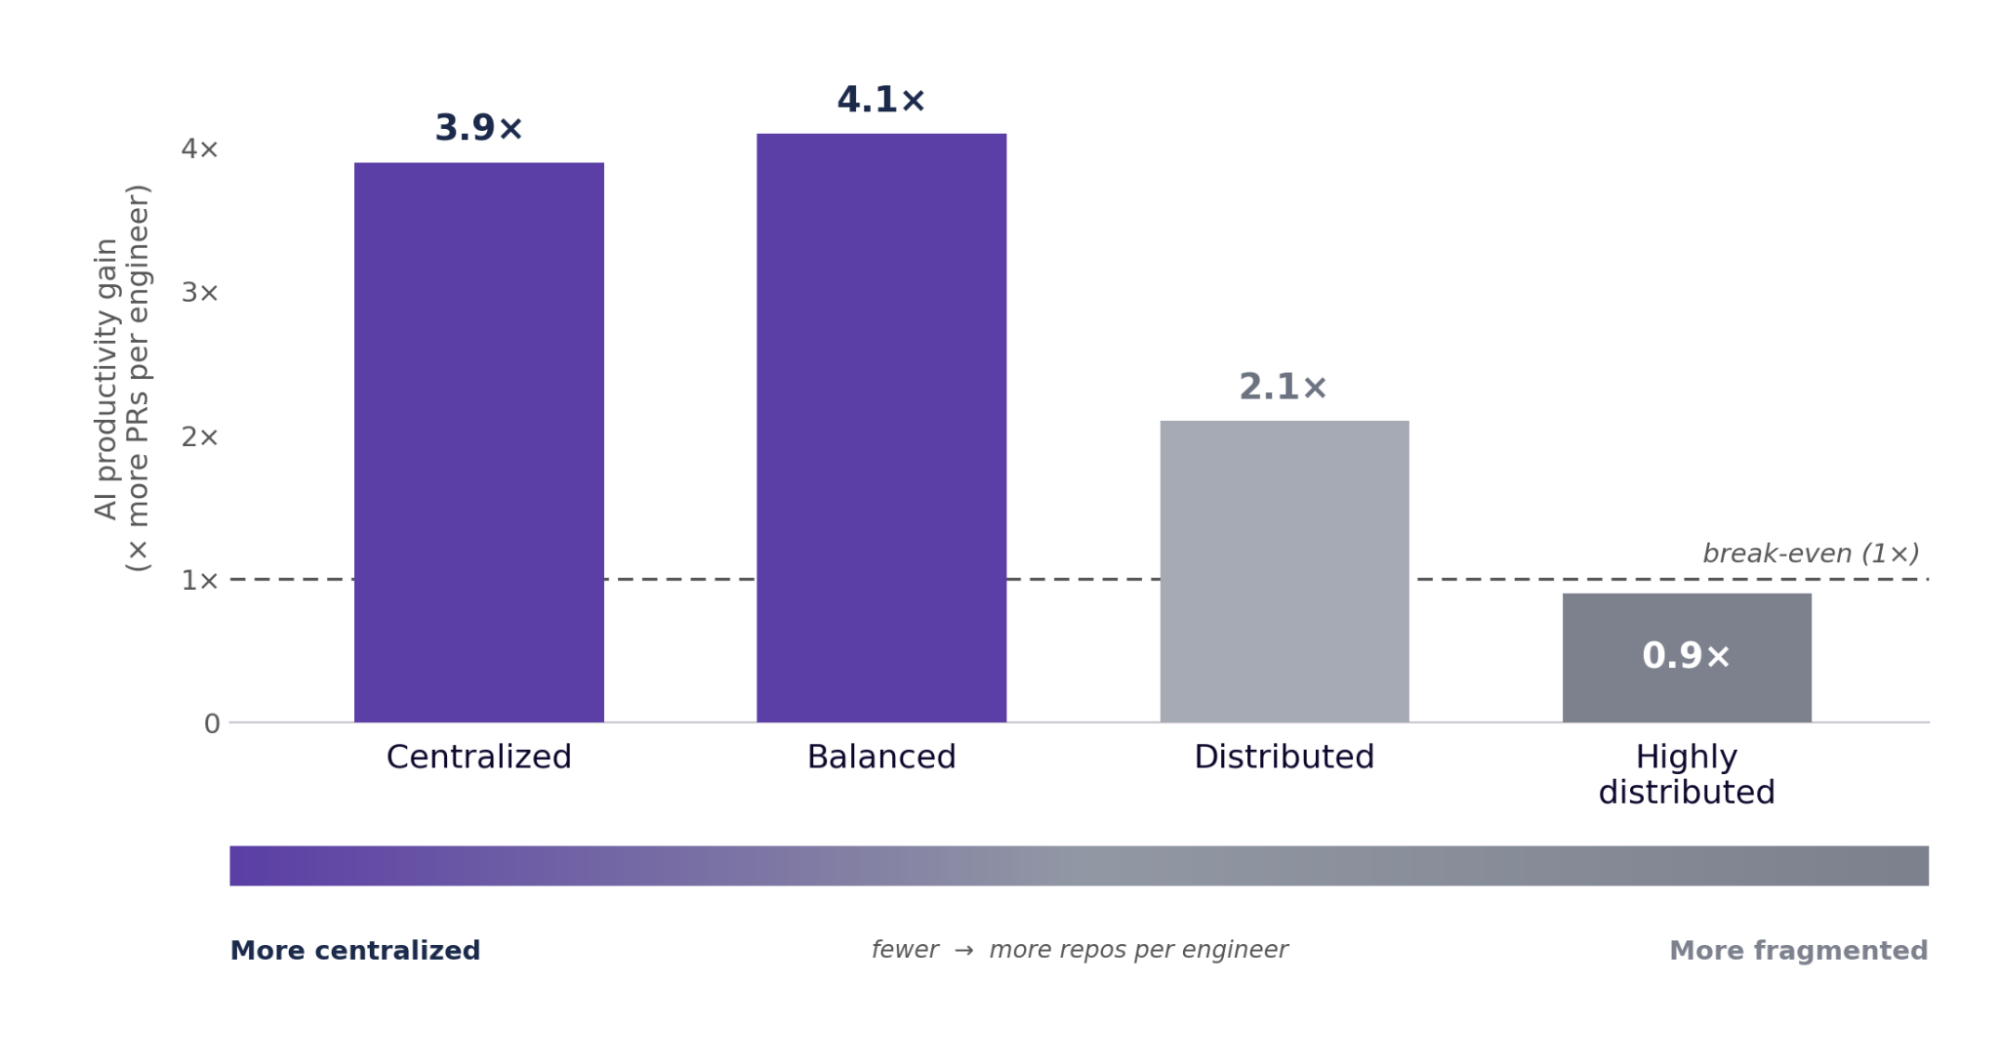
Figure 17. PR throughput against AI adoption across four architecture buckets. The gain peaks in balanced and centralized codebases (about 4x), falls as repositories fragment, and reverses below break-even in the most distributed ones.
Agents do better when the code they work in is consolidated: they can find what they need and follow one set of conventions. Fragmentation takes that away, agents need more time to map entire codebases that are fragmented and understand the connections rather than when this is centralized in a single place.
H2 Recommendations
H2 Recommendations: Putting it to Work
- Budget tokens by the revenue the work carries: Figure 14 gives a thumb rule: heavy spend only pays once a PR clears roughly $69, comfortably so by $100. Treat tokens as a budget allocated across cohorts by the revenue each cohort’s output carries, not as a flat per-seat allowance. High-value product work earns the right to tokenmax; low-stakes or throwaway work does not.
- Invest in context as a standing practice, not a one-time setup: Each doubling of context investment returned about 29% more merged PRs per developer per week, and the gains held up rather than flattening across tiers (Figure 16). Make CLAUDE.md files, Cursor rules, and prompt libraries living artifacts that teams revisit, and measure context investment the way you measure test coverage.
- Consolidate the codebase; avoid fragmenting it for agents: AI adoption converted to throughput best in balanced and centralized codebases (around 4x) and reversed in the most fragmented ones, bottoming at 0.9x (Figure 17). The goal is not maximal centralization so much as not fragmenting: before splitting a repo for human convenience, weigh the agent-throughput cost. A consolidated codebase gives agents one place to look and one set of conventions to follow.
- Cut effective cost at the format and harness layer: Because effective cost rises even when sticker prices hold (Figures 5 to 8), the savings live in how you feed and run the agent. Format-level moves like switching to TOON in the Jellyfish MCP cut token counts on the same workload; extended-thinking budgets and cost-per-task instrumentation let finance see the wedge between headline price and effective cost.
Closing
Closing: What H1 Tells Us about H2
- The autonomy gap is the metric to watch. The 90th-percentile share of autonomous PRs roughly doubled in a single quarter while the median held still. The question for H2 is whether the median can close any of that distance or whether the curve keeps separating. The answer will come from operational practice more than from model releases: review workflow, test infrastructure, and context investment.
- Agentic harnessing will keep expanding and improving agent performance. We have studied how context and agentic codebases affect productivity once tools are adopted. The environment around the agent can still improve substantially, and what limits results now is how well that environment is built, not the model itself. Memory and creation inside AI loops are new trends that will affect how the AI-SDLC evolves.
- The wedge between headline price and effective cost will keep widening, and finance will need new instrumentation to track it. Token budgeting, allocating a scarce resource across cohorts by the revenue each cohort’s output carries, is turning into a finance discipline of its own.
- Industry will keep evolving to an “agentic first” environment. The industry will keep building solutions that think of agents first. We expect to see more solutions addressing concurrency, autonomy and innovation in codebases (i.e: Gitlab for agents).
Appendix
Appendix: Sources & Methods
Part 1: The Cost Shock: Explosion of intelligence
- Let the agent cook: AI agent autonomy May 2026 · 18M+ Claude Code turns.
- AI Engineering Trends, autonomous agent activity April & May 2026 updates · 37M PRs.
- The agentic barrier: measuring AI agent concurrency April 2026.
- AI IDEs or autonomous agents? (Carnegie Mellon) Agarwal, He, Vasilescu · arXiv:2501.13597 · AIDev dataset, matched controls.
Part 2: Cost Mechanics and Diminishing Returns
- The Opus 4.7 tokenizer tax May 2026 · 17,331 users, 289 companies.
- Price per token vs. effective cost May 2026.
- Tokeneconomics: unit economics, usage, and budgeting June 2026 · proprietary dataset + Cursor usage API. Source of Figures 7 to 11 and Tables 1 to 4.
- PR throughput and token use by usage decile May 2026 · 7,548 engineers.
- The token tax: switching to TOON in the Jellyfish MCP December 2025.
Part 3: Context, Codebases, Recommendations
- More context-file investment = more code shipped May 2026 · 134,911 developers, 670 companies.
- Weekly lines of code added per person, by AI tool March 2026.
- AI productivity gains vary by code architecture April 2026 · 9,602 company-weeks.
- Companies with higher AI use push larger PRs April 2026 · 13,048 company-weeks.
Additional Research: Blindspots of automation
- How much did your bug backlog grow last quarter? March 2026 · 538 companies, Q4 2025.
- Measuring ROI in the AI era: the language effect February 2026.
- Suggestion acceptance rate by tool: a year in four lines May 2026.
Table 1: Per-user tokens and monthly cost across agent and Composer releases.
Download this report
The State of AI
Get this report sent to your inbox to save or share with your team.