In this article
Metric selection is a common problem for engineering teams. In LeadDev’s Engineering Team Performance Report 2026, 57% of respondents who report on team performance called it a challenge, and 25% named it their single biggest obstacle.
Most teams can measure almost anything, from code review speed to incident counts, but few of those numbers say much about business results on their own.
The 26 KPIs below give you a list to choose from. Each one comes with a definition, measurement steps, and a worked example, so you can judge whether it fits your team’s goals before you add it to an engineering KPI dashboard.
What Are Engineering KPIs?
What Are Engineering KPIs?
Software engineering KPIs (key performance indicators) are measurable values used to track and evaluate the performance and effectiveness of engineering teams and their work. They show how well a team is meeting its goals and where it has room to improve.
KPIs and metrics overlap, but they serve different purposes. A metric describes engineering work, while a KPI tracks progress toward a goal. Deployment frequency, for example, becomes a KPI once the team aims to release more often.
What they measure:
- Efficiency: How well the team uses its time and resources (e.g., time to complete tasks, resource allocation).
- Quality: How well the software works and how easy the code is to maintain (e.g., defect rate, code coverage).
- Reliability: How stable systems are in production and how quickly the team recovers when something breaks (e.g., mean time to recovery, average downtime).
- Cost: The financial performance of engineering activities (e.g., project costs, Cost Performance Index).
- Delivery: How quickly and consistently the team ships work and meets its commitments (e.g., deployment frequency, project completion rate).
- Customer satisfaction: How customers rate the product and the features the team ships (e.g., CSAT).
- Developer experience: How engineers feel about their tools, processes, and workload (e.g., developer satisfaction surveys).
Each of the 26 KPIs later in this guide fits into at least one of these areas, and several fit into more than one. Change failure rate, for example, measures both quality and reliability.
Types of Engineering KPIs
Types of Engineering KPIs
Engineering KPIs are usually grouped into the types below:
- Quantitative KPIs: Numeric measures pulled from engineering tools and systems, such as cycle time, defect rate, and deployment frequency. They give objective data that’s easy to compare over time.
- Qualitative KPIs: Descriptive measures based on opinions and experience, usually collected through surveys, interviews, or code review feedback. Team morale and perceived code quality are common examples. Survey scores such as CSAT put a number on qualitative input, so the line between the two types can blur.
- Leading indicators: KPIs that change before the outcome you want to influence, so they give early signs of trends and potential problems. Effort allocation and code complexity are common examples.
- Lagging indicators: KPIs that measure results after the work is done, such as cycle time, defect rate, and customer churn. They confirm whether earlier decisions paid off.
These types aren’t mutually exclusive. Quantitative and qualitative refer to how a KPI is measured, with numbers or with feedback. Leading and lagging refer to whether it signals problems early or confirms results after the fact.
Most KPIs carry one label from each pair, so cycle time, for example, is both quantitative and lagging. The leading or lagging label can also change with the goal, since a steady increase in cycle time can be an early sign of missed release dates.
Example → A software team is three sprints into a new feature, and the work is falling behind schedule. The team notices the problem in cycle time and defect rate, which are both quantitative and lagging. Average cycle time has gone up over recent sprints, and more bugs appear in the new feature after each sprint.
To find the cause, the team checks its leading KPIs:
- Effort allocation (quantitative, leading): Developers spend more time on bugs than on new feature work.
- Code complexity (quantitative, leading): Code analysis shows the new feature’s code is more complex than the team’s usual standard.
- Code review feedback (qualitative, leading): Senior developers point out that the new code is getting harder to read.
Together, these point to a likely cause. The new code is more complex than usual, so bugs take longer to resolve, and that extra bug work takes time away from the feature. Cycle time and defect rate alone would only confirm the delay, while the leading KPIs show the team where to look first.
10 KPIs Every Engineering Leader Should Track
Get eBook26 KPIs and Metrics Engineering Managers Should Consider Tracking
26 KPIs and Metrics Engineering Managers Should Consider Tracking
The engineering KPI examples below cover all seven areas above, from efficiency and delivery to developer experience.
1. Cycle Time
What it is: The total time it takes to complete a piece of work, from the moment the team starts on it until it’s done. Cycle time begins when work starts, so it leaves out the time a request waits in the backlog.
Why it matters: A shorter cycle time generally means a more efficient process. Changes over time also show bottlenecks in specific stages of your workflow, such as slow code reviews or long QA queues.
How to measure it: Track the time from when work starts (e.g., when a ticket moves to “In Progress”) to when it’s done. To see where time goes, break the total into stages such as design, development, testing, and deployment.
Example: If a team takes 2 days to design a feature, 5 days to develop it, 2 days to test it, and 1 day to deploy it, the cycle time for that feature is 10 days.
2. Effort Allocation
What it is: The breakdown of where your team spends its time and resources, split by type of work such as new features, bugs, technical debt, and support requests.
Why it matters: Shows whether the team’s effort matches its priorities. A large share of unplanned work, such as urgent bugs, often means less time for strategic initiatives.
How to measure it: You can use a software engineering intelligence platform like Jellyfish to see where effort goes across work categories, product lines, and initiatives. The data comes from tools your team already uses, so engineers don’t have to log their time.
Example: A team might discover it spends 40% of its time on bugs, 30% on new features, and 30% on technical debt and support. That mix is a reason to look at why bugs take up so much time and whether the current balance matches the team’s priorities.
3. Deployment Frequency
What it is: How often you successfully release code to production (or to users).
Why it matters: Frequent deployments usually mean smaller changes in each release, which are easier to test and roll back. Features and fixes also reach users sooner, so the team gets feedback faster.
How to measure it: Count successful production deployments over a set period, such as a day, week, or month. Most CI/CD tools log each deployment, so you can pull the count straight from your pipeline.
Example: If a team completes 40 successful production deployments in a four-week month, its deployment frequency is 10 deployments per week, or about two per working day.
4. Lead Time for Changes
What it is: The time it takes for a committed code change to reach production. DORA now calls this metric change lead time. It’s narrower than the broader lead time some teams measure, which starts when a request or idea first comes in.
Why it matters: Shorter lead times mean you can respond to customer needs and market changes more quickly. This metric also shows how efficient your review, testing, and deployment pipeline is.
How to measure it: Track the time between each commit and the deployment that puts it into production, then take the median or average across all changes in a period.
Example: If a developer commits a change on Monday morning and it’s deployed to production on Wednesday morning, the lead time for that change is 2 days.
5. Defect Rate
What it is: The number of defects found in your software relative to a consistent unit, such as lines of code, features, or completed work items.
Why it matters: Every bug that reaches users takes time to investigate and resolve, and some cost the company customers. A low rate frees engineering time for new work and protects customer trust.
How to measure it: Count the defects found during testing or reported by users, then divide by the same unit every time so you can compare results across periods.
Example: If QA finds 10 bugs in 1,000 lines of new code, the defect rate is 10 defects per thousand lines of code (KLOC). This version of the metric is also called defect density.
6. Cumulative Flow
What it is: A visual representation of the work items (e.g., user stories, tasks) in your workflow over time. It shows how work moves through different stages (to do, in progress, done).
Why it matters: Helps visualize bottlenecks, monitor work in progress (WIP) against your limits, and understand the overall flow of work through your system.
How to measure it: Use a cumulative flow diagram, which is a stacked area chart that shows the number of items in each stage of your workflow over time.
Example: If the “testing” band on a cumulative flow diagram keeps getting wider, items are entering testing faster than they leave it, which means testing has become a bottleneck.
7. Mean Time to Recovery (MTTR)
What it is: How long, on average, it takes to get a system working again after a failure or outage. DORA tracks a narrower version called failed deployment recovery time, which looks only at failures caused by a deployment.
Why it matters: Quick recovery keeps the damage from each incident small. Users see shorter disruptions, and engineers spend less time pulled away from planned work to deal with outages.
How to measure it: Track the time from when each incident begins until service is restored, then calculate the average across multiple incidents.
Example: If you have three incidents that took 2 hours, 4 hours, and 1 hour to recover from, your MTTR is (2 + 4 + 1) / 3 = 2.33 hours.
8. Mean Time Between Failures (MTBF)
What it is: The average time between system failures or outages.
Why it matters: A higher MTBF usually means greater system stability and reliability.
How to measure it: Divide the total operating time in a period, excluding downtime, by the number of failures in that period.
Example: If a system records 720 hours of operating time in a month and fails three times, your MTBF is 720 / 3 = 240 hours, or 10 days.
9. Code Quality
What it is: A measure of how well-written, maintainable, and efficient your code is. This is a bit more subjective than some other metrics.
Why it matters: High-quality code is easier to understand, modify, and debug, which leads to faster development, fewer errors, and lower long-term costs.
How to measure it: There isn’t one single metric. You can use a combination of:
- Code reviews: Have experienced developers review code for adherence to standards, best practices, and potential issues.
- Static analysis tools: These tools automatically analyze code for potential bugs, security vulnerabilities, and style violations.
- Code complexity metrics: These measure the complexity of code (e.g., cyclomatic complexity), which shows how difficult it is to understand and maintain.
Example: A team might set a maximum cyclomatic complexity of 10 per function and have static analysis block merges that go over it.
10. Change Failure Rate (CFR)
What it is: The share of deployments that break something in production badly enough that the team has to roll back or ship an emergency patch right away.
Why it matters: A high CFR points to problems with your development and deployment processes. It can lead to customer dissatisfaction, lost revenue, and increased support costs.
How to measure it: Track the number of deployments or releases that result in a failure and divide it by the total number of deployments/releases over a given period.
Example: If a team has 100 deployments in a month and 5 of them result in failures, their CFR is 5%.
11. Pull Request (PR) Size
What it is: The number of lines of code changed in a pull request (a proposed code change).
Why it matters: Large PRs are harder to review thoroughly and riskier to deploy. Small PRs get closer attention from reviewers and are easier to revert if something breaks.
How to measure it: Most version control systems (like Git) provide information on the number of lines changed in a pull request.
Example: A team sets a guideline of 200 changed lines per PR. When a feature needs more, the developer opens a series of smaller PRs that reviewers can check one at a time.
12. Merge Frequency
What it is: How often code changes are merged into the main codebase.
Why it matters: Frequent merges are a core part of continuous integration. When each merge triggers automated CI checks, new code is tested against the latest version of the main branch, so integration problems show up early.
How to measure it: Pull the number of merges into the main branch from your version control system, then compare it across days or weeks.
Example: A team that merges 60 pull requests into the main branch over two weeks averages six merges per working day. If that number drops to two, work is probably waiting in long-lived branches.
13. Code Churn
What it is: A measure of how often code is being modified or rewritten.
Why it matters: High code churn can mean instability, potential design issues, or areas of the codebase that need refactoring. However, some churn is expected during active development.
How to measure it: Use version control data to track lines added, changed, and deleted for each file or module. Code that’s rewritten or deleted within a few weeks after it’s written is the main signal to watch.
Example: If 40% of the lines added to a module in a sprint are rewritten or deleted within three weeks, the module has high churn. Check whether requirements changed mid-sprint or whether the code needs refactoring.
14. Release Burndown
What it is: A visual representation of the remaining work in a release or sprint.
Why it matters: Gives the team and stakeholders a shared view of how much work is left and how quickly it’s getting done. A line that flattens out suggests blocked work, while a line that jumps up shows new scope added mid-release.
How to measure it: Use a burndown chart, a line graph that shows the remaining work over time. Most teams measure remaining work in story points or tasks and plot it against an ideal line, which shows the pace needed to finish on schedule.
Example: A release burndown chart might show that the team is not on track to complete all the planned work by the release date, prompting them to adjust their scope or timeline.
15. Story Points Completed
What it is: The total story points a team completes in a sprint (for Agile teams). Story points are a relative unit teams use to estimate the effort a user story takes.
Why it matters: Helps a team understand its own pace from sprint to sprint and plan sprints it can realistically complete. Every team sets its own scale, so don’t compare point totals across teams.
How to measure it: Sum up the story points associated with the user stories that were completed during the sprint.
Example: If a team completes 5 user stories with story point values of 1, 2, 3, 5, and 8, their total story points completed is 19.
16. Throughput
What it is: The number of work items a team completes in a given period, such as user stories, tasks, bugs, or pull requests. Throughput counts finished items, so it doesn’t depend on estimates the way story points do.
Why it matters: Shows how much work the team finishes over time and helps you notice drops in output early.
How to measure it: Count how many work items reach “done” in a set period (e.g., sprint, month, quarter). A bug is usually smaller than a feature, so track each work type as its own count. That way, a sprint full of quick bug fixes doesn’t look like a jump in output.
Example: If a team completes 24 work items in a two-week sprint, its throughput is 24 items per sprint.
17. Code Review Velocity
What it is: How quickly pull requests move through code review, from the moment a review is requested to the final decision.
Why it matters: Faster code reviews help to keep the development process moving and reduce the time it takes to get code changes merged and deployed.
How to measure it: Measure time to first review and total time to approval or rejection for each pull request, then average both across a period. The two numbers show different problems.
Example: If pull requests wait an average of 20 hours for a first review but only 3 more hours for approval after that, most of the delay comes from the wait before anyone starts the review.
18. Code Coverage
What it is: The percentage of your code that is covered by automated tests.
Why it matters: Coverage shows which parts of the codebase your automated tests don’t reach, so you know where to add tests. High coverage alone doesn’t prove the tests are good, so it works best next to quality metrics like defect rate and change failure rate.
How to measure it: Use code coverage tools to analyze your tests and determine what percentage of your code is executed during the tests.
Example: If tests execute 8,000 of a codebase’s 10,000 lines, line coverage is 80%. The uncovered 20% shows where to add tests next, starting with critical paths such as payments or authentication.
19. Project Completion Rate
What it is: The percentage of projects completed successfully within a given timeframe.
Why it matters: Measures how well project plans hold up in practice. A drop often traces back to projects that were too large, poorly scoped, or interrupted by unplanned work.
How to measure it: Divide the number of projects completed successfully by the number of projects due for completion in the same period.
Example: If 10 projects are due to finish this quarter and the team successfully completes 8 of them, its project completion rate is 80%.
20. Developer Experience / Satisfaction
What it is: A measure of how satisfied and engaged developers are with their work environment, tools, processes, and overall experience.
Why it matters: Slow tools, unclear processes, and frequent context switches cost developers time that delivery metrics don’t always show. Regular feedback from developers shows where those obstacles are so you can remove them.
How to measure it:
- Surveys: Run regular surveys to collect feedback on different aspects of the developer experience.
- Interviews: Set up one-on-one interviews to get deeper insights into developers’ perspectives.
- Focus groups: Facilitate group discussions to gather diverse opinions and identify common themes.
Example: A quarterly survey shows developers rate build times 2 out of 5. After the team speeds up its CI pipeline, the next survey rates build times 4 out of 5.
21. Customer Satisfaction Score (CSAT)
What it is: A metric that measures how satisfied customers are with your product or service.
Why it matters: Satisfied customers are more likely to renew, make repeat purchases, and recommend your product/service to others.
How to measure it:
- Surveys: Ask customers to rate their satisfaction with your product/service on a scale (e.g., 1-5 or 1-10).
- Score calculation: Average the ratings, or report the share of customers who choose one of the top two ratings (4 or 5 on a 5-point scale).
Example: If 200 customers respond and their ratings average 4.5 out of 5, the CSAT score is 4.5. With the top-two method, 170 ratings of 4 or 5 out of 200 gives a CSAT score of 85%.
Note → Net Promoter Score (NPS) is often grouped with CSAT, but it measures loyalty. It asks customers how likely they are to recommend your product on a 0–10 scale.
22. Cost Performance Index (CPI)
What it is: A measure of the cost efficiency of a project or activity. It compares the value of the work completed (earned value) to the actual cost incurred.
Why it matters: CPI shows whether engineering spend is producing the amount of work the budget planned for. A monthly CPI trend gives early warning of cost overruns.
How to measure it:
CPI = Earned Value (EV) / Actual Cost (AC)
Earned Value is the budgeted cost of the work performed.
Example: If the team completes work budgeted at $80,000 but spends $100,000 to do it, CPI is 80,000 / 100,000 = 0.8, so the project is over budget. A CPI of exactly 1 means the project is on budget, and anything above 1 means it’s under budget.
23. Schedule Performance Index (SPI)
What it is: A measure of the schedule efficiency of a project. It compares the value of the work completed (earned value) to the planned value of the work scheduled.
Why it matters: SPI compares completed work with the plan, so schedule risk is visible before a deadline is missed.
How to measure it:
SPI = Earned Value (EV) / Planned Value (PV)
Planned Value is the budgeted cost of the work scheduled.
Example: If $80,000 worth of work was scheduled by this point and $60,000 worth is complete, SPI is 60,000 / 80,000 = 0.75, so the project is behind schedule. An SPI of 1 means on schedule, and anything above 1 means ahead.
24. Average Downtime
What it is: The average amount of time that a system or service is unavailable or not functioning as expected.
Why it matters: Average downtime shows how long users are affected each time a service goes down. Read next to the number of outages, it separates many short disruptions from a few serious ones, which call for different responses.
How to measure it: Track the duration of outages or system failures over a specific period and calculate the average.
Example: If a system experiences three outages in a month, lasting for 2 hours, 1 hour, and 30 minutes respectively, the average downtime is (2 + 1 + 0.5) / 3 = 1.17 hours.
25. Capacity/Resource Utilization
What it is: The percentage of available resources (e.g., developer time, infrastructure) that is in use. This is also called the utilization rate.
Why it matters: Very low utilization can be a sign of blocked or idle work, while utilization close to 100% leaves no room for unplanned work and increases the risk of burnout. The goal is a level that keeps work moving with some slack for the unexpected.
How to measure it: Track the actual usage of resources and compare it to the total available capacity. Agree on which activities count as used time, and apply the same definition every period.
Example: If a team of 10 developers has a total of 400 hours of available time per week and spends 320 of those hours on engineering work, their utilization rate is 320 / 400 = 80%.
26. Team Collaboration Metrics
What it is: Metrics that measure the effectiveness of collaboration and communication within the team.
Why it matters: When only one or two developers know a part of the codebase, reviews slow down and work waits when they’re away. Collaboration metrics show whether knowledge spreads across the team. More messages or reviews don’t automatically mean better collaboration, so combine activity data with survey feedback.
How to measure it:
- Frequency of pair programming: Track how often developers work together in pairs.
- Code review participation: Measure the level of engagement in code reviews.
- Communication channels: Look at how quickly questions get answered in tools like Slack or Microsoft Teams. Message volume alone says little about collaboration.
- Team surveys: Gather feedback on team dynamics and collaboration effectiveness.
Example: If two senior engineers handle 70% of all code reviews, the rest of the team rarely sees changes outside its own work. A reviewer rotation spreads that knowledge and shortens the wait for approvals.
How to Create a Custom Engineering KPI Dashboard (with Jellyfish)
How to Create a Custom Engineering KPI Dashboard (with Jellyfish)
Once you’ve chosen your KPIs, a dashboard is the simplest way to keep them in front of the team. When it’s connected to your engineering tools, it updates automatically, so nobody has to rebuild reports by hand.
Custom KPI dashboards are one part of Jellyfish’s software engineering intelligence platform. Here’s how to set one up.
Connect Your Data Sources
Jellyfish connects to the tools your team already uses. The main integration categories include:
- Issue tracking: Jira, Linear, and Azure Boards
- Source control and CI/CD: GitHub, GitLab, Bitbucket, Azure DevOps, Jenkins, and CircleCI
- AI coding tools: GitHub Copilot, Cursor, Claude Code, Amazon Q, and others
- Quality and incident management: SonarQube, PagerDuty, and Opsgenie
For example, Jira data covers sprint progress and story points completed, GitHub covers pull requests and merge frequency, and your CI/CD tools supply deployment data. Jellyfish then links code, issues, and initiatives across these tools, so you can view KPIs by team, by project, or across the whole organization.
Choose Your KPIs
Start with the few KPIs tied to your current goals. Jellyfish comes with built-in engineering metrics for many of the KPIs in this guide, such as DORA metrics, cycle time, and sprint predictability. Metrics Explorer lets you break any of them down by team, or by human contributors and autonomous AI agents.
You can also compare any tracked metric against industry benchmarks to see how your teams perform relative to peers.
If a KPI you need isn’t built in, describe it in plain English, and Jellyfish’s custom metrics agent writes, validates, and runs the query. Power users can also edit the SQL directly. For cycle time, you can break the total down by stage to see where work slows down, including the wait between stages, and adjust the stages to match your team’s workflow.
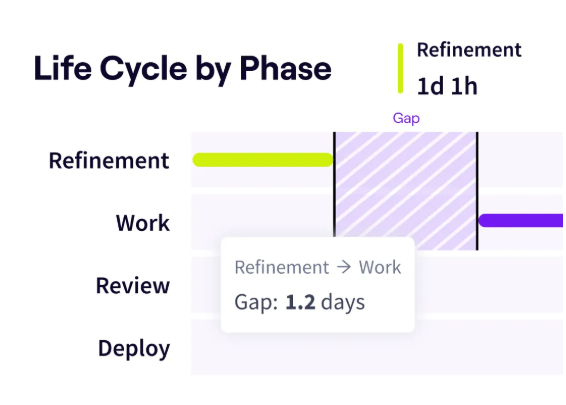
Life Cycle Explorer showing a 1.2-day wait between refinement and work.
Start From a Blueprint or Build Your Own
The quickest way to start is with one of Jellyfish’s ready-made dashboard templates, called Blueprints. Each one comes with a recommended set of metrics based on Jellyfish research and best practices, which gives teams a consistent starting point.
For a custom view, Data Hub lets you choose your own metrics and visualizations and slice data by any dimension. You can also ask the Dashboard agent for a new chart in plain language, such as cycle time by team over the last three months, and the chart appears on your dashboard.
Insights and recommendations show up at the top of each dashboard, so trends worth a closer look are easy to spot.
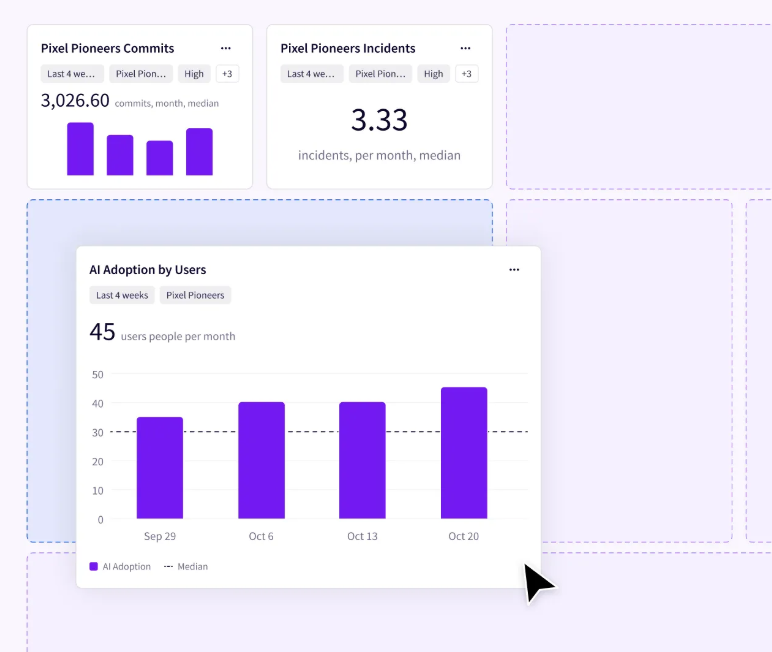
A custom dashboard in Jellyfish Data Hub, with each KPI card filtered by team and time period.
Create a Dashboard for Each Audience
A team lead and a CFO look for different things on a dashboard, so it helps to build a separate one for each audience. A common setup may look like this:
- Team dashboard: Engineering managers and developers use it to follow day-to-day flow, with KPIs such as cycle time and code review velocity.
- Delivery dashboard: Gives engineering directors and platform teams a view of release speed and stability through DORA metrics like deployment frequency and change failure rate.
- Executive dashboard: Shows CTOs, VPs, and their finance and product partners where engineering effort goes and how key initiatives are progressing.
Keep each dashboard to a handful of KPIs so the main trends are easy to read in a quick review.
Share Dashboards and Investigate Changes
Once your dashboard is ready, share it with your team and stakeholders. Teams can use shared dashboards in sprint reviews, onboarding sessions, and monthly leadership meetings, so everyone works from the same numbers.
When a KPI moves unexpectedly, you can ask Jellyfish Assistant what changed. If PR cycle time jumps, for example, the Assistant can look into the spike and point to a likely root cause. Stakeholders can then save and share the insights they find.
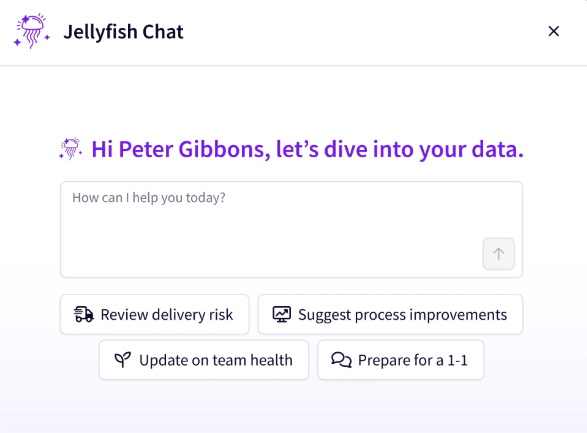
Ask Jellyfish Assistant about your engineering data, or start from one of its suggested prompts.
Connect Engineering KPIs to Business Outcomes with Jellyfish
Connect Engineering KPIs to Business Outcomes with Jellyfish
Engineering KPIs show how a team performs, but they carry more weight when you can connect them to business results. Executives and finance partners want to know which business priorities engineering time supports, what that work costs, and whether investments like AI coding tools pay off. To answer that, you need KPIs and business data side by side.
Jellyfish brings both into one engineering intelligence platform. It links data from your engineering tools to the teams, initiatives, and budgets behind the work, so the same numbers that feed your KPI dashboards also show where effort and spend go.
Here’s how Jellyfish connects the KPIs in this guide to what executives and finance partners want to see:
- Allocations show how much engineering effort, measured in FTEs, goes to each business priority.
- DevFinOps uses engineering data to produce R&D cost and software capitalization reports.
- Jellyfish DevEx connects developer survey results to delivery metrics, so you can see how developer experience affects performance.
- AI Impact measures how AI coding tools affect delivery speed and code quality, and what they cost.
That way, the KPIs you track for your team also hold up in budget discussions with the rest of the business.
Request a demo to see how Jellyfish connects engineering KPIs to business outcomes, or take a tour of the platform first.
FAQs
FAQs
How do you select the right engineering KPIs?
Look at these factors when you choose engineering KPIs:
- Team goals: Track deployment frequency if you want faster releases, or defect rate if you want better code quality.
- Type of work: A team behind a customer-facing web app might put MTTR first, while Agile teams often track throughput.
- KPI mix: Combine leading and lagging indicators with quantitative and qualitative KPIs.
- Number of KPIs: Start with a handful and add more only when you need them.
Review the list whenever your goals change.
What is the most useful performance metric engineering leaders should track?
It depends on your goals, but for software delivery, DORA metrics are a widely used set of engineering performance metrics. Google’s DevOps Research and Assessment (DORA) team now tracks five of them:
- Change lead time (lead time for changes): Time from code commit to production.
- Deployment frequency: How often your team deploys to production.
- Failed deployment recovery time (replaces MTTR): How long it takes to recover from a failed deployment.
- Change fail rate (change failure rate): Share of deployments that need immediate intervention, such as a rollback.
- Deployment rework rate: Percentage of deployments the team didn’t plan and had to make in response to a production issue.
The first three measure delivery speed and the last two measure instability, so together they show whether faster releases come at the cost of stability.
How do engineering KPIs connect to business impact?
Most engineering key performance indicators affect business results through a few direct links:
- Time-to-market: Shorter lead time for changes and higher deployment frequency get new features to customers sooner. That can bring revenue in earlier and improve cash flow.
- Uptime: Lower MTTR and less downtime protect revenue and customer trust, especially for products with SLA commitments.
- Profitability: CPI and effort allocation show whether engineering spend matches the value of the work, which affects project margin and overall profitability.
- Developer productivity: Cycle time and developer experience show where engineers lose time to slow reviews, tools, or processes.
When teams review these KPIs regularly, they become the basis for continuous improvement, since each change can be checked against the numbers.
Interested in learning more about Jellyfish?
See how Jellyfish helps data-driven engineering teams ship better software faster and focus on what matters most to the business.
Tour the ProductAbout the author

Lauren is Senior Product Marketing Director at Jellyfish where she works closely with the product team to bring software engineering intelligence solutions to market. Prior to Jellyfish, Lauren served as Director of Product Marketing at Pluralsight.