

Tokenomics for Your 2027 R&D Budget
Four findings + a five-step exercise
Introduction
Introduction
Between now and December, most engineering leaders are building the 2027 plan: headcount, investment areas, and the budget to fund both. Human Full Time Employee (FTE) cost has always been the biggest line item in that plan, and it still is. But now AI spend belongs in the same conversation, and it does not behave like headcount.
An engineer costs about the same in month twelve as in month one. AI spend per engineer does not. It compounds, it jumps, and the return on each extra dollar depends on the size of your organization. A budget that treats AI tools as a flat per-seat line is built on an assumption the data does not support.
We built this guide because we have the industry’s largest engineering dataset that allows us to see engineering trends across many teams at once.
Jellyfish is the leading Software Engineering Intelligence Platform, helping over 1,000 companies, including DraftKings, Box, and Blue Yonder, transform how they build software with AI. By turning fragmented data into context-rich guidance, Jellyfish enables better decision making across planning, developer experience and delivery so R&D teams can drive stronger business outcomes.
The findings come from Jellyfish Research data on AI usage, delivery, and work allocation, March through August 2026. Each finding ends with what it means for your budget. The last section is a five-step exercise to plot your own team on the curve before you commit to a number.
Finding 1: Spend grows in jumps
Finding 1: AI spend per person is growing fast, and in jumps
The typical company's AI spend per person roughly tripled in six months
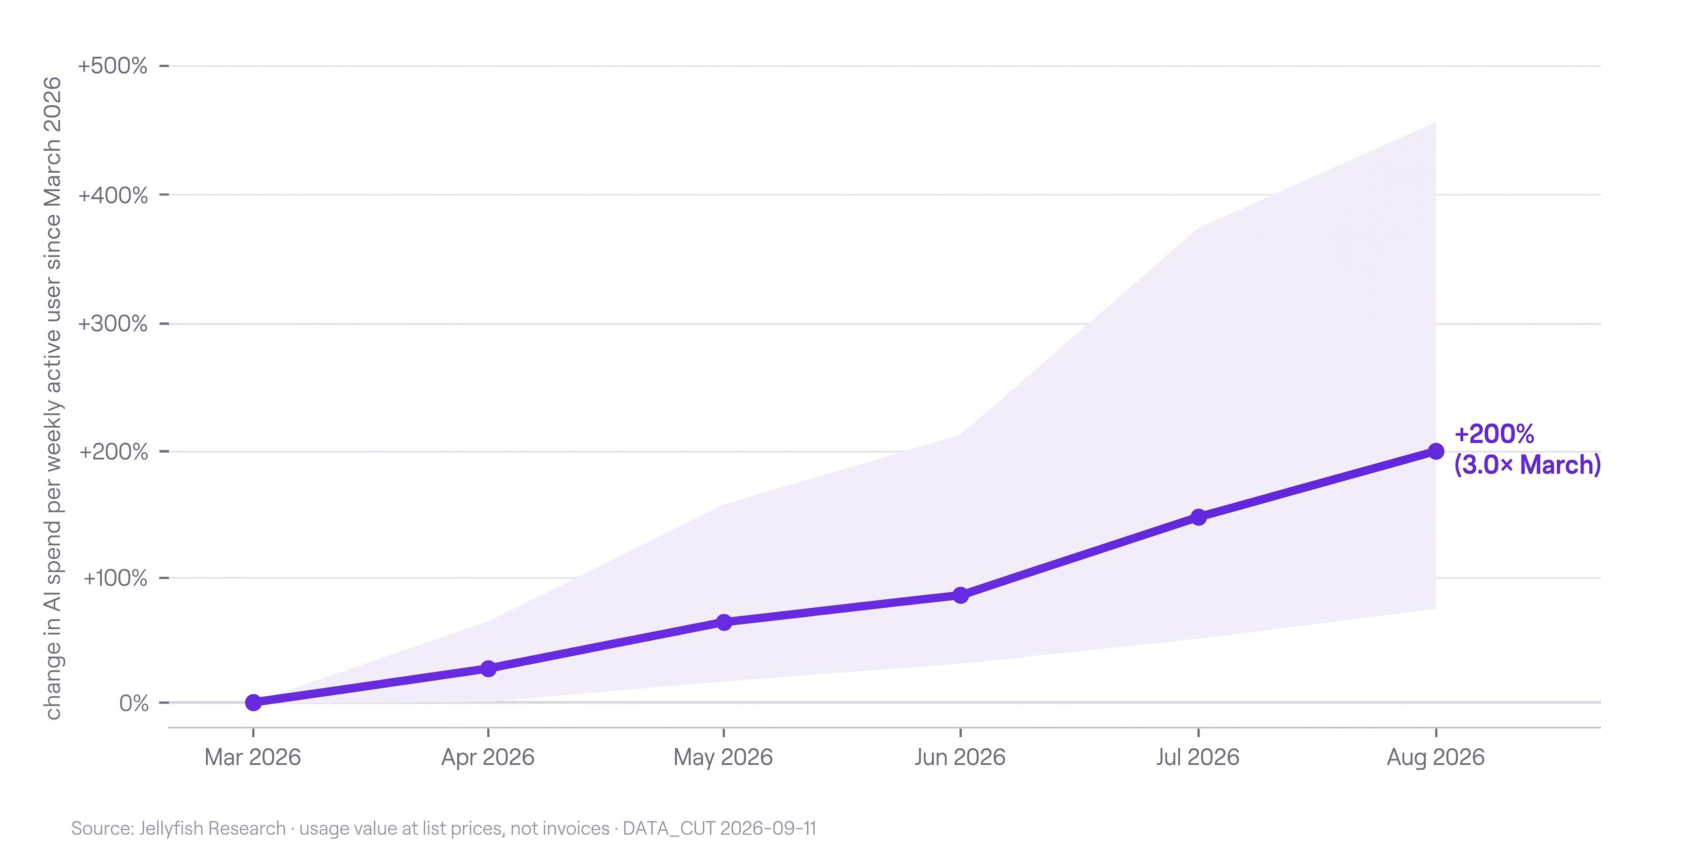
Median company among those with AI cost data in every month, March to August 2026 · each company’s dollars of AI usage per weekly active user of Cursor or Claude Code, as a percent change from its own March level · shaded band = the middle half of companies
Key Takeaways
You should budget for AI spend that compounds and jumps, not a flat monthly line.
From March to August 2026, the typical company’s AI spend per weekly active user roughly tripled. That works out to about 25% more per person, every month. The spread is wide: by August, the middle half of companies were anywhere from under 2× to more than 5× their own March level.
Looking at month-over-month changes at every company, we see that sometimes spend stays flat, sometimes it goes up, and sometimes it goes down — a little, or a lot. There’s a lot of variability.
The growth is not smooth. Looking at every company’s month-over-month change:
- 38% of company-months stayed within 20% of the month before
- 52% rose more than 20%
- 14% rose 75% or more
- 8% at least doubled
- 11% fell more than 20%
How this pace differs by company size, from teams of 20 engineers to 2,000, is an area of research we plan to continue looking at in the coming months.
Month to month, AI spend per person rarely holds steady
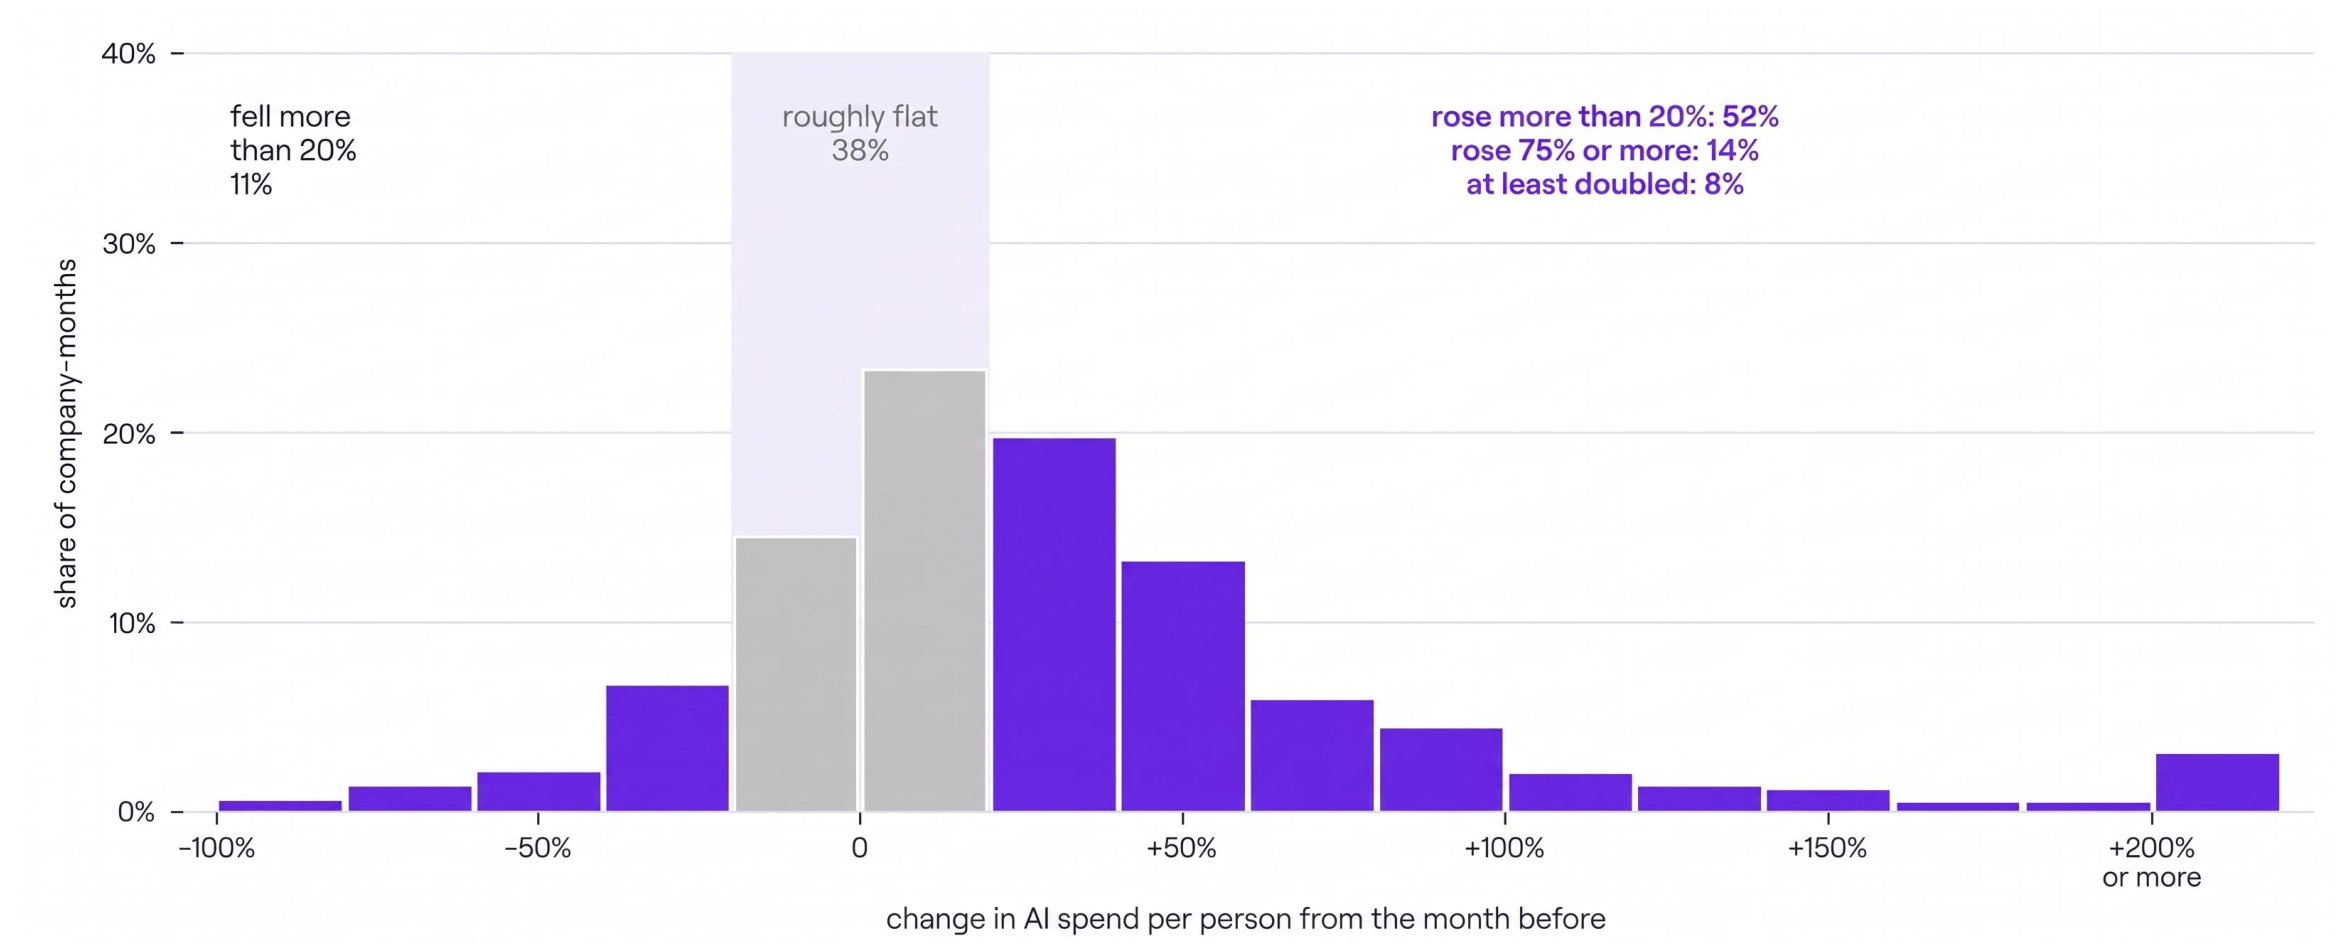
Every month-over-month change pooled, March to August 2026 · one company-month = one company’s change from the previous month in dollars of AI usage per weekly active user of Cursor or Claude Code · purple = a move of more than 20% either way gray = within 20% of the month before · months where a company’s cost reporting first switched on are left out
What this means for your budget
- Don’t multiply this month’s bill by 12. If 25% monthly growth held for a year, month twelve would be more than 11× month one. A flat line is the riskiest assumption you can make.
- Plan for step changes. About one in seven times companies saw spending rise 75% or more month-over-month. Set a review trigger or a buffer, not just an annual number.
- Budget per active user, not per head. Spend is divided by people actually using the tools each week. As adoption widens, your bill grows on two axes at once.
Finding 2: Big teams plateau
Finding 2: Big companies get less out of each extra dollar sooner, and top out lower
Key Takeaways
If your team has 200+ engineers, expect productivity gains from additional AI spend to slow down sooner than smaller companies.
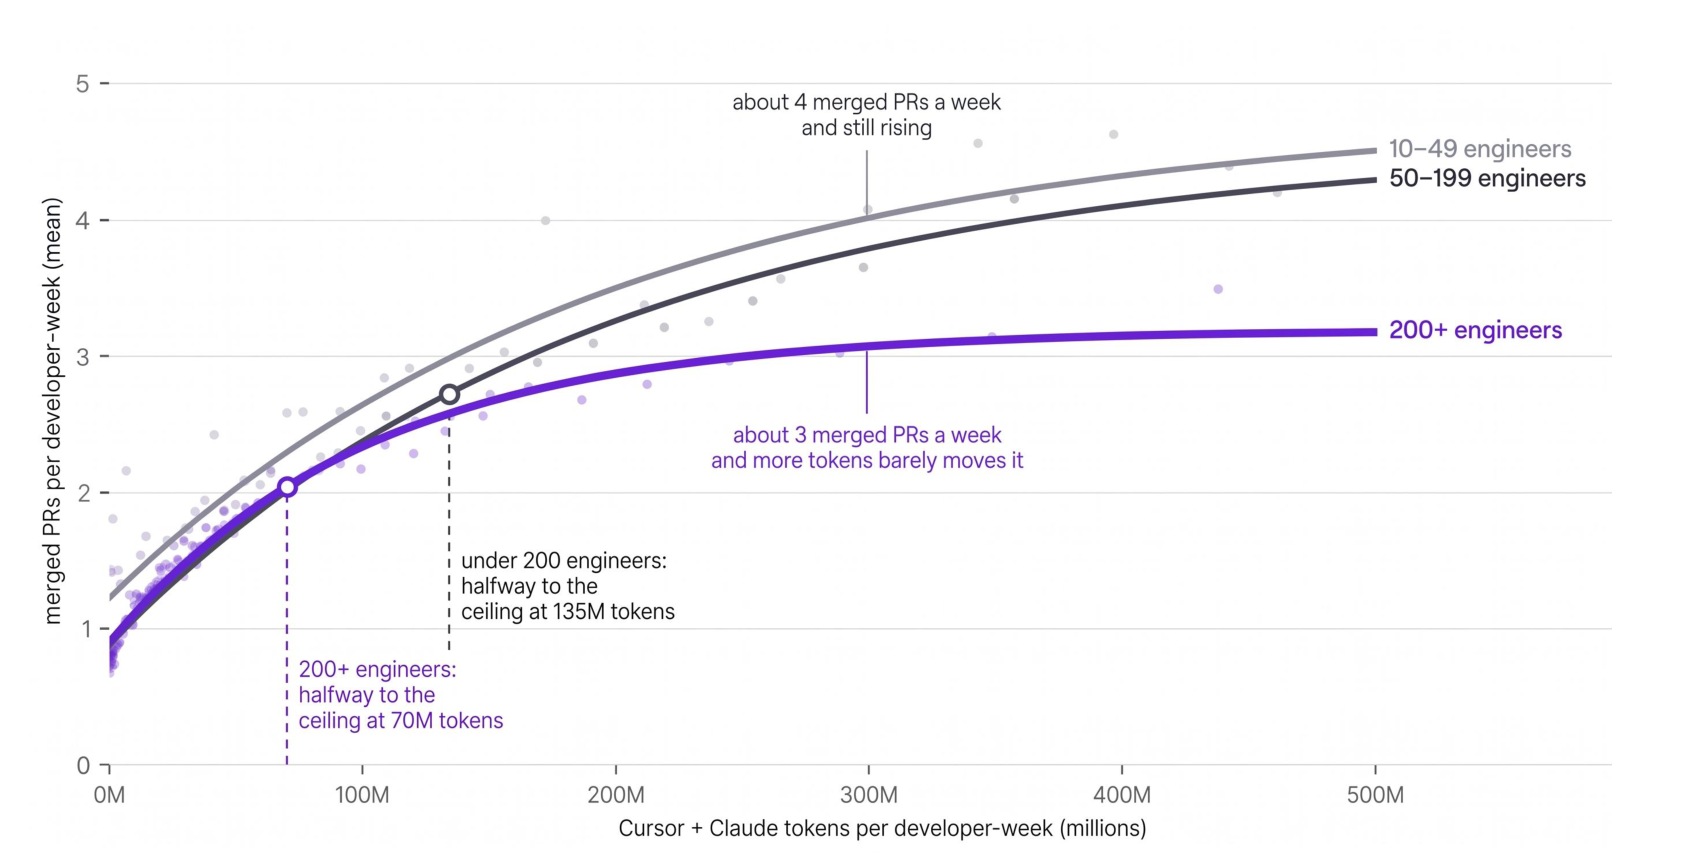
We compared merged pull requests per developer-week against AI token use that week, across 878,167 developer-weeks (May–August 2026), grouped by company size.
- 200+ engineers: reach half of their maximum gain at about 70M tokens per developer-week, then level off at about 3 merged PRs a week. More tokens barely move it.
- Under 200 engineers: reach the halfway point at about 135M tokens, and are at about 4 merged PRs a week and still rising at 300M tokens.
Large companies tend to hit diminishing returns at roughly half the usage level of smaller ones, and their ceiling is lower. The data shows the shape, not the cause. Review capacity, coordination overhead, and cross-team dependencies are reasonable places to look in your own organization.
Big companies tend to get less out of each extra token sooner, and top out lower.
What this means for your budget
- The same AI budget per engineer buys different results at different sizes. If your team has 200+ engineers, benchmarks from smaller companies will overstate what extra spend buys you.
- Find your inflection point before you raise the per-engineer number. Spend past the point where your curve flattens buys less than the spend before it.
- If you’re near your ceiling, the constraint may not be tokens. Money spent removing a bottleneck (reviews, handoffs) may return more than money spent on usage.
Finding 3: Daily use ships faster
Finding 3: Companies getting the most out of AI ship faster and review faster
Key Takeaways
Get more of your engineers using AI tools before you raise spend per user.
Across 7,638 company-weeks (June–August 2026), companies where more engineers use AI tools daily (3+ days a week) merge more pull requests per engineer. The trend runs from 1.39 merged PRs per engineer per week at 0% daily use to 2.68 at 100% – companies that get to daily use are merging nearly twice as much per engineer.
Pull Request Throughput
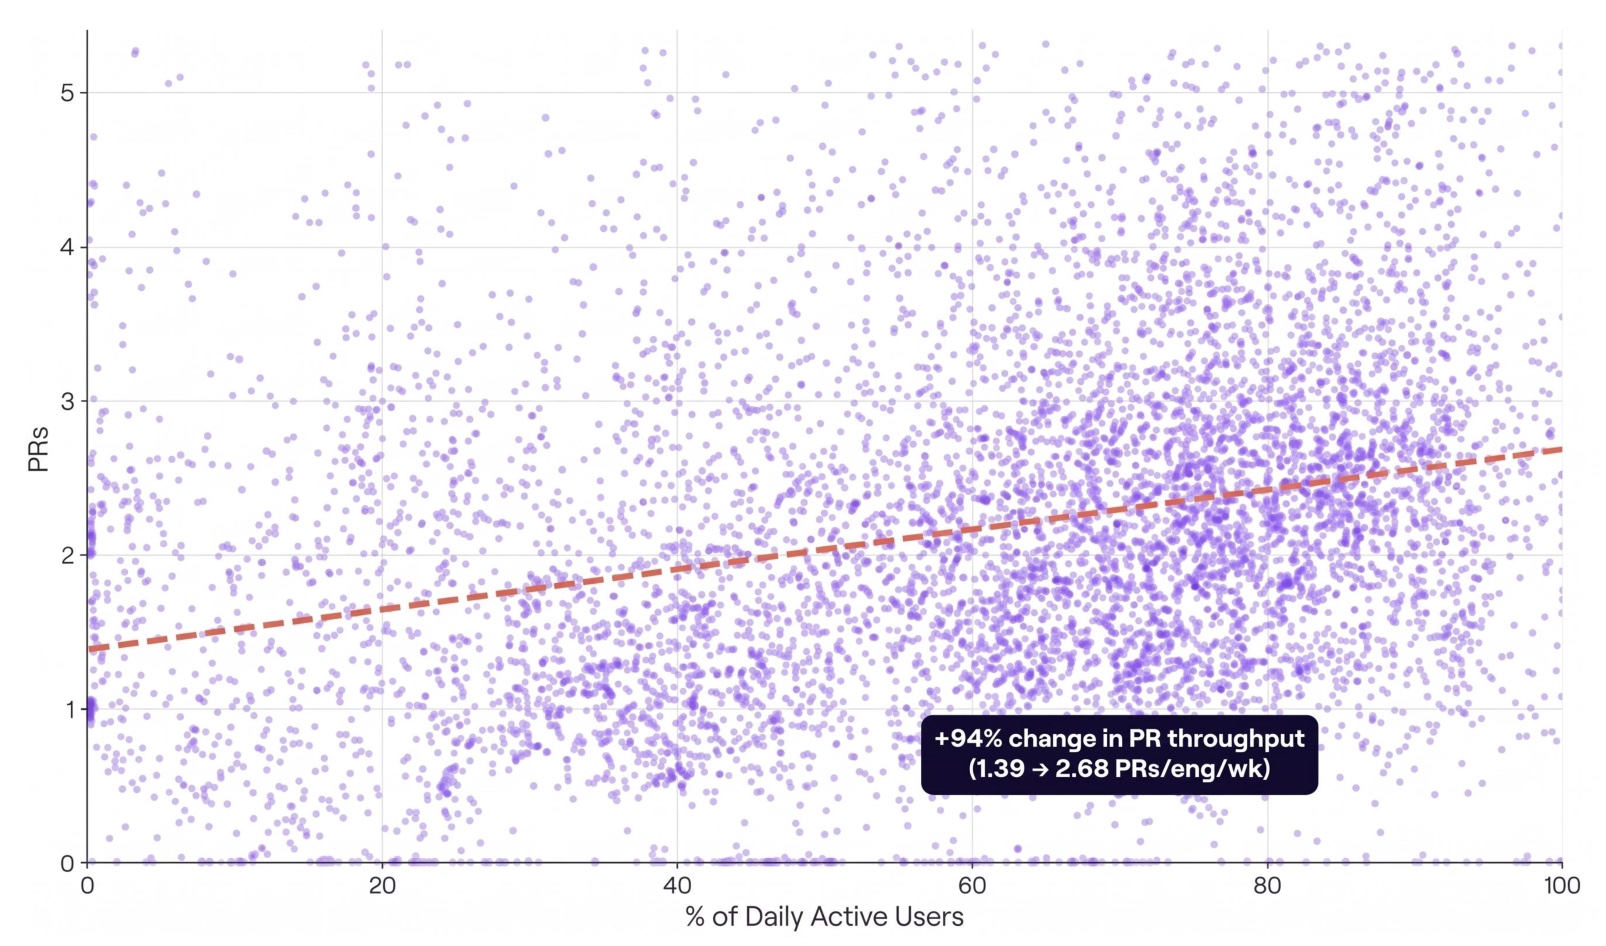
Weekly merged PRs per engineer by company, Jun 2026 – Aug 2026 · 7,638 company-weeks Daily Active Users = engineers using an AI tool 3+ days/week
What this means for your budget
- Check adoption before you add spend. Know what share of your engineers use AI tools three or more days a week. A budget that raises spend per user without widening daily use may be paying for the wrong thing.
Finding 4: Work mix held
Finding 4: AI spend per person tripled; what engineers work on did not follow
Key Takeaways
Decide where AI capacity goes in 2027, or expect it to be absorbed into the same mix of work.
Among companies with both AI cost and work-category data, the typical company’s AI spend went from $37 to $115 per user-week (3x) between March and August 2026. Over the same six months, the split of engineering work barely changed:
- New features: 57% → 56%
- Maintenance: 25% → 24%
- Support: 13% → 13%
- Everything else: 5% → 7%
Working in the same manner as before, but with more use of AI will get you more gains (see Finding 3), but not necessarily focused on the right outcomes. In order to take advantage of the added capacity and productivity, you’re going to have to transform not just your engineering workflows but the upstream prioritization of work.
AI spend per person tripled in six months. The split of engineering work is the same pie.
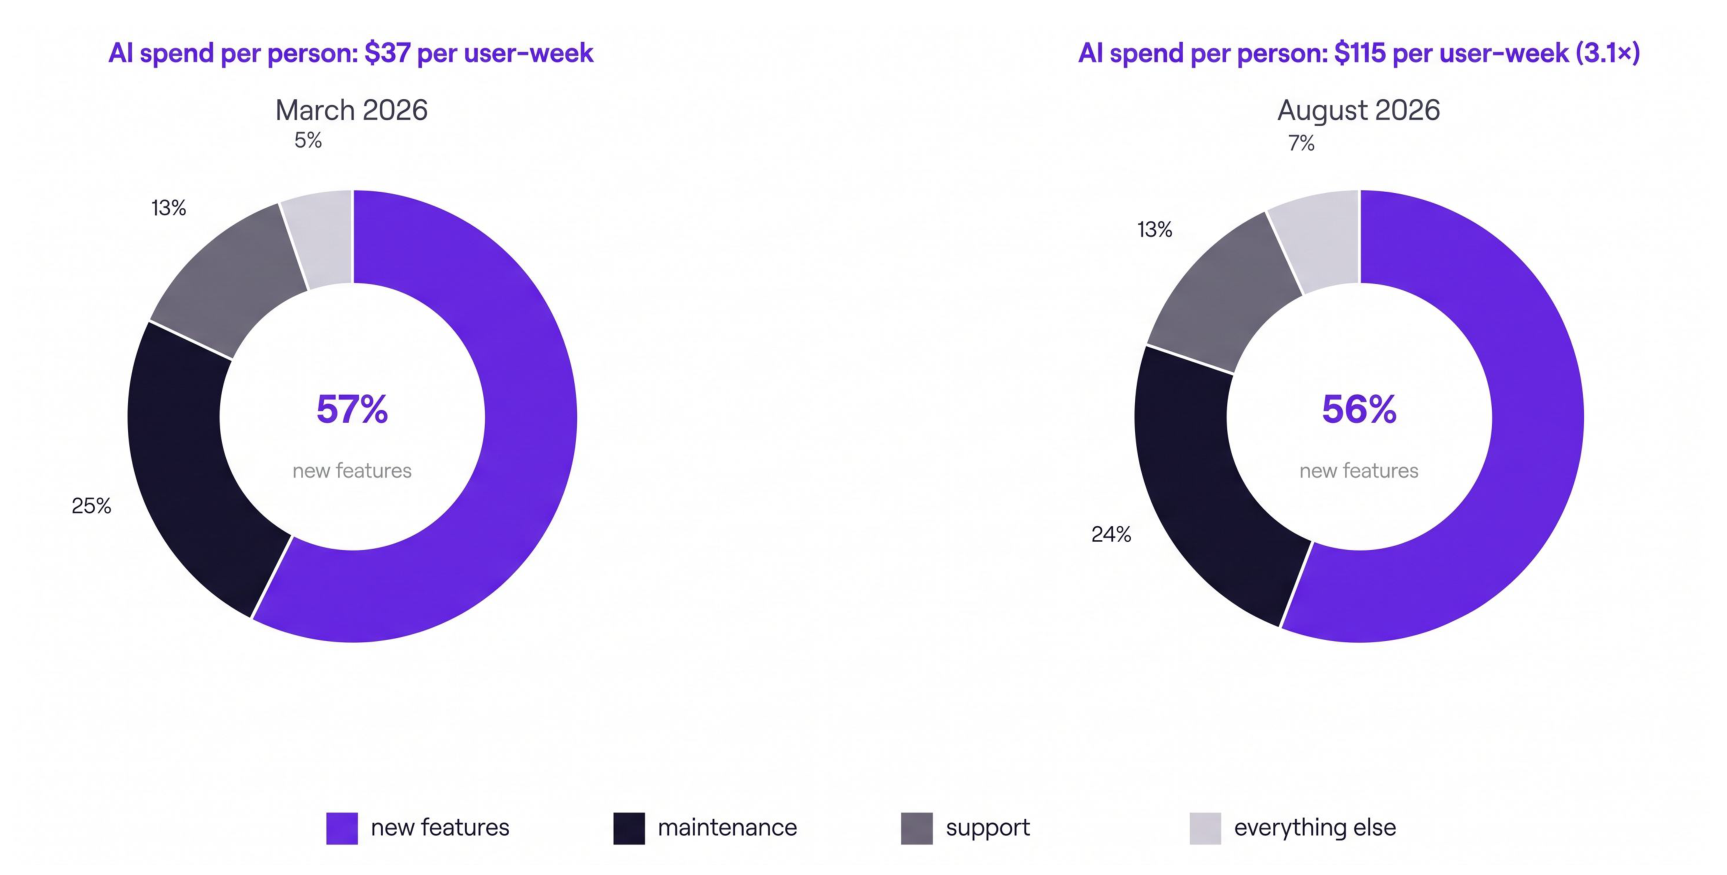
Companies with both AI cost data and work-category data in every month, March to August 2026 each slice is the typical company’s share (the median across companies), scaled so the four add to 100 · spend: the typical company’s AI spend per weekly active user of Cursor or Claude Code
What this means for your budget
- If AI is part of your case for 2027 headcount, say where the capacity goes. “Can AI complement headcount?” only has a yes answer if the freed capacity is pointed at something specific.
- Put an allocation target in the plan. For example, a named shift from maintenance to new work. Then measure it quarterly.
- Measure allocation, not just output. More PRs in the same mix of work is more activity, not a change in what the business gets.
Try it: plot your team
Try it yourself
Before you commit to a 2027 budget, plot yourself on the curve
The full guide includes a five-step exercise to plot your own team on the curve before you commit to a number. You can run it in an afternoon with two numbers you already have: your bill for AI coding tools and your count of merged pull requests.
What you’ll be able to do
- Place your team on the curve. Work out your AI spend and merged PRs per engineer per week, then mark where you sit against the curve for your company size.
- Project a target. Pick a target spend to see the merged PRs it projects, or a target throughput to see the spend it takes.
- Weigh output against cost. Put the extra merged PRs a year next to the extra cost a year, and decide whether the first is worth the second.
- Plan from real data. Ground your planning decisions in the experience of hundreds of thousands of developer-weeks.
Get the five-step exercise
We’ll email you the full guide, with the curve chart and step-by-step instructions.
About the data
About the data
Source: Jellyfish Research. Spend is usage value at list prices for Cursor and Claude Code, not invoiced amounts, per weekly active user. Samples: companies with AI cost data every month, Mar–Aug 2026; 878,167 developer-weeks, May–Aug 2026; 7,638 company-weeks, Jun–Aug 2026. Work categories are customers’ own, normalized by the product. All findings describe patterns across companies, not forecasts for any one company.
Spend is usage at list prices for Cursor and Claude Code, converted at $0.79 per million tokens. Seat-priced plans may show a lower invoice than the usage behind it.
Definitions
Definitions
A developer-week is one engineer in one calendar week.
We look at every week in which an engineer used AI coding tools, and for that week we record how many AI tokens they consumed and how many pull requests they merged.
Measuring at the developer-week, rather than the company or the month lets us ask “does a developer get more out of more tokens?” without company size or adoption breadth getting in the way
About Jellyfish
About Jellyfish
Jellyfish is the leading Software Engineering Intelligence Platform, helping more than 1,000 companies including DraftKings, Box and Blue Yonder, leverage AI to transform how they build software. By turning fragmented data into context-rich guidance, Jellyfish enables better decision-making across AI adoption, planning, developer experience and delivery so R&D teams can deliver stronger business outcomes. Learn more at jellyfish.co.