In this article
Here’s the thing – there are too many things to measure; you can’t pay attention to them all; but here’s 15 DevEx metrics we’ve found our customers using; so choose a subset to focus on based on what you care most about below.
The performance of software development teams cannot be quantified merely by raw output of code written or functionality of products shipped – it’s about the ability of engineering teams to work together efficiently and deliver impact to key stakeholders. And that’s why crafting the best possible developer experience (DevEx) has become a crucial component of modern engineering programs.
If you’re an engineering leader navigating the tsunami of data and philosophies surrounding DevEx, understanding the right metrics is your lighthouse. Building on the foundations of customer experience and service delivery, DevEx has emerged as a key differentiator for product-centric organizations, disrupting traditional engineering mindsets.
What are the key aspects of Developer Experience (DevEx)?
What are the key aspects of Developer Experience (DevEx)?
Developer experience (DevEx) is all about how developers feel and function in their work environment. It’s a broad term that encompasses everything that influences a developer’s ability to do their job effectively, from the tools they use to the processes they follow and the culture they work in.
Just as User Experience (UX) focuses on making software easy and enjoyable for the end-user, DevEx focuses on creating a smooth, efficient, and satisfying experience for developers.
Here’s a breakdown of the key aspects of DevEx:
- Tools and technologies: Are developers equipped with the right tools and technologies to do their jobs efficiently? Are these tools ergonomic, well-integrated, and easy to use?
- Processes and workflows: Are development processes streamlined and efficient? Are there unnecessary hurdles or bottlenecks that slow developers down?
- Culture and collaboration: Does the company culture foster collaboration, knowledge sharing, and psychological safety? Do developers feel supported and valued?
- Environment and infrastructure: Are dev environments stable, reliable, and easy to work with? Has the company set up proper infrastructure and a sustainable on-call system?
Ultimately, good DevEx is about removing friction and frustration from the development process so developers can focus on what they do best: building great software.
This leads to:
- Happy devs: More engaged developers who are doing their best work and less likely to burn out.
- Improved code quality: Fewer bugs, better maintainability, and more robust software.
- Faster time to market: Delivering value to customers more quickly.
Why Measure DevEx?
Why Measure DevEx?
Measuring developer experience is essential for understanding what’s working and what needs improvement in your development process. It’s about optimizing developer workflows for maximum efficiency and impact.
By tracking key metrics, you can:
- Pinpoint bottlenecks: Identify frustrations like slow build times or confusing deployments that lead to burnout.
- Track progress: Demonstrate the impact of your DevEx initiatives.
- Boost productivity and satisfaction: Create a more engaging and efficient development environment.
- Fair benchmarks: Compare performance against industry standards to identify areas of strength and weakness within your engineering organization.
- Attract and retain talent: Candidates can get a sense of your DevEx from speaking with other engineers during the interview process, and a strong DevEx can be a differentiator
- Drive business value: Faster time to market, increased customer satisfaction, and stronger business results.

The Ultimate DevEx Playbook
A step-by-step guide to improving developer experience (and why it matters).
Get eBookBreaking Down Developer Experience Metrics and Use Cases
Breaking Down Developer Experience Metrics and Use Cases
To truly understand and improve developer experience, you need to measure it. But what exactly should you measure? There are many choices, but they can be broadly grouped into these key categories:
Team Performance Metrics
These metrics focus on how efficiently developers can deliver high-quality software. They provide insights into the speed and effectiveness of the development process.
- Deployment Frequency: How often code is successfully released to production. Higher frequency generally indicates a more streamlined and automated process.
- Lead Time for Changes: The time it takes for a code change to go from commit to production. Shorter lead times mean faster feedback loops and quicker delivery of value.
- Mean Time to Recovery (MTTR): How long it takes to recover from production failures. A lower MTTR indicates a more resilient system and a faster ability to resolve issues.
- Change Failure Rate: The percentage of deployments that cause failures. A lower rate suggests better code quality and testing practices.
Satisfaction and Well-Being Metrics
Happy developers are productive developers. These metrics focus on measuring developer satisfaction, engagement, and overall well-being.
- Developer Satisfaction Surveys: Regularly survey developers to gather feedback on their experiences, including their satisfaction with tools, processes, and the work environment.
- Employee Net Promoter Score (eNPS): Measure developer loyalty and their likelihood to recommend the company as a good place to work.
- Employee Retention Rate: Track developer turnover. High turnover can indicate underlying DevEx issues.
Code Quality Metrics
These metrics provide insights into the quality and maintainability of the codebase.
- Code Complexity: Measure how complex the code is, which can impact its understandability and maintainability. Tools like SonarQube can help assess code complexity.
- Code Coverage: Track the percentage of code covered by tests. Higher coverage generally suggests better testing practices and reduced risk of bugs.
- Defect Density: Monitor the number of bugs per line of code. This can indicate the overall quality of the code and the effectiveness of testing efforts.
- Code Review Effectiveness: Evaluate the impact of code reviews on code quality. This might involve tracking the number of defects found during reviews or measuring how reviews improve code clarity.
Collaboration and Tooling Metrics
These metrics focus on how effectively developers can collaborate and utilize their tools and infrastructure.
- Onboarding Time: Measure how long it takes for new developers to get set up with their development environment and become productive members of the team.
- Tooling Satisfaction: Evaluate developer satisfaction with the tools and technologies they use daily. This could include IDEs, version control systems, CI/CD pipelines, and communication platforms such as Slack and Jira.
- Time to First Commit: How long it takes for new developers to make their first contribution to the codebase. This metric can reveal how effective your onboarding process is.
- Collaboration Efficiency: Assess how effectively developers can communicate, share knowledge, and work together as a team. This might involve tracking the time it takes to resolve technical questions or improving documentation in the developer portal.
15 Key Metrics and KPIs for Measuring Developer Experience
15 Key Metrics and KPIs for Measuring Developer Experience
Now let’s take a closer look at the most important metric from each category mentioned above.
1. Deployment Frequency
- How often code is successfully released to production.
- Higher frequency usually indicates a more automated and efficient deployment pipeline, enabling faster software delivery and quicker feedback loops.
2. Lead Time for Changes (LTFC)
- The time it takes for a code change to go from being committed to being deployed in production.
- Shorter lead times indicate faster feedback loops and quicker iteration, enabling teams to respond to user needs more rapidly.
3. Mean Time to Recovery (MTTR)
- How long it takes to recover from production failures or outages.
- A lower MTTR demonstrates a more resilient system and a team’s ability to quickly resolve issues, minimizing downtime and user impact.
4. Change Failure Rate
- The percentage of deployments that cause failures in production.
- A lower change failure rate suggests better code quality, more effective testing practices, and a more stable release process.
5. Time to First Commit
- How long it takes for new developers to make their first code contribution.
- This metric can reveal the effectiveness of your onboarding process and how quickly new hires can become productive members of the team.
6. Developer Satisfaction Surveys
- Regularly surveying developers provides valuable qualitative data about their experiences, including their satisfaction with tools, processes, and the overall work environment.
- The outcome is to obtain a quantitative measure of overall developer satisfaction, often collected through surveys or assessments that cover various aspects of the developer experience.
- The surveys should help provide a clear, trackable metric to assess overall developer satisfaction and identify areas for improvement. It can help track the impact of DevEx initiatives over time.
7. Employee Net Promoter Score (NPS)
- A measure of developer loyalty and their likelihood to recommend the company as a good place to work.
- A high NPS suggests that developers are happy and engaged, while a low NPS may indicate underlying issues that need to be addressed.
8. Employee Retention Rate
- Tracking developer turnover can be a key indicator of overall satisfaction and well-being.
- High turnover may signal problems with DevEx, such as a lack of growth opportunities, poor work-life balance, or a toxic work environment.
9. Code Complexity
- Measures how complex the code is, which can affect its readability, understandability, and maintainability.
- High code complexity can make it difficult to modify or debug code, increasing the risk of errors and slowing down development.
10. Defect Density
- Measures the number of bugs or defects per line of code.
- Lower defect density suggests higher code quality and more effective testing and debugging processes.
11. Time to Merge
- The time it takes for a code change (pull request/merge request) to be reviewed, approved, and merged into the main code branch.
- A long time to merge can indicate bottlenecks in the code review process, insufficient reviewer availability, or unclear code review guidelines. This can lead to frustration for developers and slow down the development cycle. Faster merge times contribute to a more streamlined and efficient workflow.
12. Incident Response Times
- The time it takes to detect, respond to, and resolve production incidents or outages.
- Swift incident response is crucial for minimizing downtime and user impact. This metric reflects the team’s ability to effectively handle production issues and restore service quickly. Faster response times contribute to a more stable and reliable system, reducing stress for developers and users alike.
13. Code Churn
- Part of the code review process should include a review of how often code is being modified, rewritten, or deleted after it’s initially written.
- High code churn can indicate code instability, unclear requirements, or design flaws. It can make code harder to maintain and increase the risk of introducing bugs. Monitoring code churn can help identify areas of the codebase that need attention or refactoring.
14. Innovation Cycle Time
- The time it takes for a new idea or feature request to go from conception to being deployed in production.
- This metric captures the organization’s ability to innovate and deliver new value to users quickly. A shorter innovation cycle time means the development team can respond to market changes and user needs more effectively.
15. Technical Debt
- The implied cost of rework caused by choosing an easy solution now instead of a better approach that would take longer. This can include things like code complexity, lack of updated developer docs, or outdated technology.
- Technical debt can accumulate and slow down development over time, making it harder to add new features or fix bugs. Managing technical debt is essential for maintaining a healthy codebase and ensuring long-term productivity.
DevEx Metrics Implementation: 3 Key Steps
DevEx Metrics Implementation: 3 Key Steps
Implementing DevEx metrics effectively is a crucial step towards creating a better experience for your developers.
1. Establish a Baseline
Before you can improve DevEx, you need to understand where you stand currently. This means gathering initial data to establish a baseline for your key metrics.
Here’s how to approach it:
- Identify key metrics: Based on your specific goals and context, choose the DevEx metrics that are most relevant to your organization. Go beyond standard DORA metrics and consider the categories we’ve discussed: productivity, satisfaction and well-being, code quality, and collaboration/tooling.
- Gather data: Use a combination of quantitative and qualitative data sources. This might include:
- Automated data collection: Use tools and platforms to gather data on deployment frequency, lead time, MTTR, etc.
- Surveys: Conduct developer satisfaction surveys to gather feedback on their experiences and identify pain points.
- Interviews: Conduct one-on-one interviews with developers to gain deeper insights into their challenges and suggestions.
- Analyze the data: Once you’ve collected the data, analyze it to identify trends, patterns, and areas that need attention. This will help you understand your current DevEx baseline and prioritize areas for improvement.
2. Automate Data Collection
Manually collecting DevEx metrics can be time-consuming and error-prone. To ensure consistent and reliable data, automate the collection process as much as possible.
Here’s how:
- Leverage existing tools: Many development tools and platforms offer built-in metrics and reporting capabilities. Explore the features of your version control system, CI/CD platform, project management tools, and other relevant systems.
- Integrate with monitoring and analytics platforms: Use dedicated monitoring and analytics platforms to track key metrics like deployment frequency, lead time, and MTTR. These platforms can provide dashboards and visualizations to help you understand the data.
- Implement custom scripts and tools: If your existing tools don’t provide the metrics you need, consider developing custom scripts or tools to automate data collection.
3. Visualize and Communicate Results
Data is only useful if it’s presented in a clear and understandable way. Visualize your DevEx metrics and communicate the results effectively to stakeholders.
Here’s how:
- Create dashboards and reports: Use data visualization tools to create dashboards and reports that present key metrics in a visually appealing and informative way.
- Share findings with developers: Communicate the results of your DevEx measurement efforts to the development team. This transparency helps build trust and encourages developers to participate in the improvement process.
- Tailor communication to different audiences: Present the data in a way that is relevant and meaningful to different stakeholders. For example, executives might be more interested in high-level trends and the impact on business goals, while developers might be more interested in specific metrics related to their daily work.
- Use data to drive action: Don’t just collect and present data for the sake of it. Use the insights gained from your DevEx metrics to drive concrete actions that improve the developer experience.
How to Analyze and Improve Developer Productivity
How to Analyze and Improve Developer Productivity
Monitoring developer experience (DX) metrics is a crucial first step, but it’s only the beginning. To truly enhance developer productivity, engineering leaders need to go beyond simply collecting data. They need to analyze it effectively and translate those insights into actionable improvements.
Here’s a breakdown of how to analyze and improve developer productivity:
1. Interpret the Data
- Context is key: Raw data alone doesn’t tell the whole story. Start by asking yourself, “What problem am I trying to solve?” For instance, if you’re tracking Lead Time for Changes (LTFC), your goal is likely to accelerate delivery and reduce time-to-market. Use this objective to guide your analysis.
- Focus on the right metrics: Don’t get bogged down in a sea of data. Select the metrics that are most relevant to your goals and the specific challenges your team members are facing.
- Utilize DX Tools: Consider using developer experience tools that can aggregate data from various sources (e.g., GitHub, Jira, CI/CD platforms) and provide visualizations and insights to aid in interpretation.
2. Identify Areas for Improvement
- Spot patterns and trends: Look for patterns in the data that reveal bottlenecks, inefficiencies, or areas where developers are struggling. For example, if your LTFC is high, investigate whether slow code reviews, manual testing processes, or unclear requirements are contributing to the delay.
- Gather qualitative feedback: Don’t rely solely on quantitative data. Conduct surveys, interviews, and focus groups to gather qualitative feedback from your software engineering teams and understand their perspectives on the challenges they face.
3. Implement Changes
- Prioritize and test: Based on your analysis, prioritize the most impactful improvements. Consider implementing changes incrementally, starting with a pilot program or a small group of developers to test their effectiveness before rolling them out organization-wide.
- Focus on actionable solutions: Develop concrete solutions to address the identified issues. This might involve streamlining workflows, improving documentation, investing in new tools, or providing additional training and support.
The Future of Developer Experience Metrics
The Future of Developer Experience Metrics
Jellyfish DevEx helps engineering organizations uncover the most challenging aspects of their engineering teams’ workflows and work lives so they can implement processes, tools, and team improvements. Combined with Jellyfish’s core EMP, leaders can gain an even more comprehensive organizational perspective and turn feedback into improvement with tools that align, measure, budget, and deliver on DevEx initiatives.
- Get the answers leaders need: Choose from industry-leading questionnaires that get to the root of engineers’ take on satisfaction, processes, and tooling effectiveness.
- Easily discover what’s impactful: Easily make sense of qualitative signals by segmenting results across teams, locations, focus, and tenure.
- Improve with actionable suggestions: In-app suggestions that explain the meaning behind scores and possible actions to improve perception and drive outcomes.
It’s about ensuring leaders understand what they can do to drive happy and productive teams and that the investments they make towards it truly make an impact. Are their developers content, or do they feel like they’re stuck at a dead end? Do they have a clear direction, effective tooling, and environments, and the support they need to get the job done?
Incorporating qualitative signals from Jellyfish DevEx marks an exciting addition to Jellyfish’s EMP, taking it beyond measurement and toward a deeper understanding of what’s happening within organizations. These innovations continue to progress Jellyfish’s mission to solve the complex challenges engineering organizations continue to face. Jellyfish DevEx gives engineering leaders tools that ensure alignment across every team to build efficiently and deliver business impact.
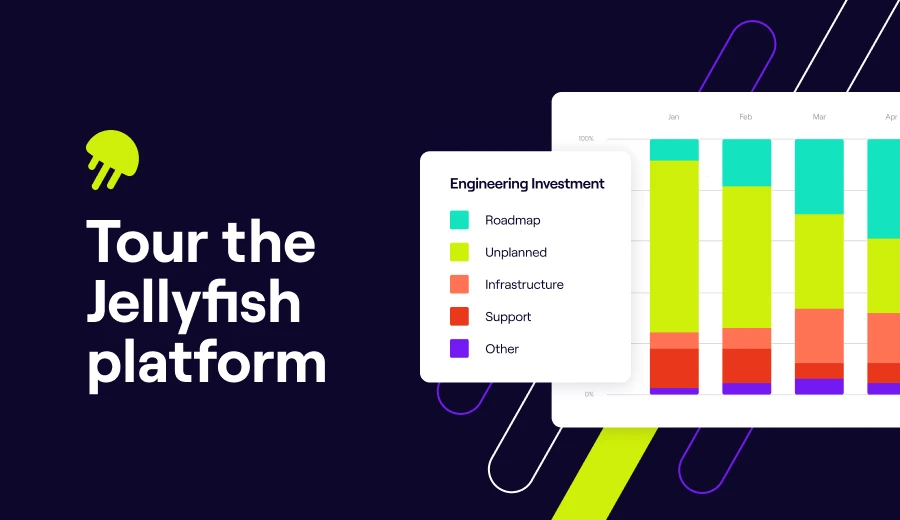
Interested in learning more about Jellyfish DevEx?
See how Jellyfish can help you measure and improve developer experience for your organization.
Tour the ProductAbout the author

Lauren is Senior Product Marketing Director at Jellyfish where she works closely with the product team to bring software engineering intelligence solutions to market. Prior to Jellyfish, Lauren served as Director of Product Marketing at Pluralsight.

