In this article
Teams with a high-quality developer experience are 33% more likely to attain their target business outcomes, according to Gartner research. That experience comes from everyday conditions such as reliable tools, clear requirements, and time for focused work.
But developer experience (DevEx) is harder to measure than it is to describe. Delivery metrics show where work slows down, but satisfaction, cognitive load, and burnout only come through when you ask developers directly.
Developer experience tools combine that feedback with engineering data from sources like GitHub, Jira, and CI/CD pipelines. With both in one place, teams can find what holds developers back and confirm whether each fix improves developer productivity.
Below, we compare 10 DevEx platforms by approach and ideal use case, with a short checklist to help you choose one for your organization.
What Are Developer Experience Tools?
What Are Developer Experience Tools?
Developer experience tools are platforms that measure developer experience and help engineering teams find and remove what slows developers down. Some began with developer surveys and moved into engineering metrics later, and others started with engineering data and built DevEx modules on top of it.
This list sticks to DevEx platforms, so it leaves out general developer tools:
- IDEs and code editors such as VS Code
- AI coding assistants like GitHub Copilot, Cursor, and Claude Code
- Internal developer portals such as Backstage
- CI/CD and deployment platforms like CircleCI and Vercel
DevEx platforms help teams decide where to invest across that toolchain. Survey results point to the tools developers struggle with, and engineering data shows whether a change made a difference.
Key Features to Look For in a DevEx Tool
Key Features to Look For in a DevEx Tool
Most platforms on this list offer developer surveys and engineering metrics in some form. They differ in the quality of that data and in how much guidance they give on what to do next.
Developer Feedback
Developer feedback is the core of any DevEx platform, so the survey itself deserves a close look. Question sets based on established research, such as the SPACE framework, give you results you can compare from one quarter to the next. That consistency is hard to get from a homegrown form.
The setup around the survey also affects who answers and how honestly. These features improve participation and make the results easier to act on:
- Anonymous responses, so developers can raise problems without worry
- Short pulse surveys between longer quarterly ones
- Team-level reports that keep results out of individual performance reviews
- Automatic summaries of open-text answers, which often explain a low score
- Without these basics, response rates often drop after the first few survey cycles.
Engineering Data
Survey results show where developers feel slowed down, and engineering data shows how much that problem costs. DORA metrics give a baseline for delivery speed and stability. Data from CI/CD pipelines and automated testing points to slow builds and unreliable tests, while issue tracking data shows where work arrives unclear or piles up.
Because all of this comes from existing systems, developers don’t have to track their time.
Example → Let’s say that developers on one team rate code review as their biggest blocker in a quarterly survey. Pull request data confirms that review wait times doubled after a reorganization, and lead time for changes increased in the same period. The team now has a clear cause and a metric to track after it changes its review process.
Benchmarks
With feedback and engineering data in place, the next step is context. A code review score of 3.8 out of 5 means little until you know how similar teams score. Benchmarks usually come in these forms:
- Industry benchmarks put your results next to companies of similar size or sector.
- Internal benchmarks compare teams within your organization and point to where to focus first.
- Historical trends show whether your own scores improve after each change.
Benchmark depth varies by platform, so ask each vendor which peer groups its data includes and how large the sample is.
Actionable Insights
Context helps you prioritize, but teams still need to know what to do next. Some platforms recommend specific actions based on survey responses, while others let teams set improvement goals and track progress in the same place. When developers raise technical debt, for example, code quality data can show which repositories need attention first.
Results should also go back to developers. When teams see their feedback lead to changes, they’re more likely to take part in the next survey.
Integrations
All of this depends on the data a platform can reach. Before you commit, confirm that it connects to the tools your teams already use:
- Git platforms such as GitHub, GitLab, and Bitbucket
- Issue trackers like Jira or Linear
- CI/CD and testing tools
- AI coding tools such as GitHub Copilot, Cursor, and Claude Code
- Slack or Microsoft Teams for survey delivery and reminders
Integration lists on vendor websites don’t show how deep each connection goes. A demo with your own data is the quickest way to confirm what each connector pulls in and how much history it imports.
10 Best Developer Experience Tools
10 Best Developer Experience Tools
Each platform below measures developer experience through developer surveys, engineering data, or a combination of both.
Use the table for a quick comparison of DevEx approaches and ideal use cases, then read the profiles for more detail on each platform.
| Platform | DevEx approach | Best for |
| Jellyfish | Validated surveys and a DevEx Index tied to DORA, SPACE, and system metrics, with AI impact data in the same platform | Engineering organizations that report productivity across teams, departments, and the business |
| LinearB | Slack surveys next to delivery metrics, with pull request automation and AI code reviews | Slack-based teams that want metrics and workflow automation from one vendor |
| Haystack | Team-level delivery analytics with Slack alerts, plus pulse surveys as a paid add-on | Smaller teams that want a focused delivery analytics tool |
| DX (Atlassian) | Research-based recurring surveys, the Core 4 framework, and industry benchmarks | Large organizations and Atlassian customers that want framework-led DevEx measurement |
| Swarmia | Engineering metrics, DevEx surveys, and team working agreements visible to everyone | Teams that value transparency and want developers to use the data themselves |
| Faros | Developer survey results alongside delivery metrics and AI usage data in one data model | Enterprises with complex toolchains that want DevEx, delivery, and AI data in one place |
| Span | Themed DevEx surveys and benchmarks, plus code-level analysis of AI-written work | Teams with several AI coding tools that want DevEx surveys and AI analysis in one platform |
| Waydev | Driver surveys with industry benchmarks and annual cost estimates for slow workflows | Teams that need to present DevEx and AI results in business terms |
| Typo | AI-led chat check-ins, a six-area DevEx framework, and workload alerts | Teams where response rates for traditional surveys are low |
| Weave | LLM analysis of each pull request and code review, with no developer surveys | Teams that want to measure output by the effort each change takes |
1. Jellyfish
Jellyfish is a software engineering intelligence platform that gives engineering organizations an ongoing view of developer experience alongside delivery and AI adoption data.
What sets it apart: Jellyfish pairs validated developer surveys with DORA, SPACE, and system metrics, so each experience problem comes with the engineering data that explains it.
Best for: Engineering organizations that want a repeatable way to measure, compare, and improve developer experience across teams.
Key features
- Validated DevEx surveys: Teams can launch research-based developer surveys on key experience topics in minutes, and automated analysis groups the results by team and role.
- DevEx Index and benchmarks: One comparable score shows how developer experience changes from survey to survey. Teams can compare results across internal teams, roles, and industry peers.
- AI-guided next steps: AI interprets survey results and recommends specific actions for each team, and tracked actions and trends show whether developer sentiment improves afterward.
- AI tools in the developer experience: Teams can include AI questions in their DevEx surveys and see how tools like GitHub Copilot, Cursor, and Claude Code affect delivery in the same platform.
What users say
Jellyfish pulls data from the tools teams already use across the SDLC and brings it into one view of productivity. One G2 user valued how that view works at different levels of the organization:
“I like the ability of Jellyfish to tie into the current tools we’re using across our SDLC, like Jira and GitHub, and bring them together. It’s great for understanding our kind of overall development productivity across teams and measuring it at various levels like group and org level.”
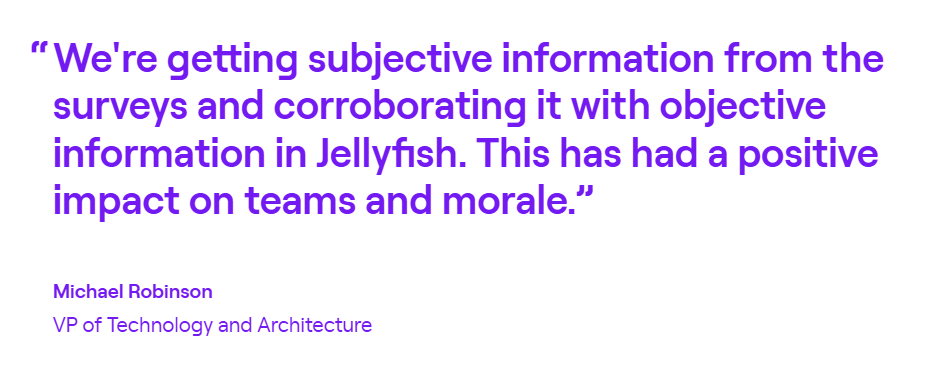
Kaleris is a good example of this in practice. The supply chain software provider uses Jellyfish DevEx for developer surveys and checks the answers against its engineering metrics. The results pointed to tools as the main source of slowdowns, and Kaleris has also improved PR cycle time by 21% and MTTR by 19%.
Like any platform that reads Jira and GitHub data, Jellyfish works best when teams use those tools consistently. Another G2 user noted what can happen when they don’t:
“I find that Jellyfish heavily relies on clean data from Jira and GitHub to generate accurate insights. If the data hygiene isn’t consistent, the metrics can become misleading.”
2. LinearB
LinearB combines delivery metrics from Git and project management tools with Slack-based developer surveys to show how review and delivery speed affect developer experience.
What sets it apart: LinearB pairs DevEx measurement with gitStream workflow automation and AI code reviews, so teams can act on pull request bottlenecks and track the effect on developer sentiment and cycle time.
Best for: Teams whose developers name code review as a top source of delays and who want to address it through automation.
Key features
- Developer surveys in Slack: Surveys go out through Slack and include ready-made topics such as AI-assisted development, code quality, and well-being. Teams can also write custom questions.
- Survey results in context: Each team’s survey scores appear next to its delivery metrics, so managers can see whether a low score and a drop in productivity point to the same problem. Results for very small groups are hidden to protect anonymity.
- Workflow automation: Teams can set rules for how pull requests are assigned, reviewed, and approved, and AI code reviews check pull requests for bugs and security risks. This gives teams a way to act when surveys point to slow or inconsistent reviews.
What users say
LinearB gives managers a clear view of how each team is doing, which is what one G2 user valued most:
“One of the most valuable aspects is its remarkable visibility into teams and groups, which allows us to quickly identify what is working well, and what needs our attention. With full support for standards like DORA and the inclusion of benchmarks, LinearB offers a clear picture of how our teams are progressing.”
That level of detail has a cost when results need to go up the chain. The same user noted that LinearB’s depth makes updates for senior leadership harder:
“Its detailed nature can sometimes make upward management challenging. I’d appreciate streamlined scorecard-type reports that include benchmarks for easier summary reporting to senior leadership.”
Related read → 8 LinearB Alternatives for Engineering Intelligence
3. Haystack
Haystack is an engineering analytics platform that helps software teams ship faster and keep developers happy, using team-level insights from Git and Jira.
What sets it apart: Haystack focuses on team-level insights and sends managers Slack alerts on delivery risks and early signs of burnout across the team.
Best for: Teams whose first priority is delivery flow, with early warnings on team health and developer surveys as an optional extra.
Key features
- Delivery analytics: Haystack connects to GitHub, GitLab, or Bitbucket along with Jira and tracks how work moves from first commit to deployment. It reports metrics such as cycle time for each team.
- Proactive alerts: Haystack watches for pull requests stuck in review and other delivery risks, so managers can step in while delays are still small.
- Developer pulse surveys: A paid add-on gives teams recurring surveys on collaboration, tooling, and workload. Results track trends in developer sentiment, engagement, and burnout risk over time.
What users say
Haystack’s risk alerts get a specific mention in this G2 review, along with its top-down view of the delivery process:
“Provides engineering North Star metrics from the top-down, allowing you to find where bottlenecks are in the software development lifecycle. Risk alerts provide very easy-to-understand, fast insights.”
Those insights may be fast, but the web app isn’t always. Another user noted:
“The web interface works slowly sometimes. I would be happy to use a more modern interface.”
Disclaimer → Haystack has 11 reviews on G2, and most of them date from 2022, so the interface may have changed since then.
Related read: 8 Haystack Competitors & Alternatives for 2026
4. DX (Atlassian)
DX is a developer intelligence platform, now part of Atlassian, that measures developer experience and productivity through recurring surveys and engineering system data.
What sets it apart: DX bases its measurement model on its own research, including the DX Core 4 framework, which brings DORA, SPACE, and DevEx into one set of productivity metrics.
Best for: Organizations that want a research-based way to measure developer experience and productivity, with a large industry benchmark set for comparison.
Key features
- Single DevEx score: DX turns survey responses into a Developer Experience Index based on the factors developers rate, such as code maintainability and documentation.
- Industry benchmarks: Teams can compare their results with benchmarks segmented by company size, region, and industry. DX updates these each year using data from its customers and research panel.
- Survey and system data together: The Core 4 framework lets teams measure each metric through surveys, system data, or both. System-based metrics are part of DX’s Data Cloud offering.
What users say
A team lead on G2 explained why DX’s GitHub integration made productivity measurement easier for them:
“I really like how naturally it integrates with developer tools like GitHub. As a team lead, I’ve faced the challenge of measuring impact and team productivity, and without an integrated way to pull those measurements from the tools developers use day to day, the whole process quickly becomes tedious.”
New users may need more time with the platform, though. Another G2 user shared:
“The main downside is the learning curve for first-time users. It can take some time to understand the platform and navigate its features effectively. A more intuitive onboarding experience could help new users get up to speed faster.”
Related read → 12 Best GetDX Alternatives & Competitors
5. Swarmia
Swarmia brings engineering metrics, developer experience surveys, and AI adoption data together to show how teams work and what gets in their way.
What sets it apart: Swarmia makes most of its data visible to everyone and treats DevEx as a property of the system teams work in, so developers use it to improve their own workflows.
Best for: Teams that want developers to take an active part in DevEx improvement, with shared data and team-agreed standards.
Key features
- Engineering metrics: Swarmia tracks delivery and CI data to show where developers lose time, such as slow or flaky pipelines and pull requests that wait too long for review.
- Team working agreements: Teams set shared standards that protect their productivity, like review turnaround times or limits on work in progress. Teams on Slack get a daily digest on how well they keep them.
- Team survey heatmaps: Teams build recurring surveys from a research-based question library or their own questions, and results appear in a heatmap by team, with benchmarks for context.
What users say
One G2 user credited Swarmia with making team productivity easier to understand:
“What I like best about Swarmia is how it makes engineering team productivity and collaboration much easier to understand. The insights are clear, actionable, and help teams identify bottlenecks, improve workflows, and stay aligned without adding unnecessary complexity.”
Not every user finds the numbers self-explanatory, though. One G2 user pointed out:
“One thing I dislike about Swarmia is that some of the metrics can be misleading if viewed without context. They show what is happening, but not always why. For example, a developer might spend a lot of time investigating a complex issue or helping other team members, but this contribution may not be fully reflected in the metrics.”
Related read → 13 Swarmia Alternatives for Engineering Team Optimization
6. Faros
Faros (formerly Faros AI) is an AI engineering platform with roots in software engineering intelligence that brings engineering, AI, and developer survey data into one model.
What sets it apart: Faros connects AI tool spend to team productivity, so engineering leaders can see which investments speed up delivery and which don’t.
Best for: Engineering organizations with complex toolchains that want to measure developer experience, delivery performance, and AI adoption in one place.
Key features
- AI spend against output: Faros compares AI tool usage and token costs with output such as merged pull requests and releases, so teams can see whether AI makes them more productive.
- Delivery and DORA metrics: Dashboards track delivery speed and stability for each team, which gives a productivity baseline before and after any change.
- Developer feedback next to telemetry: Faros pairs survey results, from its own templates or other survey tools, with Git, CI/CD, and issue tracker data to show what slows developers down.
What users say
For one G2 user, Faros made developer productivity easier to track by bringing GitHub and Jira data together:
“Faros AI has been helpful in consolidating our GitHub metrics and Jira metrics in one central place and building charts for developer productivity.”
The same user would like more control over how productivity data is laid out across dashboards:
“We would like to have a more intuitive UI for customization, including the ability to easily move widgets from one dashboard to another.”
Related read → 8 Faros AI Competitors & Alternatives for 2026
7. Span
Span is an AI-native developer intelligence platform that combines code, ticket, incident, and survey data for a human-centered view of developer experience and productivity.
What sets it apart: Span measures AI’s contribution at the code level, separating AI-written and human-written work to compare how each moves through review and delivery.
Best for: Engineering organizations that want to understand how AI-assisted development changes developer experience as well as output.
Key features
- AI code share and impact: Span groups merged pull requests by their share of AI-written code, from none to high, and reports how speed, review effort, and quality differ between the groups
- Themed DevEx surveys: A ready-made template covers experience themes such as deep work, code review, testing, and AI adoption, and developers can vote on the areas they most want improved.
- Sentiment linked to metrics: In non-anonymous surveys, teams can filter productivity reports by how people answered, which connects what developers report to how their work moves.
What users say
In G2 reviews, one user said that Span’s productivity insights and hands-on support have built trust with their team:
“They have been very supportive in our mission to improve our productivity by giving us insights into time spent coding, team activity, and throughput. As a company, they’ve built trust by staying very close to our team, making product improvements as we’ve requested them, and the accuracy is very high.”
Not every user shares that confidence in accuracy, though. Another G2 user noted:
“The way the platform calculates its metrics can feel a bit too opaque, which sometimes raises questions about accuracy.”
8. Waydev
Waydev pairs recurring developer experience surveys with delivery metrics and AI ROI data, so teams can see how working conditions and AI tools affect their output.
What sets it apart: Its developer surveys pair team scores with industry benchmarks and annual cost estimates, which gives survey results a productivity value in hours and dollars.
Best for: Engineering organizations that want to put a time and dollar cost on developer experience problems and decide which to address first.
Key features
- Workflow cost estimates: Survey answers about workflows such as CI wait time and code comprehension are converted into hours per engineer per year, and into dollars when teams enter salary data.
- Driver scores and benchmarks: Recurring Slack surveys score working conditions such as review turnaround, deep work, and documentation. Each team’s results are compared with industry median and top-decile benchmarks.
- AI adoption and ROI: Waydev tracks which AI coding tools teams use, compares performance before and after adoption, and calculates the cost per shipped pull request.
What users say
Productivity data at several levels of the organization is what one G2 user appreciated:
“It is an extremely useful tool to have access to various levels of productivity at an individual level and team level.”
Every organization measures productivity a little differently, so setup involves some translation. Another user described the early learning curve this way:
“There is a bit of a learning curve at the beginning, especially when trying to align internal definitions (like what “productivity” or “impact” means for us) with the platform’s metrics.”
Related read → 14 Waydev Competitors & Alternatives for 2026
9. Typo
Typo connects ongoing developer feedback with SDLC and AI adoption data, so teams can see how their work and tools affect developer experience.
What sets it apart: Typo gathers developer feedback through short, anonymous AI-led chats, which it uses to find the areas that affect productivity and well-being most.
Best for: Teams with low survey response rates that still need frequent developer feedback tied to delivery and code quality data.
Key features
- Conversational check-ins: Typo checks in with developers each week through short, anonymous AI-led chats, which keeps feedback on developer flow and well-being current.
- Six-area DevEx framework: Results map to focus areas such as developer flow, development and releases, and AI impact. Teams can compare their scores with benchmarks for their industry and team size.
- Workload alerts: Typo watches commits, pull requests, and reviews for sustained high intensity compared with team averages, so managers can spot overload before it slows the team down.
What users say
Typo’s PR tracking and workload alerts come up together in this G2 review. The user relies on both to keep an eye on team productivity and health:
“This tool is quite helpful for tracking pull requests, monitoring team efforts, and identifying signs of burnout within the team.”
Some productivity metrics could use more explanation inside the app. Another G2 user wrote about the thresholds behind them:
“In some metrics, I had difficulty understanding, through the software, what thresholds were used to categorize each metric. Later I saw that the tool’s documentation is very helpful in providing this information, but I believe it could be more easily accessible.”
10. Weave
Weave gives engineering teams an output-based view of productivity, using LLMs to analyze each pull request and code review for scope, quality, and AI involvement.
What sets it apart: Its unit of measurement is the estimated time an experienced engineer would need for each change, which makes output comparable across teams and projects.
Best for: Teams that want a code-based view of engineering effort to complement developer feedback from other sources.
Key features
- Work type breakdown: The platform classifies each change as a feature, bug fix, refactor, or maintenance, so teams can see where their engineering time goes.
- AI attribution by pull request: Weave separates AI-written from human-written code in every change and shows which teams get the most from their AI tools, alongside what those tools cost.
- Code review insights: Weave tracks how much time engineers spend on code review and how helpful their reviews are, which makes review effort visible as part of productivity.
What users say
Weave doesn’t have any G2 reviews yet, so there’s no independent user feedback to quote.
Based on how the product works, its main appeal is a productivity measure that accounts for how complex each change is. A one-line config update and a week-long refactor count very differently, which gives managers a fairer view of output across teams.
The main trade-off seems to be scope. Weave doesn’t collect developer feedback, so teams that want to know how developers experience their work will need surveys from another source. Its time estimates also come from LLMs, so it makes sense to compare them with your own sense of effort before you use them in planning.
Related read → See how Jellyfish compares to Weave
How to Choose the Right DevEx Platform
How to Choose the Right DevEx Platform
Start with what slows your teams down most, or with what you need to measure, and use the matches below as a shortlist:
- If developer experience is one part of a broader productivity goal, Jellyfish connects it to delivery, AI adoption, and business outcomes in one platform
- If slow code reviews are the main complaint and you want to act on them through automation, LinearB is the stronger fit
- If you mainly want delivery metrics and early warnings in Slack, with surveys as an option later, Haystack is a lighter starting point
- If research-based survey methods and large industry benchmarks come first, DX (Atlassian) is the closest match
- If you want developers to see the same data as managers and work to shared team agreements, look at Swarmia
- If AI spend is under scrutiny, and you need to show what it returns in productivity, Faros deserves a look
- If you need to know how much of your code AI writes and how that work performs, Span measures it at the code level
- If finance wants hours and dollars attached to developer experience problems, Waydev is the logical option
- If survey fatigue keeps response rates low, consider Typo’s chat-based check-ins
- If you want output measured by the complexity of each change, consider Weave
Measure and Improve Developer Experience with Jellyfish
Measure and Improve Developer Experience with Jellyfish
Survey scores show how developers feel about their work, and delivery metrics show where that work slows down. Each one gives only half of the productivity story. To improve it, teams need both in one place, with a way to check every change against them.
Jellyfish DevEx brings developer surveys and engineering data into the same platform. Survey results connect to DORA, SPACE, and system metrics for the same teams, so a drop in sentiment can be traced to the workflows and tools behind it.
Jellyfish’s own engineering team saw this firsthand. Its first DevEx survey scored test automation at 26 out of 100, the lowest of 10 topics. One engineer then spent two weeks on the most tedious parts of the test environment, and the next survey put test automation at 58. Overall satisfaction and well-being rose 15% over the same period.
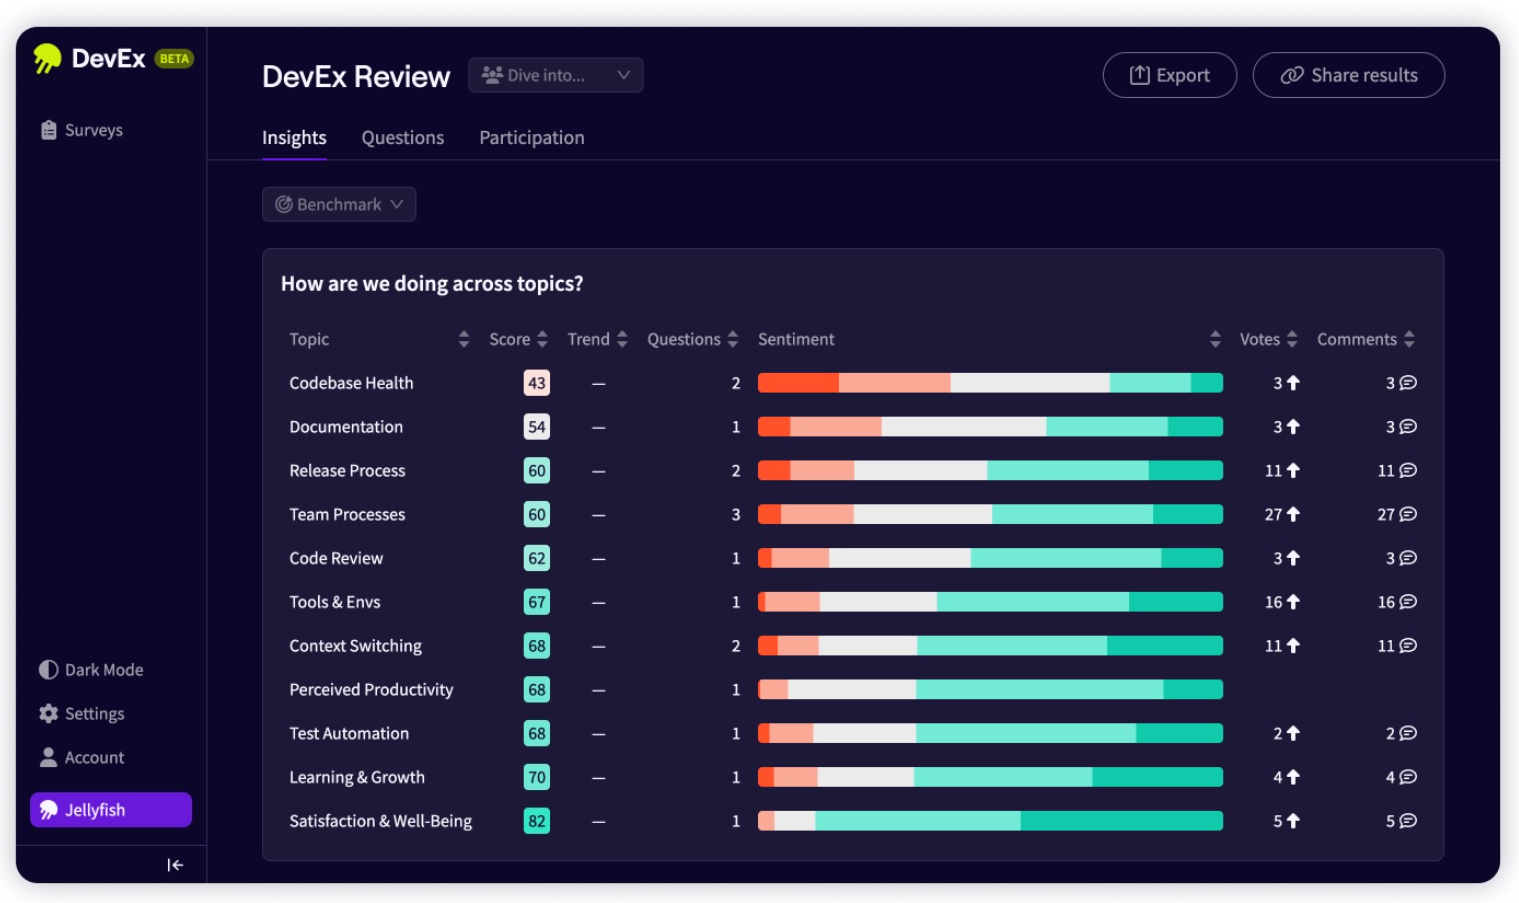
Each step of that loop has a matching capability in Jellyfish:
- Validated developer surveys launch in minutes and focus on the topics linked to developer productivity
- The DevEx Index gives each team a single score to track from one survey cycle to the next
- Correlation with DORA, SPACE, and system metrics connects each experience issue to the delivery data behind it
- Benchmarks put results in context across teams, roles, and industry peers
- AI recommendations and tracked actions suggest the next step and show whether it moved the numbers
- AI Impact shows how GitHub Copilot, Cursor, Claude Code, and other AI tools affect delivery and developer experience
With each survey cycle, teams can show which changes made developers more productive and decide where to invest next.
To see where developer experience affects productivity in your own organization, request a demo. You can also take a tour of the platform first.
FAQs
FAQs
How are DevEx platforms different from developer productivity tools?
Most developer productivity tools help developers do the work itself. Developers write and debug code in an integrated development environment like Visual Studio Code. Code search tools like Sourcegraph help them find their way around large codebases, and Postman supports API development and testing. Project management software like Jira keeps the work organized.
DevEx platforms measure how that work goes. They combine developer feedback with data from these tools to show where developers lose time and which changes improve productivity.
Can DevEx platforms show how tools like Kubernetes and Docker affect productivity?
DevEx platforms don’t monitor Kubernetes clusters or Docker containers, but they do measure how developers experience the environments built on them. Survey questions about the dev environment, build times, and ease of release show whether a move to containers made local setup easier or slower.
CI/CD data gives the system view, such as longer pipeline times after a team introduces SAST scans into its builds. Together, the two sources help teams decide whether a tooling change was worth its cost in developer time.
Do you need time tracking to measure developer experience?
You don’t need time tracking to measure developer experience. DevEx platforms get their data from developer surveys and from the systems teams already use, such as Git, issue trackers, and CI/CD pipelines.
Some surveys ask developers to estimate how long common tasks take, such as build waits or code review delays. Those answers are usually reported at the team level and used to find slowdowns across the team.
About the author

Lauren is Senior Product Marketing Director at Jellyfish where she works closely with the product team to bring software engineering intelligence solutions to market. Prior to Jellyfish, Lauren served as Director of Product Marketing at Pluralsight.


