In this article
Swarmia is well known for taking a clear position against individual developer metrics, with DORA metrics, investment balance, and team-set working agreements built around team-level data. Slack notifications on stale pull requests reach developers without a dashboard, which is why mid-market teams adopt it quickly.
When it comes to complaints, customization is the most common one on G2. Swarmia collects a defined set of data points, and users describe not being able to combine them into a view of their own. Recent releases have added custom reports and an AI query interface, so how far this still applies depends on when you last looked.
Incident data is the second. MTTR is calculated from deployment history rather than pulled from tooling like PagerDuty, so the recovery number won’t match what your on-call team works from.
“I’m disappointed that Swarmia is missing the MTTR (Mean Time to Recovery) metric stats from an incident management perspective. Ideally, these metrics should be based on data from tools like PagerDuty, where the time to recovery would accurately reflect how long it takes us to recover from incidents.”
Both issues limit what you can report and how much confidence you can put behind it, and they are not the only ones. We cover the rest below, along with 13 alternatives that address them, evaluated against a consistent set of criteria.
Why Look for an Alternative to Swarmia?
Why Look for an Alternative to Swarmia?
These points come from verified G2 reviews. Some describe permanent product decisions, others depend on your team size and setup, and a few have been partly addressed in recent releases.
- Pricing may cover more people than you’re measuring: Swarmia’s per-developer pricing follows GitHub organization membership, which means contractors, occasional contributors, and service accounts can count toward the total. For teams where nearly everyone in the org is being measured, this is a non-issue. Organizations with a wide gap between GitHub membership and the group they want visibility into may want to compare how other platforms define a billable user. [Read Full G2 Review]
- Reporting customization may still feel opinionated: Some users describe Swarmia’s dashboards as too prescribed for how they want to analyze their data. That needs qualification today, since Swarmia has since added custom reports, computed metrics, configurable visualizations, and Swarmia AI. Teams with highly tailored reporting requirements may still want to compare how much flexibility competing platforms offer. [Read Full G2 Review]
- Configuration takes ongoing maintenance: Swarmia sets up quickly, but users note that maintaining the configuration is a separate job once teams start moving. Organizations that frequently reorganize should factor in who owns the upkeep. [Read Full G2 Review]
- Recovery metrics are calculated from deployments: Swarmia derives MTTR from deployment history, treating a deploy that fixes an earlier deploy as the recovery event. That works for teams whose incidents are resolved through deploys. Organizations running on-call via PagerDuty or Opsgenie, or resolving incidents with rollbacks and feature flags, may want to compare platforms that integrate directly with incident-management tooling. [Read Full G2 Review]
- Notification controls may not match every team structure: Swarmia’s Slack notifications are one of its better-reviewed features, though some teams report they couldn’t narrow team-level notifications down to the repositories relevant to them, so they received alerts about work they had no part in. Teams with complex repository ownership should check whether the available controls fit how their ownership is organized. [Read Full G2 Review]
- Finding the right data can take some getting used to: One reviewer describes the interface as confusing and says they struggle to relocate reports they’ve used before. Swarmia has since reorganized its navigation, so experiences may vary by user and product version. For teams rolling this out to a broad group of managers and developers, ease of discovery is worth testing during a trial. [Read Full G2 Review]
Key Features to Look for in a Swarmia Alternative
Key Features to Look for in a Swarmia Alternative
Engineering intelligence platforms describe themselves in similar terms. The differences appear in how they collect data, who can build reports, and what happens once you scale.
The six criteria below cover that ground, and they structure every profile below.
Engineering and Delivery Insights
Look at what the platform measures and where the data comes from. Most products in this category report DORA metrics and cycle time, but they calculate them differently.
Some infer deployments from merges to the main branch, others read your CI/CD system directly, and the resulting numbers can differ. Check how each one calculates deployment frequency and change failure rate, and whether you can trace a summary figure back to the pull requests behind it.
Integrations and Data Coverage
Take the list of systems you want covered and work through each vendor against it. Source control and issue tracking rarely cause problems.
What varies is whether the platform connects to your CI/CD system, your incident management tool, your HR system for headcount data, and whichever AI coding assistants your engineers use.
Each missing connection costs you a set of metrics. A platform that can’t read your incident tool will estimate recovery time from deployment history instead.
Reporting and Customization
Different stakeholders rarely need the same view of engineering data. Team leads care about workflow bottlenecks, while executives want portfolio-level trends and business outcomes.
Check whether you can adapt dashboards, metrics, filters, and reports to each audience. This matters more in larger organizations, where teams follow different workflows and leadership expects reporting that matches how the company runs.
Business Alignment and Investment Visibility
Engineering leaders need to know where development time is going, not just how quickly work moves through the pipeline. A good Swarmia alternative should make it easy to see how engineering effort maps to products, initiatives, roadmap priorities, or other areas the business cares about.
That gives leadership a clearer view of what teams are investing in, how much capacity goes toward new development versus maintenance, and whether engineering work is lining up with the priorities the company has set.
Team Adoption and Workflow Fit
Adoption drives the value you get from any of these platforms, so it helps to think about how the tool fits your existing workflows, how much configuration it needs up front, and whether insights reach developers and managers where they already work.
Slack and Teams notifications, automated alerts, working agreements, and workflow recommendations all serve that purpose. The right setup supports your teams without flooding them with alerts or forcing them into a rigid process.
Security, Privacy, and Deployment Options
Engineering platforms connect to some of an organization’s most sensitive systems, including source code repositories, project management tools, and internal delivery data. Security and governance belong in the buying decision from the start.
Check access controls, data handling, compliance certifications, hosting options, and deployment requirements. Enterprise organizations often need more than the defaults here, whether that means granular permissions, regional data storage, or a deployment model their security policy already allows.
The 13 Best Swarmia Alternatives and Solutions for Engineering Teams
The 13 Best Swarmia Alternatives and Solutions for Engineering Teams
Here is how the 13 platforms compare at a glance. Full profiles follow, with features, advantages, and limitations for each.
| Platform | Best for | Key differentiator |
| Jellyfish | Companies proving AI ROI and engineering spend to leadership | The broadest coverage on this list, from allocation and AI impact through to audit-ready software capitalization |
| LinearB | Teams where code review is the main bottleneck | gitStream applies automated pull request policies written in YAML |
| DX (Atlassian) | Organizations that put developer experience at the center of productivity measurement | Research-backed DXI score that converts friction into hours lost per developer |
| Faros AI | Large enterprises with fragmented or non-standard engineering toolchains | Over 100 integrations with no requirement to standardize team processes |
| Harness AI DLC Insights | Teams already running Harness for CI/CD | Custom metrics written in JavaScript, plus multiple org trees per account |
| Code Climate Velocity | Large organizations that want a more customized, hands-on SEI engagement | Forward Deployed Engineers running scoped twelve-week engagements |
| Plandek | Enterprises with complex delivery structures and established measurement models | Reporting by value stream and release train, with Capex and Opex allocation |
| Waydev | Engineering leaders who want to explore data through questions and custom analysis | Editable SQL behind every insight, plus cost per pull request |
| Allstacks | Product and engineering organizations that need stronger delivery predictability | Forecasting models trained on your own delivery history |
| Haystack | Teams focused on delivery operations and capacity planning | Capacity estimation drawn from actual delivery history |
| Typo | Mid-sized teams that want analytics and code review together | LLM code review with suggested fixes inside the pull request |
| GitView | Teams that want lightweight, Git-centered engineering analytics | Transparent metric calculations with raw SQL access |
| Oobeya | Regulated and Microsoft-centric organizations | IDE-level AI code attribution and local LLM support |
How this list works → Every tool here competes with Swarmia in the same buying process. We left out general DevOps platforms, CI/CD tools, and products that have since been acquired or discontinued, since none of them replace what Swarmia does.
Each entry gets assessed against the same six above, and the limitations come from verified G2 and Gartner reviews, linked so you can read the full context. The numbering groups similar tools together and does not rank them. Start with the comparison table, and then read the profiles that fit your situation.
1. Jellyfish
Jellyfish is a software engineering intelligence and AI impact platform that connects delivery work to what it costs and what it produces.
It handles allocation, developer experience, AI measurement, and software capitalization, with data from source control, issue trackers, CI/CD, cloud infrastructure, AI coding assistants, HR, and finance.
How it compares to Swarmia → The scope is wider. Swarmia focuses on team delivery, while Jellyfish extends into allocation, financial reporting, and AI impact for organizations that need all three from one platform.
When Jellyfish is the right choice for your team → Jellyfish suits engineering organizations where leadership has to defend spend, headcount, and AI investment to people outside engineering. If your reporting audience includes a CFO, a board, or an audit process, this covers ground that team-level tools leave open.
Key Features
- AI impact measurement from adoption to ROI: Jellyfish tracks token usage by model against cost by tool, then connects that spend to throughput, cycle time, and quality outcomes. Its own benchmark data shows companies in the top quartile of AI adoption merging roughly twice the pull requests of low adopters, which gives you a reference point.
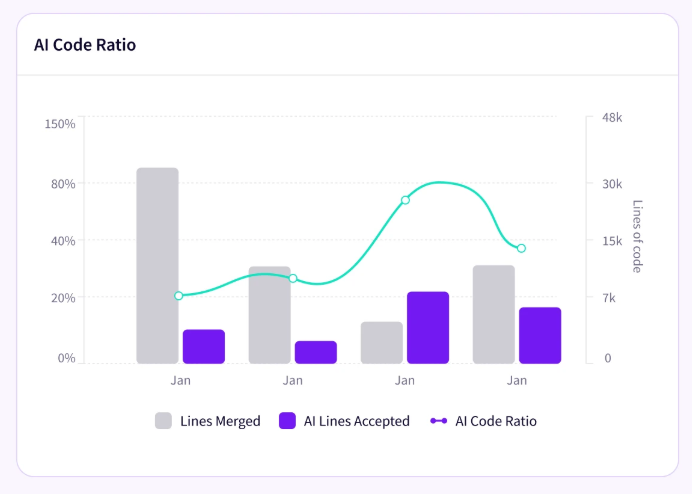
- Investment allocation tied to strategic initiatives: Work maps to initiatives and business-as-usual with clear percentages, so you can show where engineering time went and what it supported. Executive dashboards drill from portfolio down to team and repository, which means the same view answers both the board question and the follow-up.
- Developer experience mapped to outcomes: The platform attaches what developers report onto what the systems record. When a team says code review is slow and the data confirms it, you have both the evidence and the reason, which is a stronger case than either on its own.
- Software capitalization as a byproduct: Jellyfish stacks cost data over engineering signals and generates capitalization reporting from how teams already work. Finance gets audit-ready output without asking developers to complete timesheets.
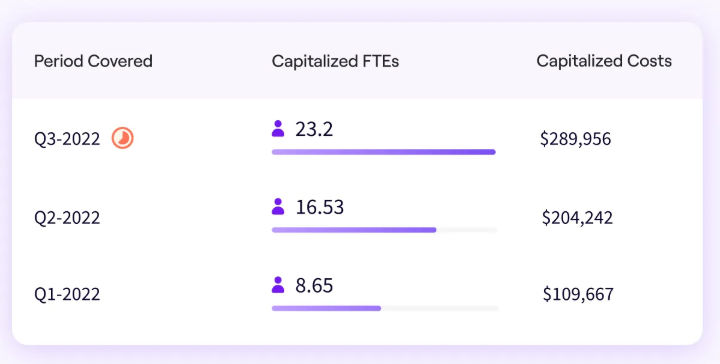
- Jellyfish Assistant and MCP: The Assistant answers questions about your engineering data in natural language and returns contextual guidance. The MCP server exposes the same data to Claude, Cursor, and other MCP-compatible tools, so leaders can query engineering intelligence from wherever they already work.
Why Do Companies Choose Jellyfish Over Swarmia?
- A more finance-oriented view of engineering: Jellyfish goes further into the financial side of R&D, including engineering cost data and workflows around software capitalization. That makes it a better fit when engineering reporting regularly feeds finance, audit, budgeting, or board conversations instead of staying inside the engineering organization.
- Deeper AI cost measurement: Both platforms report AI adoption. Jellyfish goes further into token usage by model and cost by tool, then connects that spend to changes in throughput, cycle time, and quality. If you have to justify a growing AI line item to a CFO, adoption numbers alone will not carry that conversation.
- Broader data coverage: Swarmia works cleanly with source control, issue trackers, and AI coding tools. Jellyfish also reads from cloud infrastructure, HR, and finance systems, which is what makes cost-per-team and capitalization possible. Setup takes longer as a result, so weigh that against how much of your stack falls outside GitHub and Jira.
- More natural when engineering data has to serve several functions: Jellyfish combines engineering signals with people and financial context, so the same data works for engineering, product, finance, and executive audiences. Swarmia has the stronger team-improvement side through working agreements and workflow nudges. Jellyfish makes more sense when cross-functional leadership reporting is the bigger requirement.
- A wider reporting lens than team and repo: Swarmia’s model is built around teams and repositories, which works well when your questions concern how a squad operates. Jellyfish maps effort to strategic initiatives with percentages, so you can say what a quarter of engineering investment produced against the roadmap.
What Real Customers Are Saying about Jellyfish
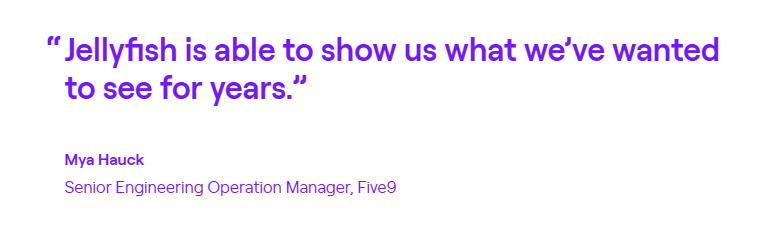
A merger left Five9 with more than 400 engineers across DevOps, Engineering, and Operations, and no way to tell how the combined organization was doing. Jellyfish broke performance down team by team, and the sprint predictability data pointed directly at where improvement plans were needed.
Clari came to Jellyfish with slipping timelines and no clear picture of where engineering hours were going. The data pointed at maintenance work quietly absorbing capacity meant for the roadmap. On-time delivery climbed from 67% to 79%, and their software capitalization process became 50% more efficient along the way.
For Acoustic, benchmark comparisons showed support work consuming a share of engineering time well beyond the industry norm, at the expense of roadmap delivery. They reorganized around what the data showed and brought in contractors where it made sense, ending up with delivery predictability 35% higher and $80,000 less spent on contractors.
2. LinearB
LinearB is a software engineering intelligence platform that pairs delivery metrics with a pull request automation engine called gitStream.
Teams use it to track DORA and cycle time data, then apply YAML-defined rules that route reviews, label PRs by risk, and auto-merge changes that meet the criteria they set.
How it compares to Swarmia → Both platforms report on delivery, but Swarmia stops at the insight, and LinearB acts on it through automated PR policies.
When LinearB is the right choice for your team → LinearB fits engineering organizations that want automation alongside measurement. If your review process varies team by team and you want a single set of rules applied everywhere, this is the strongest option on the list.
Key Features
- gitStream PR automation: You define rules in YAML that assign reviewers by file ownership or expertise, apply labels with estimated review time, and auto-merge low-risk changes. The rules exist in your repositories as config, so you version and review them the same way you handle code.
- Broad Git provider support: LinearB covers GitHub, GitLab, Bitbucket in both cloud and server editions, and Azure DevOps, with on-premises sensor deployments for organizations that cannot send data to a vendor cloud.
- AI adoption analytics: The platform connects to Claude Code, Copilot, Cursor, and Amazon Kiro to measure AI-assisted development activity. You can adjust the threshold that classifies a commit or pull request as AI-assisted, which matters because the 50% default will not match how every team works.
Advantages
- Team-level visibility with benchmark context: Teams say the platform makes it easy to spot which groups are on track and which need attention, without much digging. Full DORA support with built-in benchmarks gives that comparison a reference point, so you can see progress in context. [Read Full G2 Review]
- Organization-wide performance in one view: Engineering leaders say that the organization-level views show them how teams are performing and where the health issues sit, without a team-by-team review. That becomes more useful the more teams you have. [Read Full G2 Review]
Limitations
- Executive summaries may need some extra work: The depth that makes LinearB useful day to day can get in the way when you report upward. Some teams describe difficulty condensing the detail into something a senior audience can absorb, and ask for a scorecard-style report with benchmarks built in. How much this affects you depends on how often you present outside engineering and how much time you can spend assembling those summaries by hand. [Read Full G2 Review]
- Some metric views use different time windows: Some metrics display by sprint and others by week, so a side-by-side comparison across teams can mean you adjust the date picker manually to match your sprint length. Teams rate the metrics themselves well, and the problem is only how they line up. Organizations on a consistent sprint cadence across all teams will notice this more than those with varied working patterns. [Read Full G2 Review]
Learn more → 8 Best LinearB Alternatives & Competitors on the Market Now
3. DX (Atlassian)
DX is an engineering analytics platform built by the researchers behind DORA, SPACE, and DevEx, and now part of Atlassian.
It combines system telemetry with developer survey data through its own frameworks, the DX Core 4 and the Developer Experience Index.
How it compares to Swarmia → Swarmia treats survey data as a complement to its delivery metrics, while DX treats it as a primary measurement with research behind how each driver connects to financial outcomes.
When DX is the right choice for your team → DX makes sense for teams that want a broader view of developer productivity across both workflow data and developer experience. It is particularly useful when leadership wants to measure AI ROI, benchmark performance, and understand why productivity changes.
Key Features
- DX Core 4 and the Developer Experience Index: The Core 4 framework pulls DORA, SPACE, and DevEx into four dimensions of speed, effectiveness, quality, and impact. The DXI scores 14 drivers behind effectiveness and ties each point of movement to time saved per developer.
- AI Measurement Framework: DX tracks how much your teams use AI tools, what those tools change in your Core 4 metrics, and how the spend compares to the time gained. TrueThroughput weights pull requests by complexity, and PR revert rate works as a quality check against any rise in output.
- Direct Benchmarking: You can compare your organization against specific peer companies and industry segments instead of a generic industry average. DX pulls data from hundreds of engineering organizations, which gives the comparison more weight than a benchmark built from a smaller sample.
Advantages
- Snapshots make progress visible between rounds: Teams say the Insights tab and Snapshots view make it clear which drivers need attention, with comparisons against both the wider company and the industry. That structure supports concrete decisions. One team set a no-meeting policy on Wednesdays to protect deep work and brought engineers into planning earlier with product and design, then watched the results arrive in the next Snapshot. [Read Full G2 Review]
- Data that works in both directions: Engineering managers say the platform works two ways. You can bring a theory about a team and check it against the data, or find something in the data that sends you to investigate a problem or a success you had not noticed. The same evidence helps when you need to persuade peers or leadership who read a situation differently. [Read Full G2 Review]
Limitations
- Some teams find the heatmaps hard to distinguish visually: Some teams find the heatmap difficult to interpret, with colors close enough that the differences between values do not stand out. The same feedback asks for somewhere in the platform to store analyses and action plans, so teams can track what they decided and compare it against later rounds. Organizations that already keep that record elsewhere will feel this less. [Read Full G2 Review]
- Group filters may behave differently across reports: The Teams and Groups concept is useful, though the experience varies across the platform. Some reports support group selection, others don’t, and default selections do not always hold. Teams ask for one global filter that applies everywhere, which would matter most to organizations with many teams and frequent switching between views. [Read Full G2 Review]
Learn more → 12 Best GetDX Alternatives for Engineering Teams Heading Into 2026
4. Faros AI
Faros AI is a software engineering intelligence platform built for large organizations with fragmented toolchains.
It pulls from over 100 sources without asking teams to standardize how they work, then layers analytics, benchmarks, and AI impact measurement on top.
How it compares to Swarmia → Swarmia works well with a standard GitHub and Jira setup, while Faros AI targets organizations where the toolchain sprawls across dozens of systems and no two teams work the same way.
When Faros AI is the right choice for your team → Faros AI fits enterprise organizations with hundreds or thousands of developers and a toolchain that spans many systems, including custom and on-premise ones.
Key Features
- Integration across 100+ SDLC tools: Faros AI connects to source control, issue trackers, CI/CD, incident management, and survey data, along with custom and on-premise sources. It normalizes all of it without requiring teams to standardize their processes first.
- Token intelligence: The platform tracks AI token spend by team, tool, and model, then classifies each session by how productive it was. You can see which tool and model pairings work best for particular kinds of work.
- Modular licensing: You buy the modules you need, whether that means engineering productivity, software quality, DORA maturity, initiative tracking, AI evaluation, or R&D cost capitalization.
Advantages
- Flexibility with custom and non-standard metrics: Teams describe a level of flexibility that lets them connect data sets they could not correlate before, with less effort than tools like Power BI required. One team spent over a year building organizational insights that combine standard CI/CD and DORA metrics with internally generated ones, and the platform handled most of the underlying logic. [Read Full G2 Review]
- Responsive guidance from the vendor: Customers point to how closely the Faros team works with them. Users describe a vendor that takes time to understand the requirements up front, keeps setup simple, and responds quickly with guidance and recommendations once you are running. [Read Full G2 Review]
Limitations
- Setting up an organizational structure can be difficult: Faros can be difficult to configure at the start, particularly when you decide how to represent an organizational structure with several levels. Customers who raise this also credit the Faros team with helping them work through it. Companies with simpler hierarchies will find this easier, and the flexibility that causes the difficulty is the same flexibility teams praise elsewhere. [Read Full G2 Review]
- Large dashboards have historically loaded slowly for some teams: Some G2 feedback mentions longer load times on data-heavy dashboards, which may matter more in large deployments with many connected sources. Faros introduced a major dashboard-performance update in 2025 that it says significantly reduced load times, so teams evaluating the platform today should test this against their own data volume. [Read Full G2 Review]
Learn more → 8 Faros AI Competitors & Alternatives for 2026
5. Harness AI DLC Insights
Harness AI DLC Insights is the engineering intelligence module of the Harness software delivery platform. It pulls from over 40 DevOps sources, computes DORA and more than 100 additional metrics, and adds its own Trellis framework, which scores productivity across 20+ factors.
How it compares to Swarmia → Swarmia works as a standalone product, while Harness comes as one module in a delivery platform that also covers CI/CD, feature flags, security testing, and cloud cost.
When Harness SEI is the right choice for your team → Harness AI DLC works for enterprise teams that need custom metrics and strict access controls. If you already own other Harness modules, the shared platform removes a separate procurement and integration effort.
Key Features
- Trellis productivity framework: Trellis scores developer and team productivity across more than 20 factors pulled from your SDLC tools. It produces a report that points to specific areas where productivity could improve.
- Custom metrics in JavaScript: You can write your own JavaScript to calculate metrics from the metadata SEI collects. This goes further than most platforms in the category, which typically limit you to combining predefined fields.
- Org trees for complex structures: The platform lets you build multiple org trees in one account, so you can represent business units, geographies, or alternative views of the same organization. Each tree carries its own profiles, which map metrics to the right teams and roles.
Advantages
- Industry comparison gives leadership context: The benchmark comparisons against industry standards make conversations with leadership more productive. A number carries more weight when you can show where it sits against comparable organizations, which helps when you explain engineering performance to people who have no internal reference point. [Read Full Gartner Review]
Limitations
- Flexible setup puts more responsibility on configuration: Some customers report that the product takes time to learn and that incorrect setup can lead to misleading results later. That matters most for organizations that build detailed org structures, profiles, and custom metrics, although Harness has continued to overhaul this area through AI DLC Insights and its newer Org Tree model. [Read Full Gartner Review]
Note for the reader → Because SEI sits inside a larger platform, most Harness reviews discuss pipelines and deployment instead of engineering analytics. The evidence base for this module is smaller than for the standalone products here.
Learn more → 8 Harness Competitors & Alternatives for 2026
6. Code Climate
Code Climate is an enterprise software intelligence platform built around Velocity, which reads delivery data from source control and Jira and reports on more than 60 metrics.
After spinning its Quality product out as a separate company called Qlty Software, Code Climate now works exclusively on engineering intelligence for large organizations.
How it compares to Swarmia → Swarmia offers a more standardized product centered on team-level engineering effectiveness, while Code Climate takes a more customized, services-led approach for large enterprises with complex workflows and transformation goals.
When Code Climate Velocity is the right choice for your team → Code Climate works best for complex enterprises that want engineering intelligence combined with hands-on implementation and strategic guidance.
Key Features
- 60+ metrics with drill-down reporting: Velocity covers DORA metrics, PR cycle time, code review patterns, team capacity, and throughput. Reports let you view organization-wide trends for any metric, then filter by team or application and group results by contributor, team, application, or repository.
- Team360 and Workstreams: Team360 shows whether a sprint is on track, finds high-risk work in the pipeline, and tracks improvement over time. Workstreams puts Git and Jira data side by side so managers walk into stand-ups with a clearer view of what each team is dealing with.
- Goal tracking against OKRs and KPIs: You can tie engineering metrics to specific goals and track progress toward them, which connects day-to-day delivery data to the commitments your organization made at a planning level.
Advantages
- Fast visibility was a strength of the prior Velocity experience: Customers using Velocity highlighted how quickly GitHub and Jira data exposed cycle-time and review bottlenecks. Code Climate now delivers a more customized enterprise SEI engagement, so onboarding and reporting may look different for new customers today. [Read Full Gartner Review]
- Connecting your development tools is simple: Data integration comes up as a positive. Teams say the connection to their existing development tools went smoothly. [Read Full Gartner Review]
Limitations
- Older Velocity feedback suggests metrics sometimes needed extra context: Some customers of the previous Velocity product found that outlier work could distort trend lines, which meant they had to inspect the underlying data before using a metric in leadership reporting. Code Climate has since replaced Velocity with a customized SEI offering, so buyers should verify how the current platform handles outliers, drill-downs, and contextual analysis in their own implementation. [Read Full Gartner Review]
- Historical filtering should be checked against your reporting needs: Earlier Velocity feedback described limits around filtering historical data, which could make longer-term comparisons harder for teams that rely heavily on trend analysis. But because the current offering is customized for each enterprise, that older limitation should not be assumed to apply unchanged today. Teams that need multi-quarter or year-over-year analysis should confirm the available filtering and retention options during evaluation. [Read Full Gartner Review]
Note for the reader → Code Climate has removed its G2 profile, which means less public review coverage than most platforms on this list. We sourced the points above from Gartner Peer Insights instead.
Learn more → The Top 7 Alternatives to Code Climate Velocity for 2026
7. Plandek
Plandek covers value stream management and engineering intelligence in one platform, with hundreds of metrics available across delivery, AI impact, and productivity.
Teams build custom dashboards, define their own metrics, and combine engineering data with finance, HR, or customer data through the API.
How it compares to Swarmia → Swarmia gives you a defined metric set that works out of the box, while Plandek lets you define your own metrics and combine engineering data with finance or HR data through its API.
When Plandek is the right choice for your team → Plandek is a strong fit for teams with complex delivery workflows that want deep control over how they measure productivity and delivery performance. It’s especially useful for those that need broad toolchain coverage, custom metrics, and predictive insight across multiple teams or business units.
Key Features
- Flexible workspaces across the delivery structure: Metrics can be viewed at multiple levels of the organization, including by product, value stream, or release train. Teams working in scaled Agile environments can report at the level their framework operates at, without forcing everything into a team-shaped view.
- Capex and Opex allocation: Plandek tracks how value, throughput, and resource distribute across roadmap initiatives, lines of business, and value streams, and splits delivery between Capex and Opex.
- Developer experience surveys alongside system metrics: Plandek runs surveys to capture how developers experience their work and what slows them down. Combining that with delivery data gives you both the measured behavior and the reasons behind it.
Advantages
- Transparency across sprints and projects: Many teams give Plandek credit for transparency. You can see how a sprint is progressing without building anything, and the same view covers larger project timelines. [Read Full G2 Review]
- Automated reporting tied to business outcomes: Connections to Jira, GitHub, and Azure DevOps make the reporting automatic once configured. Users note that the platform ties engineering metrics to business outcomes, which supports the kind of decision-making that needs evidence behind it. [Read Full G2 Review]
Limitations
- Data-source context may not always be obvious to non-admins: Reports can arrive without enough context about where the data came from. Teams have flagged that they cannot easily tell whether a team is running Sprint or Kanban, which affects interpretation. The settings exist at the administrator level, so this affects organizations where project owners and admins are different people. [Read Full G2 Review]
- Iteration metrics pull in unwanted work item types: Filtering causes problems in the iteration metrics. Test cases and test steps come through alongside features, stories, and bugs, and teams describe no straightforward way to exclude them. The effect is metrics that read higher than the delivery work behind them. [Read Full G2 Review]
Learn more → 8 Plandek Competitors & Alternatives for 2026
8. Waydev
Waydev is a Y Combinator-backed engineering management platform that recently rebuilt itself as an AI-native product.
It answers what your AI coding spend produced, from tokens consumed to code that shipped, and reports DORA, SPACE metrics, and developer experience data in the same place.
How it compares to Swarmia → The difference is depth on AI. Swarmia tells you which tools your teams use, and what the licenses cost, while Waydev traces token spend down to individual pull requests.
When Waydev is the right choice for your team → Waydev fits teams that prefer questions over dashboards, and organizations with on-premises requirements, since deployment inside your own environment is available.
Key Features
- Waydev Agent with editable SQL: Teams ask questions in natural language and get answers back with the SQL query attached, which you can review, edit, and rerun.
- AI adoption, impact, and ROI tracking: Waydev covers which tools teams use and how deeply, whether AI-written code ships or gets reverted, and what the spend produced across humans, assistants, and autonomous agents.
- Token and cost measurement: The platform tracks token consumption and calculates cost per pull request and per team. That gives you a unit economics view of AI-assisted development.
Advantages
- Depth of analysis without dashboard building: Delivery speed, review cycles, and quality metrics are all in one place, and users say that the more valuable part is working out why the numbers moved. Asking a question in the platform replaces the work of building a dashboard to answer it. [Read Full G2 Review]
- Leadership-ready reporting on AI ROI: Adoption tracking by developer and team comes with the outcome data attached, which is what makes it useful in an executive conversation. Teams describe dashboards clear enough to present without first digging through the underlying numbers. [Read Full G2 Review]
Limitations
- Aligning your definitions with the platform takes time: Some users report an initial learning curve as they align their own definitions of productivity and impact with Waydev’s metrics. For teams with an established internal measurement framework, that can mean more calibration work before the first reports feel trustworthy. [Read Full G2 Review]
- Some users have wanted more control over AI-specific reporting: G2 feedback suggests that teams have not always been able to shape AI insights differently for engineering and executive audiences. Waydev now offers extensive custom dashboards, metrics, and reporting, and it shipped additional dashboard improvements in 2026, so buyers should verify how much of that flexibility now extends to the AI-specific views they plan to use. [Read Full G2 Review]
Learn more → 14 Waydev Competitors & Alternatives for 2026
9. Allstacks
Allstacks is a software engineering intelligence and orchestration platform for product and engineering teams. It normalizes data across the SDLC, adds organizational and product context, and uses that foundation for delivery analytics, AI impact measurement, forecasting, and engineering economics.
How it compares to Swarmia → Where Swarmia reports what happened, Allstacks predicts what will happen, using machine learning trained on your organization’s own delivery history.
When Allstacks is the right choice for your team → Allstacks makes sense if delivery predictability is your problem, particularly when you commit to dates in front of customers or a board. The forecasting runs on your own historical data, so the estimates improve as the platform accumulates more of your delivery record.
Key Features
- Delivery risk agents with root cause analysis: Agents investigate every initiative continuously, surface risks weeks before a date slips, and trace causes across teams and tools. They also create tickets and assign follow-ups.
- ML forecasting on your own history: Completion dates come from models trained on how your teams have delivered before. Capacity constraints and scope changes feed into the same forecast.
- Product Studio and spec readiness: Product Studio gives product and engineering a shared workspace for requirements, with an adversarial AI reviewer that scores each spec against engineering feasibility, team capacity, security, and historical rework rates.
Advantages
- Cross-tool visibility without constant context switching: Allstacks gives teams one place to follow project health across systems such as Jira and GitHub instead of piecing the story together manually. That broader view can save engineering leaders time and make stakeholder updates easier when delivery data already sits in one place. [Read Full G2 Review]
- Actionable insights that translate into workflow improvements: Some users highlight how easy it is to move from the dashboards into practical changes, particularly around pull request cycle time and delivery efficiency. The interface appears accessible enough that managers do not need to be analytics specialists to spot where a workflow deserves attention. [Read Full G2 Review]
Limitations
- Setup can feel broad before it feels focused: Some users say the initial experience takes time because Allstacks exposes a large number of integrations and metrics. Teams with simpler reporting requirements may get through that quickly, while larger organizations may need more deliberate configuration before dashboards mirror how they manage delivery. [Read Full G2 Review]
- Per-team reporting may take additional configuration: One team needed to build filtered views for each product group so people did not have to keep filtering an organization-wide view themselves. Current Allstacks features include saved custom views, dynamic filters, and customizable dashboard components, which may reduce that friction today, but it is still worth testing if you have a large number of teams with different reporting needs. [Read Full G2 Review]
Learn more → The Top 7 Alternatives to Allstacks for 2026
10. Haystack
Haystack is a delivery operations platform for product and engineering leaders, built on Jira and Git data. It handles org-wide metrics, initiative tracking, and investment visibility, with automated risk detection and reporting that goes out to Slack.
How it compares to Swarmia → The two share a philosophy on transparency, since Haystack also refuses individual scorecards, and customers specifically credit it for showing teams the same data executives see.
When Haystack is the right choice for your team → Haystack suits mid-sized engineering organizations with a Jira and GitHub stack. Bear in mind the company is small, so weigh that against your procurement requirements and support expectations.
Key Features
- Change lead time broken into components: Haystack splits its North Star metrics into the parts underneath them, so change lead time separates development from code review, and review time breaks further into first response, rework, and idle completion.
- Automated risk detection and alerts: The platform watches for anomalies, finds potential issues, and sends alerts on burnout risk based on throughput patterns. Notifications and reports go into Slack, so managers get them without a separate login.
- Capacity estimation for planning: Customers point to capacity data as the feature that changed quarterly planning for them. Estimates come from actual delivery history and not what teams think they can commit to.
Advantages
- Clear, hands-on onboarding: Users point the onboarding process as one of Haystack’s stronger points, particularly the way the team explains the product and its metrics in detail. That can shorten the time it takes engineering managers to understand what they are looking at and start using the platform with confidence. [Read Full G2 Review]
- Top-down view with drill-down to the cause: Customers value the top-down structure, where North Star metrics give you the overall picture and then break down far enough to show which part of the lifecycle is slowing things. [Read Full G2 Review]
Limitations
- Older feedback mentions occasional interface slowness: Some G2 feedback from 2022 describes the web interface as slow at times and asks for a more modern experience. That review is several years old, so it should not be treated as proof of the current UI, but teams evaluating Haystack today may still want to test responsiveness with their own data volume and workflows. [Read Full G2 Review]
- DORA filtering was limited in older versions: One 2022 user said global pull-request filters did not let them apply different filters to individual DORA metrics, which mattered while their organization was moving toward continuous delivery and needed to separate stages. Because that feedback predates the current product by several years, buyers with complex DORA definitions should verify how granular metric-level filtering works today rather than assume the limitation still applies. [Read Full G2 Review]
Note for the reader: Public review coverage for Haystack has thinned out since around 2022, which means the feedback here is older than what we have for other tools on this list. Verify anything that matters to you directly with the vendor.
Learn more → 8 Haystack Competitors & Alternatives for 2026
11. Typo
Typo brings engineering analytics and AI-assisted code intelligence into one platform. It tracks DORA and workflow metrics, measures how tools such as Copilot, Cursor, and Claude Code affect development, and adds automated review and quality analysis directly at the pull request level.
How it compares to Swarmia → Code review is the clearest difference, since Typo comments on pull requests directly while Swarmia measures how long they take.
When Typo is the right choice for your team → Smaller and mid-sized teams get the most here, particularly those between 50 and 500 engineers. The free tier below ten developers also makes it a reasonable place to start before committing budget.
Key Features
- AI-origin code tracking. The platform distinguishes AI-generated code from human-written code and measures LLM rework, review noise, and where quality drifts as AI output increases. That gives you a read on whether faster generation is creating downstream cost.
- Anonymous DevEx check-ins: Developers get a weekly conversational pulse survey through a chatbot, and Typo publishes insights once two or more responses come in. Anonymity and the conversational format tend to produce better response rates than a quarterly survey form.
- Fast setup across the stack: Connections to Git, issue trackers, CI/CD, incident management, calendars, and Slack take under a minute according to the vendor. Several customers describe replacing homegrown scripts and Grafana dashboards with it.
Advantages
- Code review and analytics from one platform: Users point to the quality checks running directly in the PR workflow, which means no separate tool for engineers to visit. That the same platform also handles delivery analytics is what makes the pairing worth having. [Read Full G2 Review]
- The AI reviewer holds up against dedicated tools: The combination of engineering analytics and automated code checks gives teams a broader picture than either layer would provide on its own. Leaders can follow delivery efficiency while developers get more immediate feedback on the quality of the changes behind those metrics. [Read Full G2 Review]
Limitations
- Some teams want more reporting flexibility: Teams with unusual workflows or more complex reporting requirements want more control over dashboards and reports. Typo currently supports customizable dashboards, widgets, and saved templates, so this appears to be more about the depth of customization available for specific use cases than a lack of customization altogether. [Read Full G2 Review]
- Metric thresholds are not always obvious in the interface: One user found it difficult to tell how Typo classified certain metric values until they checked the documentation, where the definitions were explained more clearly. The underlying information is available, but teams that want managers to interpret metrics without referring to separate documentation may want clearer in-product context around thresholds and categories. [Read Full G2 Review]
12. GitView
GitView is a git analytics platform for engineering leaders, and transparency is its main selling point. Each metric comes with its calculation exposed, code changes get classified as new work, churn, refactoring, or removal, and you can query the underlying data in SQL.
How it compares to Swarmia → Both platforms cover engineering delivery, but GitView takes a narrower Git-centered approach, while Swarmia brings more structure around team practices, developer experience, and organizational improvement.
When GitView is the right choice for your team → This suits teams that want basic engineering observability from git data. If your requirements extend to AI impact measurement, financial reporting, or benchmarking against peers, the platforms higher up this list address those directly.
Key Features
- Code change classification: Changes get categorized as new work, churn, legacy refactoring, or simple removal, with impact scores attached. This separates volume from meaningful contribution, so a large diff that rewrites existing code reads differently from a large diff that ships something new.
- Raw SQL for custom reports: You can query your data directly to build dashboards, reports, and scheduled emailers. Few tools at this price point give you that level of access.
- Read-only metadata analysis: GitView never copies your source code. It works from metadata and change information through least-privilege read-only access, and your repositories stay on your own infrastructure.
Advantages
- Clear visibility into everyday engineering activity: Users say GitView makes commit, pull request, review, and contribution data easy to follow without much interpretation overhead. That can help teams spot workflow bottlenecks faster and use the same data to improve collaboration across the development process. [Read Full G2 Review]
- Permissions that are easy to manage: Access control comes up as another strength, particularly for organizations that need different levels of visibility across roles. A simpler permissions model can reduce friction when the platform starts to serve more than one type of stakeholder. [Read Full G2 Review]
Limitations
- The amount of data can take time to learn: Some users report that the platform can feel information-heavy at first, especially when they are still working out which metrics matter for each role. For teams new to engineering analytics, that can mean a short learning period before dashboards become useful. [Read Full G2 Review]
- Larger teams may outgrow the level of depth: One user says GitView started to feel too basic as their team expanded. That will depend heavily on what the organization expects from the platform, but teams that need deeper planning, financial analysis, complex org modeling, or highly customized reporting may want to look for more enterprise-focused alternatives. [Read Full G2 Review]
13. Oobeya
Oobeya is an enterprise engineering intelligence platform that collects AI code attribution signals directly from the IDE, and then connects them to commits, pull requests, review flow, and delivery outcomes.
It covers DORA, SPACE, code quality, and resource allocation across the SDLC, with private cloud and on-premise deployment available.
How it compares to Swarmia → On-premise deployment is the practical difference for regulated organizations, since Swarmia runs as a hosted product and Oobeya installs inside your own environment.
When Oobeya is the right choice for your team → Oobeya fits organizations with data residency or regulatory constraints that rule out hosted platforms. Financial services, insurance, telecom, and public sector customers make up a meaningful part of its base for that reason.
Key Features
- IDE-level AI code attribution: Git shows who committed a change, not whether a human or an assistant wrote it. Oobeya captures origin signals from the IDE and links them to commits, pull requests, code churn, review flow, and ownership patterns.
- Token usage and cost monitoring: The platform tracks consumption, remaining credits, burn rate, and month-end forecasts, and points out overage risk before you hit it. It also identifies which models drive the most spend.
- Enterprise deployment and access control: Private cloud and on-premise options are available, with role-based access control and Microsoft Entra ID authentication. AI Chat can run against a local LLM.
Advantages
- Immediate pipeline visibility on Microsoft stacks: Users highlight the ability to pull useful pipeline and workflow insight from Azure DevOps without continually rebuilding reports by hand. That can make it easier to explain how engineering work is progressing and where capacity or process issues are showing up. [Read Full G2 Review]
- A broader picture of engineering health: Some teams like having velocity, quality, and organizational performance visible in the same environment instead of treating each as a separate reporting problem. Symptoms then point to patterns behind those numbers, which gives managers a starting point for deciding where to look more closely. [Read Full G2 Review]
Limitations
- Chart exports could be more presentation-ready: Some users would like an easier way to take individual visualizations from Oobeya and drop them directly into leadership decks. This is a relatively small workflow issue, but it can matter for teams that regularly turn engineering metrics into board, executive, or quarterly-review presentations. [Read Full G2 Review]
- Automated symptoms do not replace team context: Some teams say individual Symptoms could benefit from more context about the specific team they describe. Oobeya has since added configurable thresholds and broader team-level controls, but leaders should still treat a symptom as a prompt to investigate the underlying workflow rather than assume it explains the cause on its own. [Read Full G2 Review]
How to Choose the Right Alternative for Your Needs
How to Choose the Right Alternative for Your Needs
Your shortlist should come from your primary requirement. A team that needs capitalization reporting and a team that needs review automation will end up with different answers, even though both are replacing the same product.
Here is how the options break down by priority:
| If your priority is… | Start with | Why |
| Engineering and business alignment | Jellyfish, Allstacks | Jellyfish maps engineering effort to strategic initiatives with allocation percentages and connects that to cost and headcount data. Allstacks covers similar ground through its context graph, which links activities, teams, costs, and objectives. |
| AI impact measurement | Jellyfish, Waydev | Jellyfish tracks token usage by model against cost by tool, then ties spend to changes in throughput, cycle time, and quality. Waydev rebuilt its platform around this question and calculates cost per pull request, which suits teams where AI spend is the whole problem. |
| Workflow automation | LinearB | gitStream acts directly on pull requests through rules you define in YAML, handling reviewer routing, risk labeling, and merge policies. |
| Delivery forecasting | Allstacks, Plandek | Allstacks trains forecasting models on your own delivery history and finds risk weeks before a date slips. Plandek brings predictive analysis across sprints, epics, and value streams. |
| Developer experience | DX, Typo | DX comes from the researchers behind DORA, SPACE, and DevEx, and its Developer Experience Index converts friction into hours lost per engineer. Typo runs anonymous chatbot check-ins that get better response rates than a quarterly survey form. |
| Delivery and operational visibility | Haystack, Harness AI DLC Insights | Haystack keeps a tight focus on delivery flow, capacity, and planning signals. Harness makes sense when those insights need to work alongside CI/CD, security testing, and cloud cost in one platform. |
| Enterprise customization | Faros AI, Plandek | Faros AI connects to over 100 tools without asking teams to standardize how they work, which suits organizations where business units run different stacks. Plandek gives you custom metrics, API access, and reporting structures shaped around your own value streams. |
| Regulated and on-premise environments | Oobeya, Waydev | Oobeya offers private cloud and on-premise deployment with Entra ID authentication, and its AI Chat can run against a local LLM. Waydev also deploys inside your own infrastructure if engineering data cannot leave it. |
| Financial planning and software capitalization | Jellyfish, Plandek | Jellyfish generates audit-ready capitalization reporting from work teams already do, with no timesheets involved. Plandek supports Capex and Opex allocation and combines engineering data with finance systems through its API. |
For larger engineering organizations, Jellyfish handles the widest combination of these priorities in one platform, particularly when the data has to serve business, finance, and AI investment decisions alongside day-to-day engineering leadership.
That does not make Jellyfish the automatic choice. LinearB is stronger when pull request automation is your main requirement, DX goes deeper into research-led developer experience measurement, and teams that need on-premise deployment should look at Oobeya or Waydev first.
Jellyfish — The Leading Alternative to Swarmia
Jellyfish — The Leading Alternative to Swarmia
Between the enterprise intelligence platforms, workflow automation tools, developer experience specialists, and lightweight Git analytics on this list, there is something for most situations. Most teams who get this far have outgrown team-level reporting.
Jellyfish handles that ground and continues into allocation, financial reporting, and AI impact, which covers the questions leadership brings once engineering performance becomes a business conversation.
Here’s a quick summary of what it brings to the table:
- Token spend measured by model and tool, set against the throughput, cycle time, and quality it produced
- Engineering effort mapped to strategic initiatives and business-as-usual with clear allocation percentages
- Audit-ready software capitalization reporting generated from work your teams already do, with no timesheets
- Developer sentiment correlated against DORA, SPACE, and system metrics, so feedback connects to measurable outcomes
- Natural language answers about your engineering data, available through the Assistant or from Claude and Cursor via MCP
The fastest way to know whether Jellyfish fits is to see it in action. Book a demo, and we will walk through how it works for organizations like yours.
About the author

Jellyfish is the leading Software Engineering Intelligence Platform, helping more than 700 companies including DraftKings, Keller Williams and Blue Yonder, leverage AI to transform how they build software. By turning fragmented data into context-rich guidance, Jellyfish enables better decision-making across AI adoption, planning, developer experience and delivery so R&D teams can deliver stronger business outcomes.