In this article
For modern engineering leaders, it’s clear that better measurement will foster alignment with product and go-to-market teams, improve the overall product experience and value for customers, and speed time to market.
But exactly which data should you pay attention to? What are the right KPIs and metrics you should be tracking to measure project success and truly understand your team’s performance?
Learn about the most relevant metrics below:
- Allocation
- Hiring and Ramp Time
- Bug Rate
- Time to Resolution
- Uptime
- Cycle Time
- Lead Time
- Deployment Frequency
- Task Resolution Rate
- Completion / Burndown Percentage
- Predicted Ship Date
- Code Coverage
- Cumulative Flow
- Flow Efficiency
- Net Promoter Score
10 KPIs Every Engineering Leader Should Track
Get eBookAllocation
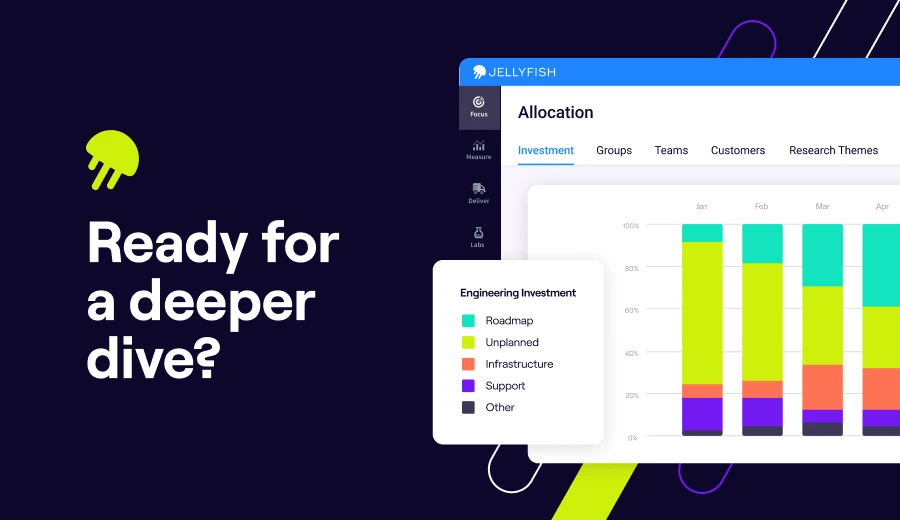
1. Allocation
In order to inform decisions around investing in new products or capabilities, you must first understand how your team’s development efforts are split right now, and how much capacity they have to take on new projects. The priorities of the engineering team should align with your company’s strategic objectives and business goals.
Allocation is a way of visualizing how close your team is to that goal by breaking down the amount of work they do across axes that matter to the business. Most teams will want to track the category of engineering investments they are making. That way they can see how much work is currently going into innovation vs. managing infrastructure or tech debt vs. debugging or customer support issues, etc.
If the team is spending most of its time tracking down bug fixes or managing maintenance work, that should inform your product and engineering strategies to either manage down the amount of time on these categories and/or manage the expectations of how much new feature work can feasibly be done with the current team.
Hiring and Ramp Time
2. Hiring and Ramp Time
Ramp time might be a surprising metric to see on this list, but it’s one that is often overlooked, and it can have a big impact on the capacity of your software development team, especially in growth mode as you hire.
No one starts a new job and is completely productive right away. If you’ve linked hiring to the ability to build and deliver new software products or features (and most of us do), it’s important to know approximately how long new hires will need to ramp after hiring is done.
But as we all know, hiring is a long and expensive process, and it does not always go according to plan, so tracking progress against new hire ramp time will help you manage expectations accordingly.
Bake this into your assumptions during product and roadmap conversations, for operational planning sessions, and as you plan throughout the year.
Startups, in particular, need to closely watch ramp time.
Bug Rate
3. Bug Rate
For the most part, bugs are an inevitable part of building software. Of course having some bugs does not inherently imply your product will not satisfy customers, but it can certainly have a big impact. By measuring bug rate as a KPI, you are not trying to prevent them, but rather simply surfacing where they exist so you can catch, prioritize, and fix them in a timely manner.
Therefore, the key thing to monitor here is a breakdown of bugs by product or feature. By understanding the number and severity of bugs that exist per product or feature, and comparing that with product or feature usage among your customer base, you will have a better understanding of which bugs to prioritize fixing, and therefore where to devote your resources.
Time to Resolution
4. Time to Resolution
Since you cannot fix every incident, bug, or failure immediately, it’s important to keep track of how long quality issues hang out in the product before being addressed. Of course, some incidents (security breaches for example) require immediate attention and should have shorter resolution times, while you can afford to wait on others. On the whole, measuring the time it takes to resolve reported bugs, failures, and other incidents will give you a sense for the team’s ability to be responsive to customer problems. Combined with a metric like net bugs, or the number of bugs reported vs. fixed which monitors how bugs are accumulating, this will give you an understanding of how well your software engineering team is managing the constant inflow of issues and how fast they can fix high priority issues in the product.
Uptime
5. Uptime
Quality metrics matter. And uptime is perhaps at the top of the list. That’s why unplanned downtime, or even slow delivery of service can threaten the relationship with your customers.
The importance of monitoring and maximizing uptime is especially true in industries like e-commerce where failing to deliver services can equate to loss of revenue and is an immediate threat to the business. And let’s not forget the Netflix downtime that sparked outrage during the Tyson Paul boxing match.
Regardless of industry specifics, it’s important to ensure your products perform well and are delivered reliably to your customers.
Cycle Time
6. Cycle Time
Cycle time is a common metric touted by Agile aficionados and for good reason. It measures the amount of time that elapses from the start of work on a particular task until that task is complete and ready to be shipped.
Simply put, cycle time measures the time it takes to complete work on a task. By keeping track of cycle time, you can compare planned work with similar tasks that the team has completed in the past and provide an estimate for the delivery of that functionality. It will help you better predict how long features will take to build and therefore when they should be expected to ship.
Story points are also a valuable tool for estimating the complexity and effort required for tasks, enhancing cycle time predictability.
Lead Time
7. Lead Time
Lead time is one of the key metrics that DORA (DevOps Research and Assessment group) espouses for optimizing the speed of value delivery to customers. Most often it is measured as the time between first commit and deployment, but that definition may be increasing in scope with newly available technologies and methods of measuring.
The point of Lead time is to understand the amount of time it takes between the initiation of a change request and when that change is running in production – or how quickly we can deliver value to customers.
Deployment Frequency
8. Deployment Frequency
Tracking how often your software engineering team does deployments can be extremely useful for understanding and improving on the speed with which you can deliver value to customers.
Deployment Frequency is another DORA metric, and in true DevOps fashion, the goal is to do smaller deployments as often as possible. Frequent, smaller deployments, as advocated by DORA metrics, make testing and releasing easier, which in turn drives down the time it takes to get new functionality to users.
This aligns with continuous delivery practices and improves customer satisfaction.
Task Resolution Rate Over Time
9. Task Resolution Rate Over Time
As most projects are broken down into smaller bits of work that can be handled by and assigned to an engineer, it can be useful to measure how many of those pieces of work are being completed versus the number that have been created (resolution rate) over time.
Many teams use a common framework in which an issue is the basic unit of work, a group of issues is an epic, a group of epics is an initiative, and so forth. In that terminology, measuring issue, epic, or initiative resolution rate gives a sense for how well your team is handling the amount of work being assigned to them, how fast they can generally complete this work, and whether changes need to be made.
It’s important to recognize that these tasks are not a standard size. Some issues will take a day to resolve, while others will take two weeks simply due to their scope. That’s why we suggest measuring the resolution rate, and monitoring it over time to identify trends. By understanding how your resolution rate is trending, you can be quicker to respond to problems that arise in the software development process, and measure changes in efficiency when making changes.
Burndown Percentage
10. Burndown Percentage
Burndown is another one of those common agile methodologies that can be extremely useful to track from a leadership position. Burndown measures the trend of work that has been completed vs. what remains to be done over a certain period of time.
By understanding how many hours have been worked on resolved items, what percentage of the total project those makeup, and how many items remain, you’ll have a fairly accurate understanding of how much work each team member has ahead of them, how likely the team is to complete the work in the next sprint, whether the team is likely to complete the project on time, or if not, what timeline is more reasonable to expect.
Predicted Ship Date
11. Predicted Ship Date
Being able to provide an estimate as to when a given release, project, feature, or product will ship to end users has its obvious benefits. It helps all interested parties in the company (that means pretty much everyone) plan around the work that they need to do to either support your team or bring new functionality to market. In many companies, these predictions can be handwavy, especially when they are done by intuition and experience alone. But it’s better to provide an estimate and need to change it than to provide nothing at all.
Code Coverage
12. Code Coverage
In the pursuit of robust and reliable software, it’s essential to know how much of your source code is being exercised by your automated tests. Code coverage provides this crucial information. It measures the percentage of your codebase that is executed when your test suite runs. This metric is a key indicator of your testing effectiveness and helps you identify areas of your code that may be vulnerable to bugs.
While high code coverage doesn’t guarantee bug-free or high-quality software, it significantly reduces the risk of regressions and undiscovered issues. By tracking code coverage, you can ensure that critical parts of your application are adequately tested and that changes to the codebase don’t introduce unexpected problems.
Monitoring trends in code coverage can help you identify areas where additional testing is needed, reduce code complexity, and give you greater confidence in your releases.
Additionally, test-driven development can dramatically improve code coverage.
Cumulative Flow
13. Cumulative Flow
Understanding how work moves through your development process is vital for identifying bottlenecks and optimizing your workflow. Cumulative flow diagrams provide a visual representation of the flow of work items through different stages of your process over time. This metric helps you understand the stability and efficiency of your development pipeline.
By analyzing the cumulative flow, you can identify areas where work is accumulating, indicating potential bottlenecks or capacity issues. You can also track the lead time and cycle time for work items, providing insights into how long it takes for work to move from start to finish. This data-driven approach allows you to make informed decisions about process improvements, resource allocation, and workflow optimization, ultimately leading to more predictable and efficient software development projects.
Flow Efficiency
14. Flow Efficiency
Flow efficiency measures the percentage of time a work item is actively being worked on versus the total time it spends in the development process. In essence, it tells you how much of the time a task is moving forward compared to how much time it’s waiting or idle.
Flow efficiency helps identify bottlenecks and optimize workflows by revealing where delays occur. By understanding where delays occur, you can make targeted improvements to your workflows, such as streamlining handoffs, reducing dependencies, or improving communication.
Improving flow efficiency can lead to faster delivery of value to end users, as work items move through the development pipeline more quickly. A more efficient flow leads to more predictable delivery times, making it easier to plan and meet deadlines.
Net Promoter Score (NPS)
15. Net Promoter Score (NPS)
Net Promoter Score (NPS) measures customer loyalty and satisfaction by asking customers how likely they are to recommend your product or service to others. It provides a simple, yet powerful, indicator of customer sentiment.
NPS helps gauge overall customer satisfaction and identify areas for improvement. By tracking NPS over time, you can monitor trends in user experience and customer satisfaction and measure the impact of changes to your product or service.
What Software Development KPIs Should You Avoid?
What Software Development KPIs Should You Avoid?
When it comes to software development KPIs, it’s crucial to focus on metrics that provide genuine insights and drive positive behaviors. However, some commonly used metrics can lead to unintended consequences, misinterpretations, and even counterproductive behaviors. It’s essential to understand the limitations of these metrics and consider more insightful alternatives.
For example, tracking lines of code is generally discouraged, as it can encourage quantity over quality and doesn’t reflect the complexity or value of the work.
Here are a few software engineering KPIs that often warrant a second look.
Code Simplicity
While the goal of clear and concise code is admirable, “simplicity” is inherently subjective. Quantifying it is difficult, and an overemphasis can lead to “over-engineering.” Instead, prioritize code reviews that emphasize readability and maintainability, and utilize automated code analysis tools.
Code Stability
Attempting to track “risky changes” is subjective and time-consuming. It can create a culture of fear and hinder necessary iterations. Focus on code churn combined with thorough code reviews, test coverage metrics, and system stability metrics like Mean Time to Recovery (MTTR) and change failure rate (CFR).
Sprint Burndown Charts
However, they don’t account for scope changes or unexpected roadblocks. For example, changes to the backlog can impact release burndown. Supplement them with other metrics and regular communication.
While useful for tracking remaining work, they don’t account for scope changes or unexpected roadblocks. For example, changes to the backlog can impact release burndown.
Supplement burndown charts with tracking of scope added/completion, velocity tracking over multiple sprints, and frequent communication through daily stand-ups.
Release Burndown Charts
Similar to sprint burndown, they can be misleading if scope changes are not considered. Instead, track feature completion rates, scope completion, and maintain consistent stakeholder communication to manage expectations.
What Types of KPIs Should You Track
What Types of KPIs Should You Track
Effective software development relies on tracking KPIs that provide a holistic view of team performance. Generally, these metrics can be categorized into four key areas, each offering unique insights.
Coding Efficiency Metrics
Measures how effectively developers produce code.
Examples include Code Churn (amount of code changes), Throughput/Cycle Time (task completion time), and Function Points per Time Unit (functionality delivered).
Collaboration Metrics
Assesses how well teams work together.
Examples include Code Review Participation (engagement in reviews), Number of Pull Requests and Merge Time (code integration efficiency), and Team Satisfaction/Morale (team well-being).
Predictability Metrics
Focuses on the accuracy of estimations and planning.
Examples include Velocity (sprint work completion), Sprint Commitment vs. Completion (goal adherence), and Accuracy of Estimates (forecasting precision).
Reliability Metrics
Gauges code quality and testing effectiveness.
Examples include Test Coverage (code testing percentage), Mean Time to Recovery (system resilience), Change Failure Rate (deployment stability), and Number of Bugs/Defects per Release (release quality).
Track key software development metrics and KPIs with Jellyfish
Track key software development metrics and KPIs with Jellyfish
To effectively track software development metrics and gain actionable insights, organizations often utilize a project management KPI dashboard. This dashboard serves as a centralized tool for monitoring and visualizing key performance indicators across projects and teams.
The Jellyfish Engineering Management Platform, for example, automatically ingests and analyzes signals from Continuous Integration, Incident Management, Issue Tracking, and other DevOps tools to track Lead Time to Production, Deployment Frequency, Mean Time to Resolution, and Incident Rate.
By leveraging DORA metrics and utilizing a project management KPI dashboard, organizations can make data-driven decisions to improve their DevOps practices. These metrics enable teams to identify bottlenecks, streamline processes, and cultivate a culture of continuous improvement throughout the entire development lifecycle.
Furthermore, these tools provide organizations with a comprehensive, holistic view of their software development performance. By optimizing resource allocation and development workflows, organizations can achieve higher team productivity, enhance software quality, and drive greater customer satisfaction.
Try Jellyfish Today
Ready to see how Jellyfish can improve your engineering organization?
Book a demo today!About the author

Lauren is Senior Product Marketing Director at Jellyfish where she works closely with the product team to bring software engineering intelligence solutions to market. Prior to Jellyfish, Lauren served as Director of Product Marketing at Pluralsight.