In this article
Engineering leaders are under more pressure than ever. Markets move quickly, AI is reshaping how teams operate, and organizations must be able to justify every dollar they invest in R&D. Yet, most companies still struggle with fragmented data, making it difficult to answer even the most basic questions about engineering productivity, investment, and impact.
By transforming scattered engineering signals into a unified view of R&D investment, team output, and operational health, Jellyfish enables executives to make faster, smarter, truly data-driven decisions. It connects engineering work to business outcomes, helping organizations optimize resources, identify risks early, and keep teams aligned with company goals.
At its core, Jellyfish helps executives answer five critical questions:
- Are we building the right things?
- Are we delivering effectively?
- Is our AI strategy on track?
- How can I get a pulse of what’s going on in my organization?
- How are we doing compared to our peers?
Let’s explore how.
Are we building the right things?
1. Are we building the right things?
One of the biggest challenges for executives is ensuring engineering time is aligned to what the business actually cares about. Jellyfish gives you real-time visibility into how R&D investments are allocated – across initiatives, product lines, customer commitments, technical debt, and more.
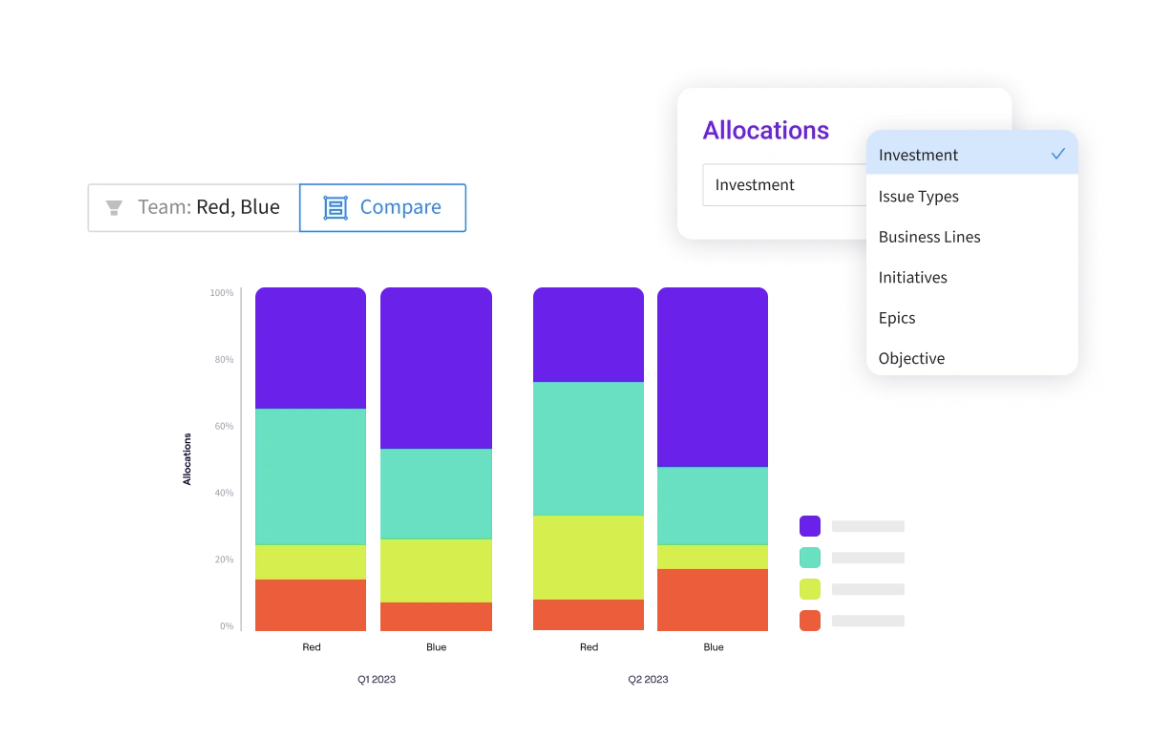
Allocations: Your Clear Line of Sight Into Engineering Effort
Allocations – measured in Full-Time Equivalents (FTEs) – show exactly where engineering energy is being spent. With this view, executives can:
- Align resources with strategy: Instantly see whether teams are investing in the right projects or over-indexing on low-priority work.
- Spot bottlenecks early: Identify places where teams may be starved for resources – or drowning in them.
- Plan with confidence: Make strategic resourcing decisions based on accurate, unified data rather than gut feeling.
This level of clarity can be the difference between being proactive and falling behind.
Are we delivering effectively?
2. Are we delivering effectively?
A predictable engineering organization is a competitive advantage. Jellyfish provides a single source of truth for delivery metrics, giving leaders the insights needed to ensure teams are executing efficiently and consistently.
Key Delivery Metrics, All in One Place
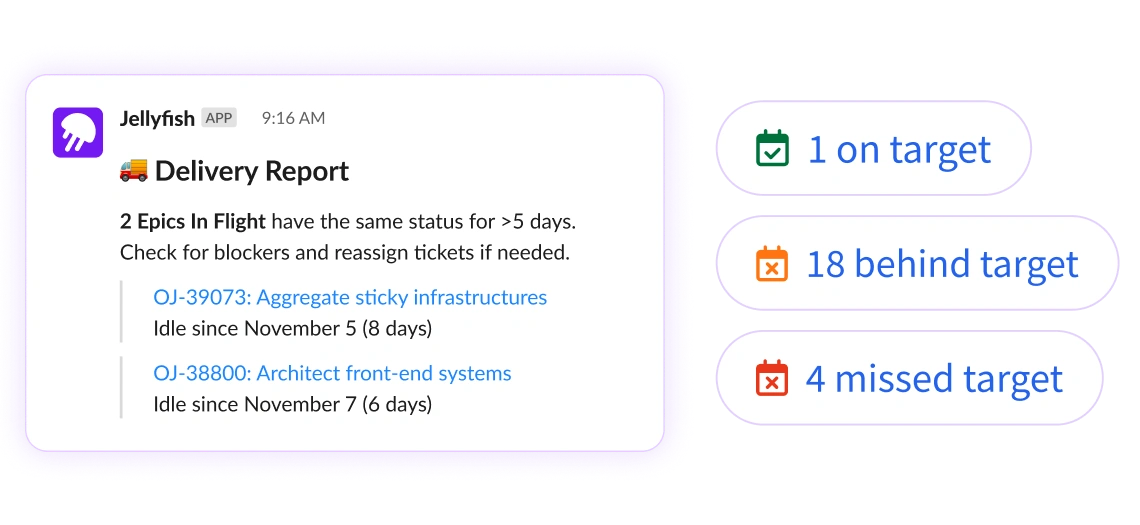
Jellyfish highlights performance indicators like:
- Sprint Predictability
- Sprint Addition
- Sprint Completion
These metrics help executives quickly understand whether teams are meeting commitments, where work is getting stuck, and how delivery performance trends over time. And because deliverables are centralized in one clear view, it’s easy to see whether major projects are on track – or drifting off course.
Is our AI strategy on track?
3. Is our AI strategy on track?
As companies pour resources into AI initiatives, executives need visibility into whether those investments are actually moving the needle – or unintentionally pulling teams away from core business goals. Jellyfish provides that visibility with AI Impact.
AI Impact: Measure What Matters
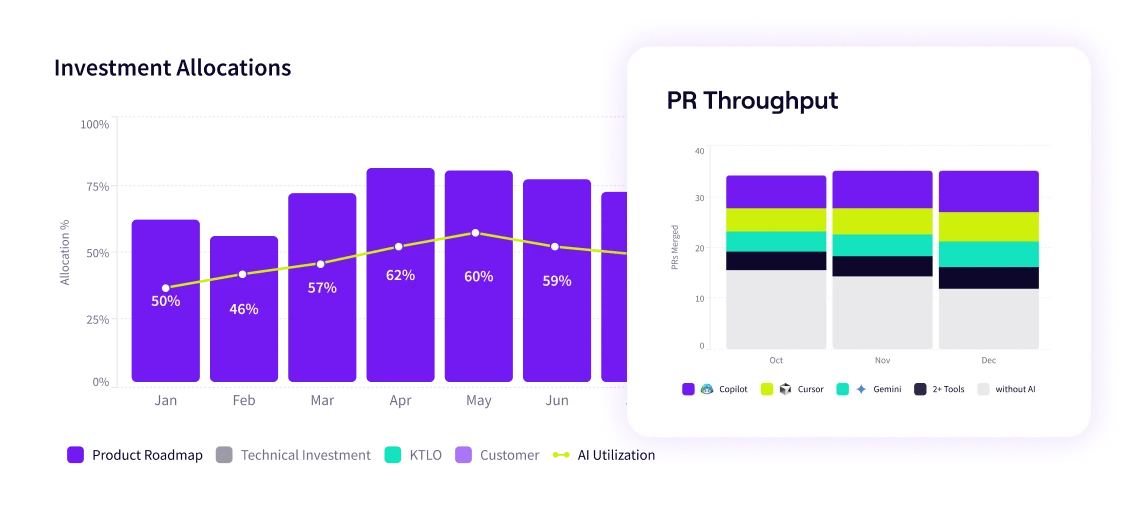
Through deep integrations with the AI tooling ecosystem, Jellyfish helps you understand:
- Who is using which AI tools, and how
- How AI is impacting productivity and code quality
- How much engineering time is being dedicated to AI initiatives
This clarity helps leaders balance innovation with execution to ensure AI investments are producing measurable value.
How can I get a pulse of what’s going on in my organization?
4. How can I get a pulse of what’s going on in my organization?
Every executive wants a fast, reliable way to understand what’s happening across engineering without digging through multiple tools or dashboards. Jellyfish makes that easy.
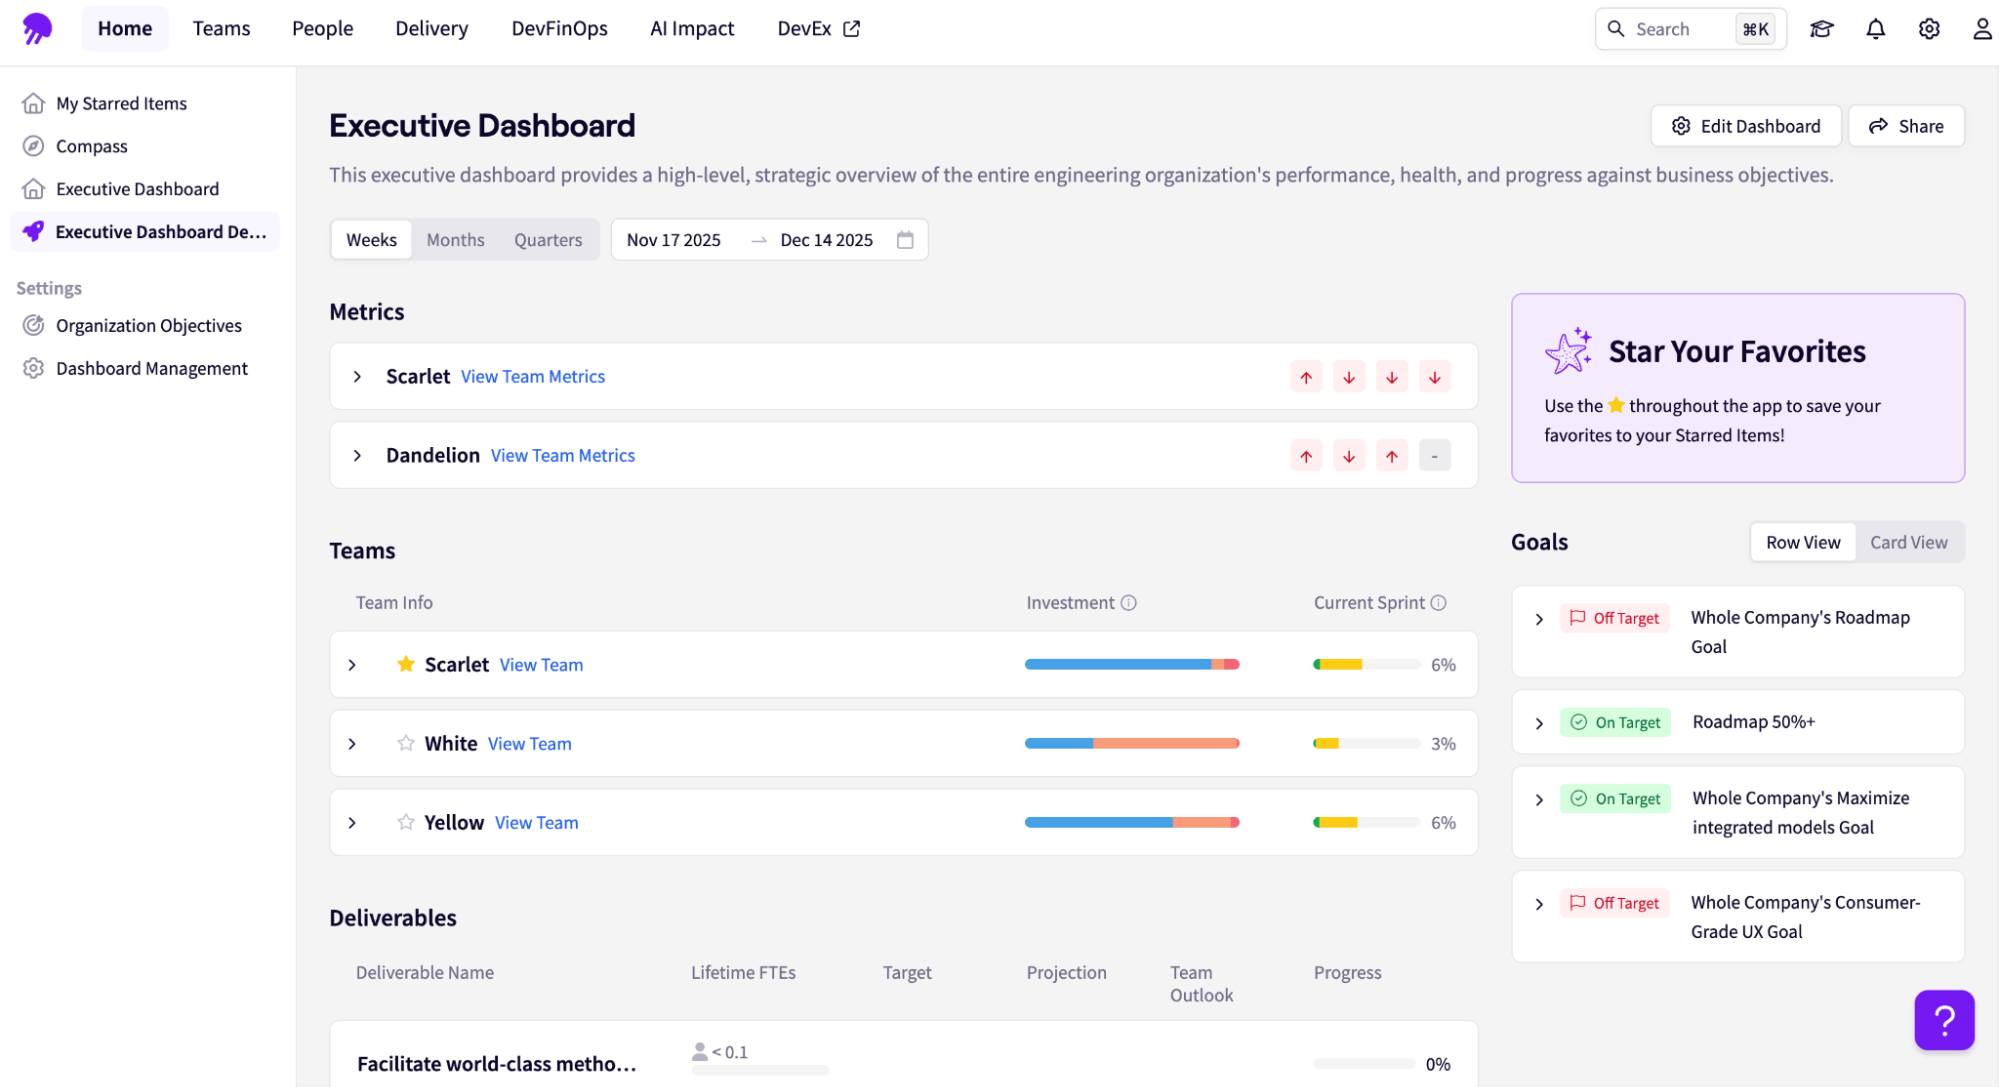
Custom Dashboards for Instant Visibility
Admins can create tailored dashboards that surface the metrics and views that matter most to you – from team-level delivery health to org-wide investment trends. It’s the quickest way to get a high-level snapshot of progress, priorities, and risks.
How are we doing compared to our peers?
5. How are we doing compared to our peers?
Lastly, even with strong internal metrics, executives often ask: Is this good? Jellyfish answers that question with anonymized industry benchmarks that reveal how your engineering team stacks up against similar organizations.
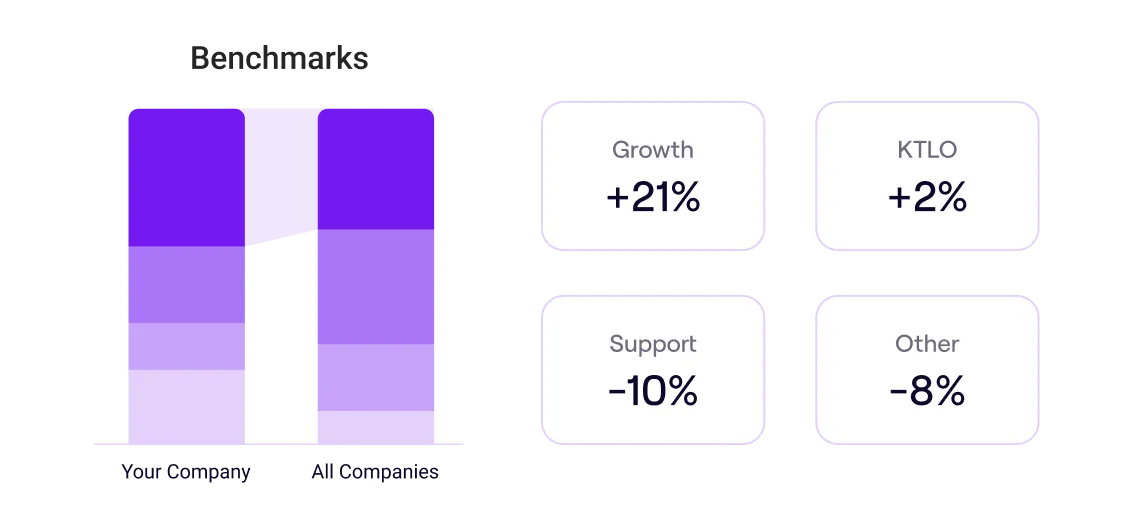
Benchmarking That Drives Intelligent Investment
With Jellyfish’s benchmarking analytics, you can compare:
- Investment allocations
- Key productivity and delivery metrics
- Engineering effort patterns
Benchmarking data helps leaders identify areas of strength, uncover opportunities for improvement, and justify strategic investments backed by real industry data.
Keep Learning: Make the Most of Jellyfish
Keep Learning: Make the Most of Jellyfish
Whether you’re just getting started or looking to go deeper, Jellyfish offers resources to help executives and teams get the most from our platform. Current customers can explore resources in Jellyfish Academy or the Jellyfish Help Center.
If you’re looking to learn more about Jellyfish, you can request a demo here.
About the author

Jackson is Customer Education Lead at Jellyfish where he heads up the Jellyfish Academy.