In this article
Opsera is a DevOps platform built around CI/CD orchestration, pipeline automation, and security scanning, that happens to include engineering insights through its Unified Insights module.
You get DORA metrics, developer productivity data, and Copilot ROI tracking, but as one feature within a larger product, not as the core focus.
If engineering intelligence is what you’re after primarily, then you’re basically adopting a DevOps platform just to access one module.
There’s limited room to customize engineering workflows, and the insights module doesn’t offer the same depth as tools built entirely around SEI. And without public pricing, smaller teams often find the cost hard to justify for partial platform use.
This guide covers six alternatives worth considering. Some are purpose-built for engineering intelligence, while others, like Opsera, bundle SEI with broader DevOps functionality. We compared features, pricing, and user reviews so you can weigh the trade-offs and find the right fit.
Why Look for an Alternative to Opsera?
Why Look for an Alternative to Opsera?
Opsera tries to do a lot under one roof, from pipeline automation to DORA metrics. That scope appeals to some buyers, but users mention several drawbacks:
- Complex setup and learning curve: G2 users mention a steep onboarding curve, especially without dedicated DevOps expertise on the team. For insights-only use cases, that’s a lot of setup overhead for one module. [Read Full G2 Review]
- Engineering insights isn’t their main focus: Unified Insights is a module within Opsera, not the core product. Dedicated SEI tools tend to go deeper on metrics, benchmarks, and workflow analysis because that’s their whole job.
- UI performance issues: Performance lags often come up in reviews. Users claim that the interface doesn’t always keep pace with faster alternatives. [Read Full G2 Review]
- Inconsistent help from the support team: Users mention hit-or-miss support experiences. Not necessarily a deal-breaker, but it’s worth knowing if your team leans heavily on vendor help. [Read Full G2 Review]
- Overkill for insights-only buyers: If you just want engineering metrics, you’re signing up for a platform built around CI/CD orchestration and pipeline automation. That means extra complexity, extra cost, and features your team won’t touch.
- Limited customization for engineering workflows: The tool isn’t particularly intuitive even once you’re up and running. And when teams try to customize it for their engineering workflows, they hit walls fairly quickly. [Read Full G2 Review]
- Opaque and expensive pricing: Pricing isn’t transparent, and you’ll need to talk to sales to get numbers. Users say the cost runs high, particularly for smaller software teams that don’t need the full DevOps platform bundled in. [Read Full G2 Review]
Key Features and Functionalities to Look For in an Opsera Alternative
Key Features and Functionalities to Look For in an Opsera Alternative
Based on user reviews and where the Unified Insights module falls short, here’s what to prioritize:
Engineering Intelligence as Primary Functionality
You want a tool where engineering intelligence is the product, not a feature tucked inside a DevOps platform. Vendors whose entire product focuses on SEI go deeper on analytics, benchmarking, and workflow visibility because that’s where they compete.
When a platform splits attention between pipeline automation and engineering insights, the insights piece rarely gets the same depth.
Flexible Customization for Engineering Workflows
Opsera doesn’t offer much room to tailor the platform to your engineering workflows.
Look for tools that let you define custom metrics, build views around your team structures, and slice data by project type, work category, or whatever dimensions matter to your org.
Intuitive UI and Fast Time-to-Value
We saw that Opsera users mention complex setup and a steep learning curve, especially for teams without DevOps expertise.
An alternative should offer faster time-to-value, where you get first insights quickly and self-service options for custom views.
DORA Metrics and Developer Productivity Tracking
DORA metrics are table stakes, but depth varies. Opsera offers the basics through Unified Insights, while purpose-built SEI platforms tend to provide more granular views – cycle time by team, bottleneck analysis, review time breakdowns, and trends over time.
AI Coding Tool ROI Measurement
Opsera’s Copilot ROI tracking handles some core elements, but dedicated SEI platforms offer more substance.
For example, Jellyfish tracks AI code acceptance rates, measures downstream effects on velocity and review times, and rolls it up into investment-level reporting.
That depth is especially important when you’re justifying AI tooling costs to finance or the board.
Resource Planning and Capacity Management
Opsera tracks past performance, but it can’t tell you if your team can hit next quarter’s targets or which projects are competing for the same engineers.
An alternative should show which teams have bandwidth, which are stretched thin, and how adding or changing headcount would affect upcoming commitments.
Top Alternatives to Opsera on the Market Right Now
Top Alternatives to Opsera on the Market Right Now
These six tools range from pure-play SEI platforms to DevOps suites with strong engineering analytics built in.
We looked at features, pricing, G2 reviews, and where each one fits best, so you can find the right match for your team’s needs and budget:
- Jellyfish
- Harness
- Swarmia
- SonarQube
- Hivel
- Code Climate Velocity
| Solution | Platform Type & Focus | Best For |
| Jellyfish | End-to-end SEI platform covering delivery, planning, DevEx, AI measurement, and DevFinOps | Teams that need comprehensive engineering intelligence tied to business outcomes and executive reporting |
| Harness | AI-powered DevOps platform with dedicated SEI module (via Propelo acquisition) | Organizations consolidating DevOps tooling and engineering analytics under one vendor |
| Swarmia | Pure-play SEI with native DevEx surveys and Slack automation | Teams that prioritize developer sentiment alongside delivery process metrics |
| SonarQube | Static code analysis for quality, security, and technical debt | Organizations focused on code health and vulnerability scanning rather than pure productivity metrics |
| Hivel | Engineering analytics with persona-based dashboards | Analytics-only buyers who want role-specific views without purchasing a DevOps platform |
| Code Climate Velocity | Engineering intelligence with goal tracking and industry benchmarks | Teams aligning engineering metrics to OKRs and external benchmarks |
1. Jellyfish
Jellyfish is an end-to-end software engineering intelligence platform that covers everything from DORA metrics and capacity planning to DevEx surveys and AI tool measurement.
Companies like DraftKings, Priceline, and Blue Yonder are among the 700+ organizations using Jellyfish to understand where engineering time goes and how it ties back to strategic goals.
It’s a pure-play SEI platform, which means you get depth across planning, delivery, DevEx, and AI measurement that Opsera’s Unified Insights module simply can’t match.
Key Features
- AI Impact dashboard: Jellyfish connects adoption data from Copilot, Cursor, Claude Code, Gemini, and others to productivity metrics, so you can compare vendors, spot which teams are seeing improvements, and figure out where AI is making a difference across the SDLC.
- Resource allocation and investment visibility: Shows where engineering time is going and whether it lines up with business priorities. Jellyfish categorizes work automatically using a patented allocation model, so you get an accurate picture without asking teams to tag tickets or change how they work.
- Scenario Planner and capacity forecasting: You can model staffing changes, project tradeoffs, and roadmap scenarios before making commitments. The platform uses historical performance data to forecast timelines and help leaders set realistic expectations with stakeholders.
- DORA and SPACE metrics with team benchmarks: Covers DORA and SPACE metrics out of the box, with benchmarking powered by the largest dataset in the SEI category. You can see how teams stack up against each other and where you stand relative to the industry.
- DevFinOps and automated financial reporting: Handles software capitalization and R&D tax credit reporting automatically, using real-time data instead of manual time entries. Finance teams get clean, auditable numbers without extra work from developers.
Why Do Companies Choose Jellyfish Over Opsera?
Opsera works well if you need DevOps tooling with some analytics on top. For teams focused primarily on engineering intelligence, Jellyfish tends to win out for a few reasons:
- Engineering intelligence is the product, not a module: Opsera’s Unified Insights is one piece of a larger DevOps platform. Jellyfish is built entirely around engineering intelligence, which means deeper functionality and faster iteration on the features SEI buyers care about most. [Read Full G2 Review]
- Easier setup and faster time-to-value: Opsera users mention a steep learning curve, especially for teams without dedicated DevOps expertise. Jellyfish integrates with common engineering tools smoothly, and users report that the interface is intuitive enough to start getting value without heavy onboarding. [Read Full G2 Review]
- More responsive customer support: Support quality varies with Opsera based on user reviews. Jellyfish customers consistently mention strong support as a differentiator, both during initial setup and ongoing use. [Read Full G2 Review]
- Stronger DevEx capabilities: Developer experience is a gap in Opsera. Jellyfish fills it with built-in surveys, Slack alerts for stalled tickets, and digests that show what’s slowing teams down. Survey results also tie directly to DORA and SPACE metrics. [Read Full G2 Review]
What Real Customers Are Saying about Jellyfish
Priceline was managing software capitalization manually across 700+ engineers — a process that sometimes took a full week. With Jellyfish DevFinOps, they automated the link between GitHub and Jira, making capitalization 5x faster and cutting the internal audit interview process by over 80%.
Humanforce had a multi-year initiative that was missing stakeholder expectations, but had no visibility into why. Jellyfish found patterns like interrupted sprints and capacity changes that were causing delays. The team now saves 40 hours a month on reporting and improved software delivery predictability by 25%.
Ada had no clear view of how engineering time was being allocated across roadmap work, technical investments, and customer support. With Jellyfish, they spotted under-investment in technical improvements and saw consistent double-digit increases quarter over quarter. They also used Jellyfish to measure Copilot’s impact and saw a 14% improvement in cycle times.
2. Harness
Harness is an AI-native DevOps platform that combines CI/CD automation, infrastructure management, and cost optimization with a built-in SEI module for engineering productivity, DORA metrics, and delivery insights.
The company acquired Propelo (a specialized SEI vendor) to build out its engineering intelligence capabilities, which means the SEI module has more depth than a typical add-on.
Both platforms bundle engineering insights with broader DevOps functionality, but Harness treats SEI as a more specific product line with its own architecture and roadmap. Opsera’s Unified Insights feels more like a feature within the platform.
Key Features
- DORA and SPACE framework tracking: Harness SEI measures deployment frequency, lead time, change failure rate, and MTTR out of the box. It also supports the SPACE framework for broader productivity metrics.
- Automated workflow engine: A low-code automation engine triggers actions based on specific events, like sending Slack alerts when PRs sit too long in review or notifying teams about bottlenecks in the CI process.
- Sprint predictability and scope creep detection: Harness points out anomalies like missing story points, oversized stories, and unplanned work that affect delivery timelines.
Advantages
- Broad platform coverage: Harness covers a lot of ground with solid functionality across each, including both DevOps and engineering intelligence. [Read Full G2 Review]
- Built-in audit trail: Audit logging is built in, so you get visibility into who did what and when. It’s especially useful for regulated environments or teams that need accountability. [Read Full G2 Review]
- Quality documentation and customer support: Reviewers praise the documentation and support. When you hit a wall, the resources are there to help you move forward. [Read Full G2 Review]
Limitations
- Complex UI: Some users note that the interface can feel overwhelming given how much the platform offers. The breadth of features comes at the cost of simplicity. [Read Full G2 Review]
- Limited dashboard customization: Development teams mention wanting more control over dashboard layouts and metrics. The existing templates don’t always fit specific reporting needs. [Read Full G2 Review]
- Time-intensive onboarding: The platform offers a lot, and learning it all takes time. Users say it pays off once you’re up to speed, but expect a slower start. [Read Full G2 Review]
Pricing
Harness has a free tier for small teams and individual developers, plus two paid plans (Essentials and Enterprise) that you need to contact sales for. There’s no public pricing for the paid tiers.
3. Swarmia
Swarmia is a pure-play SEI platform that integrates with your source control, issue tracker, and AI coding tools to provide actionable insights into developer productivity, business outcomes, and developer experience.
The platform also combines DORA and SPACE metrics with developer experience surveys to cover productivity from multiple angles.
Where Opsera packages engineering insights inside a DevOps suite, Swarmia keeps the focus narrow. You get SEI without the surrounding platform.
Key Features
- DORA and SPACE metrics out of the box: Swarmia tracks deployment frequency, lead time, change failure rate, and MTTR alongside SPACE framework dimensions for a fuller picture of productivity.
- Developer sentiment surveys: You can run developer experience surveys directly in Swarmia. Questions span team dynamics, tooling, and tech debt.
- Slack notifications and automation tools: Automates code review reminders and CI failure notifications directly in Slack. It also includes enough log context to diagnose issues without leaving the conversation.
Advantages
- Easy trial and onboarding: Users report seeing value quickly during trials. Integration pulls data automatically, and guided workflows help clean up any mismatches without heavy lifting. [Read Full G2 Review]
- Clear and intuitive UI: Dashboards prioritize clarity over feature density. You get the numbers you care about upfront, with solid documentation for deeper exploration. [Read Full G2 Review]
- Non-intrusive for developers: Swarmia avoids the “surveillance tool” feel. Developers find the insights useful, not intrusive. [Read Full G2 Review]
Limitations
- Missing recovery time tracking: Swarmia tracks DORA metrics, but it doesn’t include MTTR from an incident management perspective. Teams that need recovery time data tied to incidents will need a separate tool. [Read Full G2 Review]
- Rigid scope creep classification: Scope change detection can be too aggressive. Small additions get lumped in with actual scope creep, and there’s no way to mark changes as minor. [Read Full G2 Review]
- Performance hiccups with large datasets: Users report slowdowns when working with larger amounts of data. The platform handles typical workloads fine, but big teams may notice lag. [Read Full G2 Review]
Pricing
Small teams (under 10 developers) can use Swarmia for free.
Paid tiers run €28/dev/month for one module or €49/dev/month for the complete package covering business outcomes, productivity, and developer experience.
Enterprise plans are negotiated separately and support on-prem setups.
Learn more → 14 Best Swarmia Alternatives & Competitors on the Market Today – Jellyfish
4. SonarQube
SonarQube is a static code analysis platform that tracks code quality, technical debt, and security vulnerabilities across 30+ languages.
It’s not a 1:1 Opsera alternative, but if your engineering intelligence priorities lean toward code health metrics and security risk over DORA and developer productivity, SonarQube fits better.
Key Features
- AI code quality tracking: Detects AI-generated code (including GitHub Copilot contributions) and tracks its quality separately. It shows whether AI-assisted code meets the same standards as human-written code.
- Quality gates as engineering standards: Quality gates set minimum standards for code health and block release cycles that don’t meet them. This can be useful for maintaining consistency as teams and codebases scale.
- 6,000+ rules across 30+ languages: SonarQube covers Java, Python, JavaScript, TypeScript, C#, Go, and more with language-specific rules for bugs and vulnerabilities.
Advantages
- Consistent standards across teams: Dashboards and quality gates keep standards consistent across projects and teams. This is helpful for orgs where code health needs to be comparable and reportable. [Read Full G2 Review]
- Intuitive with strong community support: The platform is straightforward enough that most teams won’t need vendor support. When questions come up, the community forums usually have answers. [Read Full G2 Review]
- Improves code quality habits: Developers get direct feedback on code quality, which helps them catch issues early and maintain higher standards over time. [Read Full G2 Review]
Limitations
- UI and speed limitations: Large projects can slow the platform down, and the interface feels less modern and user-friendly than newer tools. Functional, but not the slickest experience. [Read Full G2 Review]
- Price hikes are hard to justify: Users mention pricing restructures led to difficult budget conversations. Fair value overall, but the transition wasn’t smooth for everyone. [Read Full G2 Review]
- Potentially overwhelming first experience: Initial scans on legacy codebases can overwhelm developers with findings. It takes a bit to learn what to focus on first. [Read Full G2 Review]
Pricing
SonarQube offers both cloud-based and self-managed deployment options. Cloud infrastructure pricing breaks down into three tiers:
- Free: Up to 50k lines of code and 5 users max.
- Team: Starts at $32/month with unlimited users, AI CodeFix, secrets detection, and commercial support.
- Enterprise: Custom pricing, adds SSO, audit logs, portfolio management, and enterprise SLAs.
5. Hivel
Hivel is an engineering analytics platform that pulls data from Git, Jira, and CI/CD systems to bring productivity insights, DORA metrics, and AI tool ROI tracking.
Opsera and Hivel both aggregate data across your toolchain, but Hivel stops at analytics. There’s no CI/CD layer and no pipeline management.
Teams that already have DevOps tools covered and just want engineering intelligence might find Hivel simpler to adopt.
Key Features
- DORA and SPACE metrics built in: Track code deployment frequency, change failure rate, MTTR, and lead time alongside SPACE framework dimensions.
- AI coding tool ROI measurement: Tracks AI-generated code volume, correlates it with rework rates and review times, and shows which AI tools are helping versus creating silent tech debt.
- Persona-based dashboards: Different views for CTOs, VPs, and engineering managers. Each role sees relevant metrics without going through data meant for someone else.
Advantages
- Responsive, partnership-driven support: Support is fast and hands-on, both during implementation and after. The team listens to feedback and builds requested features, which users appreciate. [Read Full G2 Review]
- Single-pane productivity view: The platform centralizes metrics and activity so you’re not bouncing between tools. Users say it keeps tasks from slipping through the cracks. [Read Full G2 Review]
- Teams appreciate the AI-driven code review insights: The AI code review feature provides first-pass PR analysis. It may not be perfect, but it helps spot issues early and inform feedback conversations. [Read Full G2 Review]
Limitations
- No guided onboarding flow: First-time users can feel lost with so much data on screen. There’s no built-in walkthrough, so expect to lean on your admin or CS contact initially. [Read Full G2 Review]
- Team rotation skews reporting: Team rotations can throw off metrics. You’ll need to double-check context before sharing reports, especially after org changes. [Read Full G2 Review]
- Limited Jira customization: The Investment section doesn’t fully adapt to how different teams use Jira. Users want support for custom fields and the ability to pull metrics by specific projects or sprint cycles. [Read Full G2 Review]
Pricing
Pricing is per contributor, billed annually, with a free option for small teams.
- Free plan: Good for early-stage startups testing the platform.
- Growing teams: $20/contributor/month for scale-ups that need more depth.
- Enterprise: $35/contributor/month with compliance features for larger orgs.
6. Code Climate Velocity
Code Climate Velocity is an engineering intelligence platform that connects to GitHub, GitLab, Bitbucket, and Jira to track cycle time, PR throughput, capacity, and progress toward goals.
Where Opsera packages engineering insights inside a broader DevOps suite, Velocity stays focused on analytics and reporting. It’s a good fit for teams that have DevOps tooling sorted but lack clear metrics on continuous delivery efficiency.
Key Features
- 60+ engineering metrics and custom reporting: The Analytics module lets you explore relationships between metrics, build custom reports, and track team performance across cycle time, throughput, code quality, and more.
- Targets and goal tracking: Managers can set OKRs and KPIs based on core Velocity metrics, then visualize how teams progress over time.
- Industry benchmarks: You can compare your team’s performance against benchmarks from thousands of engineering organizations.
Advantages
- Scales visibility for large orgs: Provides executive-level visibility into team health across the org. Leaders can spot blocked teams quickly without spending hours in reviews or status meetings. [Read Full G2 Review]
- Clean, self-explanatory UI: No steep learning curve. Users report finding what they need without searching through help articles or training materials. [Read Full G2 Review]
- Team-based organization and metrics: Team-based views let you track metrics in context. Different teams have different workflows, and Velocity doesn’t force a one-size-fits-all comparison. [Read Full G2 Review]
Limitations
- Hard to account for external factors: There’s no easy way to note when someone was on leave, in training, or otherwise unavailable. That context matters when interpreting metrics, and without it, averages get skewed. [Read Full G2 Review]
- Continuous integration breakages: Integrations sometimes break, leaving holes in the data. Support helps resolve it quickly, but it’s disruptive if you rely on consistent reporting. [Read Full G2 Review]
- Assumes standard Git workflows: Not every team uses PRs the textbook way. Velocity’s assumptions about workflow can throw off metrics for teams with different development processes. [Read Full G2 Review]
Pricing
Code Climate keeps pricing off their website, so you’ll need to talk to sales. A free plan exists for small engineering teams (up to 20 developers) to get started.
How to Select the Right Opsera Alternative for Your Needs
How to Select the Right Opsera Alternative for Your Needs
Your pick comes down to whether you need pure-play engineering intelligence, a bundled DevOps platform, or something more specialized like code quality tracking.
Use these guidelines to match your priorities to the right tool:
- If you need to tie engineering metrics to business outcomes and planning, Jellyfish combines productivity tracking with capacity planning, investment allocation, and AI tool ROI measurement. It’s the most complete option for leaders who report to finance or the board on engineering spend.
- If developer sentiment is your primary focus and you want a lighter-weight tool, Swarmia pairs DORA and SPACE metrics with built-in developer experience surveys and Slack automation. Jellyfish offers similar DevEx capabilities.
- If you need DevOps automation and engineering insights under one roof, Harness covers CI/CD pipelines, infrastructure, and cost optimization alongside its SEI module. It’s a heavier lift to adopt, but it makes sense if you’re consolidating your DevOps stack anyway.
- If code quality and security vulnerabilities are your primary concern, SonarQube focuses on static analysis, technical debt, and security scanning across 30+ languages. It won’t give you DORA metrics or productivity insights, but it’s the strongest option for code health specifically.
- If you already have DevOps tooling sorted and just want analytics, Hivel and Code Climate Velocity stop at the analytics layer. Jellyfish fits here too, with stronger depth on planning, investment reporting, and DevEx correlation.
Here’s how each alternative stacks up against Opsera at a glance:
| Platform | What Sets It Apart from Opsera | Best Fit For |
| Jellyfish | Full-stack, leading SEI that connects productivity, planning, developer sentiment, AI adoption, and financial reporting in one solution | Any engineering org that wants the full engineering intelligence stack under one roof |
| Harness | SEI was built from a dedicated acquisition (Propelo), not bolted on as a feature | Teams consolidating DevOps and engineering intelligence under one vendor |
| Swarmia | Pairs productivity metrics with native developer experience surveys and Slack automation | Teams where developer sentiment matters as much as delivery metrics |
| SonarQube | Code quality and security analysis across 30+ languages – not an SEI tool, but deeper on code health | Organizations focused on technical debt, vulnerabilities, and code standards |
| Hivel | Persona-based dashboards for different roles (CTO, VP, EM) without DevOps complexity | Analytics-only buyers who want role-specific views without adopting a platform |
| Code Climate Velocity | Goal tracking, OKR alignment, and industry benchmarks for delivery metrics | Teams that tie engineering metrics to company-wide objectives and want external benchmarks |
For teams that just need analytics or code quality, the lighter options work fine.
But if you’re reporting to the board on engineering investment and planning capacity quarters out, Jellyfish gives you the depth that the others don’t.
Jellyfish – The #1 Opsera Alternative
Jellyfish – The #1 Opsera Alternative
If you’re looking for engineering insights without the overhead of a full DevOps platform, Jellyfish is built for that.
It covers delivery, planning, DevEx, AI measurement, and DevFinOps in a single platform, with the depth that comes from making SEI the entire product.
Here’s what’s included:
- AI Impact dashboard that tracks adoption, usage, and ROI across tools like Copilot, Cursor, and Claude Code (with direct ties to cycle time and throughput)
- DevEx surveys that correlate developer sentiment with DORA and SPACE metrics, so you can connect how engineers feel to how they perform
- Automatic resource allocation via a patented model that maps engineering activities to business priorities without any manual tagging
- DORA and SPACE metrics with the largest benchmark dataset in the category for internal and industry comparison
- Scenario Planner for modeling staffing changes and forecasting delivery timelines using historical data
- DevFinOps that handles software capitalization automatically with no spreadsheets or timesheets
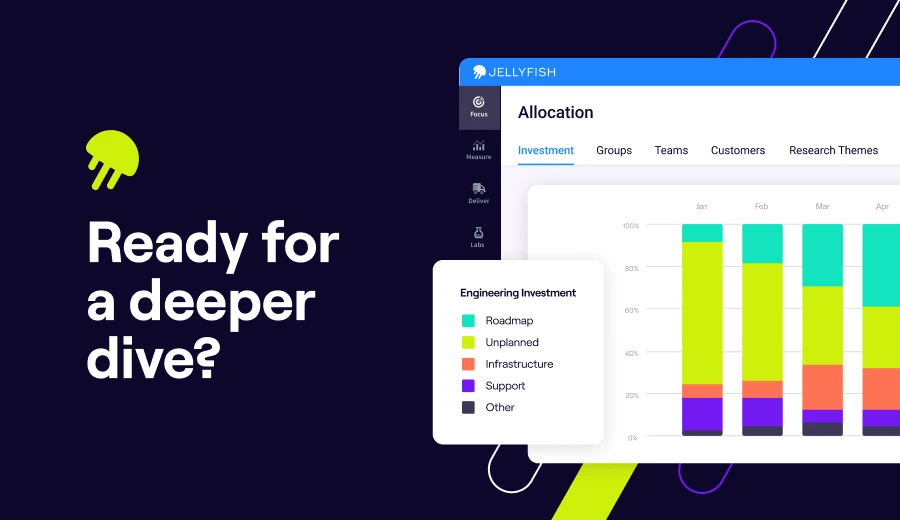
Take a Closer Look
For teams that need deeper engineering intelligence without a full DevOps platform attached, Jellyfish is the shortest path. Book a demo to see if it's the right fit.
Get a DemoFAQs
FAQs
Do these platforms work for teams running cloud-native architectures on AWS or Microsoft Azure?
Yes. SEI platforms are toolchain-agnostic, meaning they track engineering metrics regardless of whether you’re deploying to AWS, Microsoft Azure, or another cloud provider.
They measure what happens in your software development lifecycle (commit to deploy) and not the infrastructure underneath. Teams running Kubernetes clusters or microservices architectures get the same visibility as teams with simpler setups.
How do SEI platforms integrate with tools like Azure DevOps, GitHub, and other git repositories?
Most engineering intelligence platforms connect to your existing toolchain through API integrations. They pull data from your git repository, issue tracker, and CI/CD systems without requiring changes to how your team works.
How do SEI tools handle permissions and data access across different roles?
Most platforms offer role-based permissions so you can control who sees what. Engineering managers might see team-level metrics, while executives get portfolio views. Hivel takes this further with persona-based dashboards built for CTOs, VPs, and EMs specifically.
Can engineering intelligence platforms scale with growing teams and a larger tool ecosystem?
Scalability varies by platform. Pure-play SEI tools like Jellyfish are built to handle hundreds of engineers across complex tool ecosystems. Some lighter options, like Swarmia, report performance slowdowns with large datasets.
Do any of these alternatives offer open-source options or integrate with tools across the software supply chain?
SonarQube has a free, open-source community edition for teams that want code quality analysis without a paid subscription.
For broader SEI functionality, most platforms are commercial but integrate with tools across your software supply chain, including version control systems, CI/CD pipelines, and issue trackers.
If open-source is a priority, SonarQube is the main option on this list, though it focuses on code health rather than full engineering intelligence.
Do SEI platforms help operations teams with release management visibility?
Yes. SEI platforms track delivery metrics like deployment frequency, lead time, and change failure rate. These core release management signals help operations teams and engineering leads understand where bottlenecks slow things down.
Plus, this streamlines conversations around releases because everyone works from the same data.
Do any of these platforms support on-premise deployment?
Some do. Swarmia offers on-premise deployment for enterprise plans. Harness and SonarQube also support self-hosted options for organizations with strict data residency or compliance needs.
How do these tools fit into a DevSecOps workflow?
SonarQube is the strongest fit for DevSecOps since it focuses on static code analysis, security vulnerabilities, and quality gates that block risky code from reaching production. It catches issues during development rather than at runtime.