In this article
Your team ships more code than it did a year ago. Deployment counts are up, pull request volume is up, and your AI coding tools account for most of the difference. In the Jellyfish 2026 State of Engineering Management report, 64% of engineering professionals put the velocity increase from AI at 25% or higher.
More code also means more code to review, test, and maintain. The same survey found only 10% of teams with strong enablement and high adoption together, and quality drift ranked among the concerns respondents raised without prompting.
Measuring AI coding quality and performance means tracking both sides. This guide covers the metrics that do it, where the data comes from, and how to read them together.
The Automation Bias and Code Validation Challenge
The Automation Bias and Code Validation Challenge
AI coding assistants can produce code that looks like a senior engineer wrote it. Formatting is clean, syntax is correct, naming follows convention, and the whole thing looks like it was written carefully.
Reviewers respond to that presentation the way they respond to any confident output from a machine, a pattern researchers call automation bias. A junior developer submitting the same pull request would face far more questions.
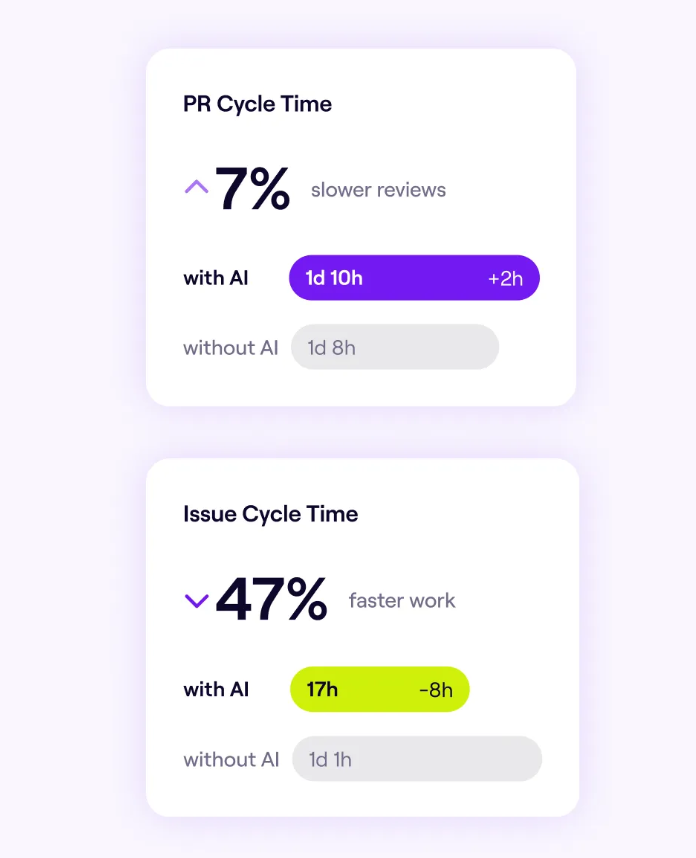
That lighter scrutiny reaches your reporting as good news. Cycle time drops, approvals come faster, and your review metrics improve precisely when your quality control is doing less work. Compilers and linters offer no correction here, because AI-generated code passes both almost every time. They confirm the code is valid, but validity has nothing to do with whether the code belongs in your codebase.
Eye-tracking research backs this up. Programmers made fewer and shorter fixations on Copilot-generated code than on code written with a human pair programmer, though the study was small and used students. Industry data points the same way, with New Relic’s 2026 AI code report finding that 62% of technology leaders say their teams often ship AI-generated code to production without line-by-line verification.
Several types of problems can clear automated checks and reach production →
- API endpoints and library methods that the model invented and that do not exist in your dependencies
- Database queries that return the right results but perform poorly at production data volumes
- Error handling that covers standard failure cases without accounting for how your systems fail
- Architectural choices that conflict with decisions your team already made
- New dependencies that were never checked against your security or licensing requirements
None of these problems has a single owner. Each one is caught at a different stage of review, by a different person, using different information, which is why AI-assisted code benefits from three separate checkpoints:
| Checkpoint | Covers | Owner | Signal to track |
| Syntax and style | Formatting, linting, type checks, test execution | Fully automated | Pipeline pass rate before human review |
| Logic and structure | Edge cases, error boundaries, invented dependencies, query efficiency | Reviewing engineer | Review depth on AI-assisted PRs against human-authored PRs |
| Context and security | Architectural fit, scalability, compliance, data handling | Senior engineer or architect | Defects traced to context failures after release |
The first checkpoint should take zero human minutes. Engineers who spend review time on formatting in AI-generated code are working on the one thing machines handle perfectly.
The second and third checkpoints are what human reviewers are for. Both ask them to do the opposite of what automation bias encourages, which is to scrutinize AI-authored code without letting its fluency lower the level of review. Tracking review depth separately for AI-assisted and human-authored pull requests tells you whether that is happening.
Core Metrics for Measuring AI Code Quality
Core Metrics for Measuring AI Code Quality
These six metrics cover the problems described above. Each one tracks something linters and a fast review both let through.
| Metric | What it measures | AI-specific risk |
| AI code rework rate | Share of AI-touched code deleted or rewritten within 30 days | AI produces plausible code that reviewers approve, and engineers later replace |
| Cyclomatic complexity trend | Structural complexity of new code over time | AI writes verbose, boilerplate-heavy code that raises long-term maintenance cost |
| Change failure rate and defect density | Failed deployments and defects per unit of code | Rising throughput with rising CFR means the team is shipping defects faster |
| Security vulnerability density | SAST and DAST alerts per pull request | AI has no access to your security context and pulls in outdated or vulnerable dependencies |
| Mutation score against code coverage | How many injected faults your test suite detects | Coverage goes up when AI generates tests, even when those tests assert very little |
| Time-in-review ratio | Active coding time against time in the review queue | AI can reduce coding time without reducing total delivery time |
How to read these → Each one only means something when you separate AI-assisted work from human-authored work. A rework rate of 6% across everything gives you nowhere to go. A rework rate of 4% on human-authored code and 11% on AI-assisted code points you at the problem, and that separation is what the next two sections build on.
PRO TIP 💡: Splitting metrics by attribution means knowing which commits and pull requests involved AI, which most SCM data will not tell you on its own. Jellyfish AI Impact detects AI’s footprint in the actual code changes at the pull request level, so every metric above can be filtered without asking developers to tag their work.
Adapting the SPACE Framework for AI-Assisted Coding
Adapting the SPACE Framework for AI-Assisted Coding
The SPACE framework measures developer productivity across satisfaction, performance, activity, communication, and efficiency. The framework predates AI coding tools, and the assumptions underneath a few of its dimensions no longer hold.
Activity counts output that a machine can now produce instantly, and efficiency measures an individual whose work has moved elsewhere. Each dimension needs a specific adjustment.
Replace Activity with Complexity-Adjusted Throughput (CAT)
What AI breaks → The Activity dimension in SPACE counts what a team produced, usually through commits, pull requests, or lines of code. Those counts worked as a rough proxy when a person wrote every line, since producing more code meant doing more work. AI removes that relationship. A developer can generate several hundred lines of boilerplate in a minute, and the Activity number treats that the same as a hundred lines someone reasoned through. GitClear reports that moved, copied, and pasted lines rose from 35% to 45% of all code changes after AI assistants became common.
The adaptation → Weight the work by difficulty. Complexity-Adjusted Throughput assigns points based on how hard a task is, so a scaffolding ticket counts as one point, and an architectural change counts as eight. What you end up measuring is the difficulty your team got through, which AI volume has no effect on. Most teams already estimate this way, so CAT works with the data they have.
What to watch for → Rising Activity with flat complexity-adjusted throughput. That pattern suggests AI is increasing the volume of easier work without changing how much difficult work the team completes. It may still be useful, but it should not be interpreted as an equivalent increase in overall engineering productivity.
Evolve Performance to Include Code Durability
What AI breaks → Performance in SPACE covers reliability and defect rates, both measured close to release. AI-generated code does well by those standards, because it passes its tests and deploys without incident. The problem comes up during the next change, when an engineer opens that code, cannot follow what it does, and replaces it. Your defect rate stays clean throughout, since nothing broke.
The adaptation → Add code turnover rate to Performance. It measures the share of committed code rewritten or deleted within 14 to 30 days, which gives you a read on durability that release-time metrics cannot provide. Anything your team keeps rebuilding was never finished the first time, however cleanly it deployed.
What to watch for → Throughput going up while code turnover goes up with it. A survey of 415 developers found that 72.7% of frequent AI users changed more lines of code per day, while most of them saw no improvement in test case pass rates. More output, same quality, and turnover rate is where that combination shows up in your codebase.
Add AI Attribution as a Sixth Dimension
What AI breaks → Every SPACE dimension assumes a single author, which was a safe assumption for as long as people wrote all the code themselves. That is no longer true, and the result is that each dimension now supports two readings at once. Higher Activity can mean a more productive team or more generated boilerplate, and better Efficiency can mean an improved pipeline or AI clearing the simple tickets. SPACE gives you no way to tell which explanation fits your team.
The adaptation → Measure the AI share of the work in each dimension and treat that share as a dimension in its own right. Every existing number then arrives with the context needed to read it. Attribution says nothing about how well your team performed, and it does not need to. Once you know the AI share, a change in any other dimension becomes much easier to interpret.
What to watch for → The same figure supporting opposite conclusions. A team with 40% higher Activity and a 15% AI code share is working differently from a team with 40% higher Activity and a 70% AI code share, though both look identical in a SPACE report. Attribution is the difference between reporting a number and knowing what produced it.
Focus on the Review Bottleneck in Efficiency and Communication
What AI breaks → Efficiency in SPACE looks at the individual developer and asks whether they can work without interruption. AI improves that, since less time goes to boilerplate and syntax lookups. The work does not disappear, though. It moves into the review queue, where someone has to read code they did not write and confirm it does what it appears to do. An efficiency metric aimed at the IDE misses that cost completely.
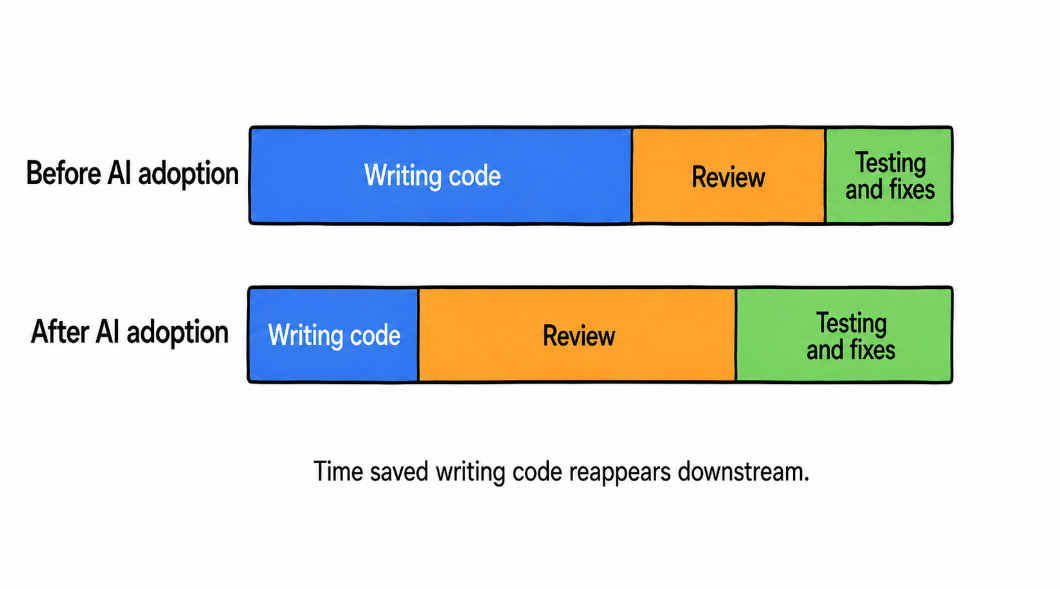
The adaptation → Measure efficiency at the system level. Review queue time shows how long pull requests wait before anyone opens them, and review load distribution shows who is absorbing the additional volume. Both belong in Communication as much as Efficiency, since review is where most technical communication in an engineering organization happens.
What to watch for → Coding time falling while review time holds steady or grows. The Developer Productivity with GenAI survey also found that 84.3% of frequent AI users saw no reduction in time spent reviewing code, and that group reported doing more reviews than developers who used AI less. The time saved during generation reappears in the review queue, usually on a smaller number of senior engineers.
Incorporate Long-Term Human Factors
What AI breaks → SPACE takes a reading of the present, which made sense when the practices behind engineering work changed slowly. AI changes those practices quickly, and some of what it changes only becomes visible over years. A developer who accepts working code without following the logic behind it closes tickets on time and looks productive in every dimension. What that developer did not build during those months is the ability to work through a problem without help.
The adaptation → Track technical expertise development and ownership of work. Expertise covers whether engineers are still building the skills the job requires, particularly debugging and architectural reasoning, which AI handles for them most readily. Ownership covers whether developers can explain, extend, and take responsibility for the code attached to their name. Neither is a telemetry metric. Both come from surveys, one-on-ones, and what happens during incident response.
What to watch for → Senior engineers describing a change in what juniors can handle alone. In the BNY Mellon interviews, a manager described new team members accepting code that works without learning the technology behind it. Developers raised the same concern from the other side, saying deep codebase knowledge comes from writing the code yourself, which is what lets you find the problem quickly during a production incident.
The five adaptations at a glance →
| Dimension | Original measure | AI-adapted measure |
| Satisfaction | Fulfillment, motivation, support | Unchanged, read alongside AI share |
| Performance | Reliability and defect rates at release | Code turnover rate at 14 to 30 days |
| Activity | Commits, pull requests, lines of code | Complexity-adjusted throughput |
| Communication | Collaboration and knowledge sharing | Review queue time and review load distribution |
| Efficiency | Individual flow state | System-level wait times across the pipeline |
| AI attribution | Not in SPACE | AI share of work behind every other dimension |
Building a Team-Level AI Measurement Framework
Building a Team-Level AI Measurement Framework
This is the practical part. The framework below comes from research at BNY Mellon and Carnegie Mellon, where a survey of nearly 3,000 developers and 11 interviews produced six productivity factors built for AI coding assistants.
Adopt a Multi-Factor Foundation
What it covers → Six factors from research at BNY Mellon, grouped by where they apply in the lifecycle. Development covers self-sufficiency and cognitive load, meaning how often developers still need help and how much time they spend on prompting and corrections. Deployment covers task completion rate and ease of peer review. Long-term covers technical expertise and ownership of work, which the researchers found missing from SPACE and DORA.
How to build it →
- Map your current metrics onto the six factors and note which have no data behind them
- Come up with survey questions for the factors telemetry cannot reach, which is most of them
- Set a cadence for each phase, weekly for development, per release for deployment, quarterly for long-term
- Make one person accountable for each phase’s data
Example → A team tracking task completion alone sees AI performing well, with tickets closing faster than last quarter. Measuring ease of peer review over the same period shows reviewers spending longer on AI-assisted pull requests. Task completion alone misses the review cost, which only becomes visible when the second measure is added.
Operationalize Dimensions with Specific Data Items
What it covers → The specific data points behind each SPACE dimension once AI-assisted work is in scope. Satisfaction covers workload manageability, exhaustion, and job security. Performance covers code turnover rate and learning velocity. Activity covers complexity-adjusted throughput. Communication covers review queue time, review depth, and how AI workflow knowledge moves between people. Efficiency covers individual flow state alongside system-level wait times.
How to build it →
- Take the metrics you already report and place each one under the dimension it belongs to
- Fill the empty dimensions first, since those are where you have no visibility at all
- Use survey items for anything about how developers feel or what they understand
- Keep every item’s definition fixed, because these numbers are only useful compared against themselves over time
Example → Communication is usually the emptiest dimension on a first pass. Most teams report cycle time, which covers how long the review stage took and nothing else. Review depth and review load are what show you whether review is still working at AI volume.
Integrate an AI Attribution Layer
What it covers → Which share of the work behind every other metric came from AI. The SPACE section explains why this is important. What it takes in practice is a record of AI involvement attached to commits, pull requests, or both, applied consistently enough that you can filter any metric by it.
How to build it →
- Capture attribution at commit or pull request level, since anything coarser cannot be filtered usefully
- Pull tool telemetry where your assistants expose it, and cover the rest through developer self-reporting
- Set one definition of AI-assisted and apply it everywhere, because mixed definitions make period comparisons meaningless
- Backfill against your version control history if you need a pre-adoption baseline
Example → Two teams report the same 40% increase in Activity. One has a 15% AI code share, the other 70%. Without attribution both appear in your reporting as identical results, and the decisions you would make about each are different.
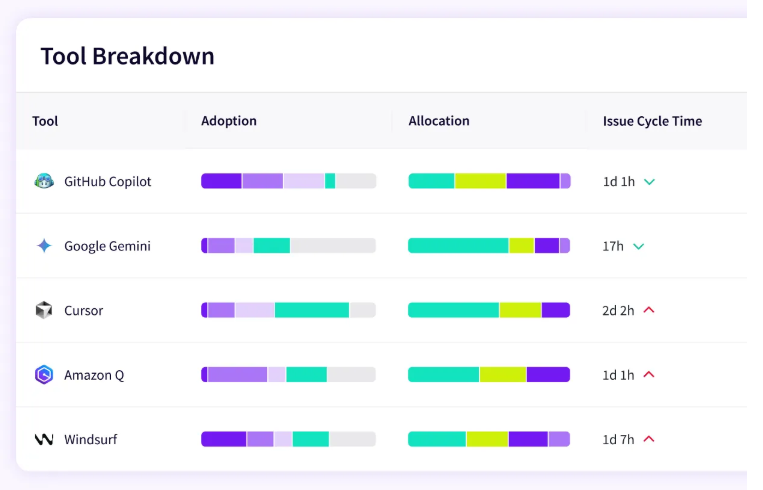
PRO TIP 💡: Building attribution yourself means maintaining detection logic across every repository and every tool your team uses. Jellyfish handles this across GitHub Copilot, Cursor, Claude Code, Gemini, Amazon Q, and Windsurf in one framework, which also lets you compare how each performs on different kinds of work.
Use a Mixed-Methods Measurement Strategy
What it covers → What developers report and what your systems record, measured side by side. Surveys handle confidence, authorship, and cognitive load. Telemetry handles review queue duration, pipeline speed, and commit frequency. The BNY Mellon study measured a weak correlation of r = 0.34 between satisfaction and perceived time savings, which is why neither set substitutes for the other.
How to build it →
- Run a short recurring survey, since these questions only work when you can compare periods
- Ask about specific experiences from the last two weeks, because general impressions follow whatever mood the team is in
- Pull telemetry from systems you already run, meaning your SCM, issue tracker, and CI pipeline
- Compare the two sets each period, since a disagreement between them is itself a finding
Example → Developers report saving several hours a week, and cycle time has not moved. Both can be accurate at once, because individual time savings do not necessarily reduce system-level cycle time. The survey identifies the perception and the telemetry identifies the outcome.
Weight the Framework by Use Case
What it covers → AI helps different kinds of work by very different amounts, so a single company-wide number averages opposite effects together. The BNY Mellon interviews found three patterns. Boilerplate and test generation showed clear benefit, with day-long tasks finishing in about an hour. Refactoring showed little benefit, since most of that work is reading code. New feature work increased volume while raising concerns about expertise and ownership.
How to build it →
- Categorize tickets by work type, using three or four buckets your team already recognizes
- Compare that category against your blended number to see how far apart they are
- Set separate expectations per category, because one target across all of them will be wrong in both directions
- Update the categories as capability changes, since the boundaries between them keep moving
Example → A team at 20% measured productivity improvement might be seeing 60% on test generation and close to zero on refactoring. The average supports a decision to expand AI usage everywhere. The breakdown supports a decision to expand it where it works.
Move from False Velocity to Sustainable Engineering with Jellyfish
Move from False Velocity to Sustainable Engineering with Jellyfish
Many of the metrics in this article already exist in your engineering systems. What they lack is the connection between them, since knowing your rework rate means little until you can separate AI-assisted code from everything else and read both against throughput.
That connection is what Jellyfish provides. As the software intelligence platform for AI-integrated engineering, it pulls signals from your source control, issue trackers, CI/CD, and your AI coding assistants, giving you one view of what AI is doing to quality and delivery.
Here is how that maps onto the framework in this article:
- AI attribution at the pull request level: Pull requests get analyzed for AI’s footprint in the actual code changes, and that data correlates with PR metadata, reviews, and throughput. This covers the attribution problem described earlier, which is the piece most teams have no way to solve on their own.
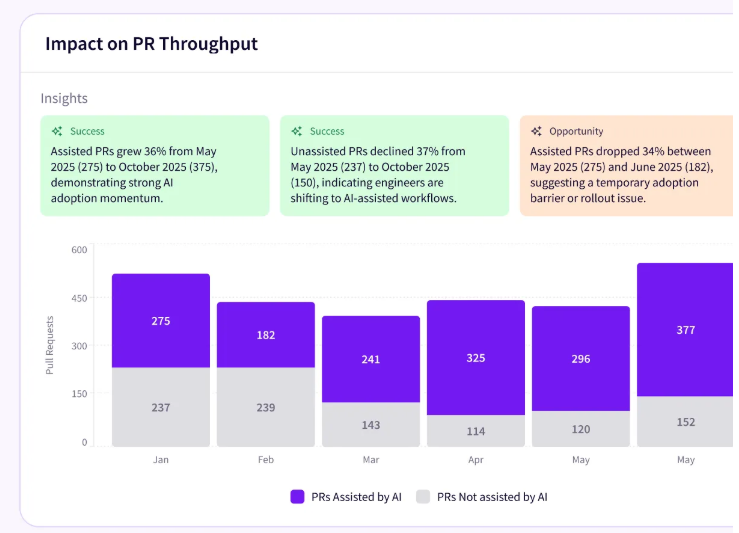
- Delivery outcomes connected to AI usage: Adoption and utilization data ties directly to cycle time, deployment frequency, defect rates, and delivery predictability. Speed and quality appear in the same view, which is what keeps a throughput increase from reading as an unqualified win.
- Multi-tool comparison: Coverage includes GitHub Copilot, Cursor, Claude Code, Gemini, Amazon Q, and Windsurf in one consistent framework. You can see which tool performs best for which kind of work, which is the use case weighting from the previous section applied to your tool stack.
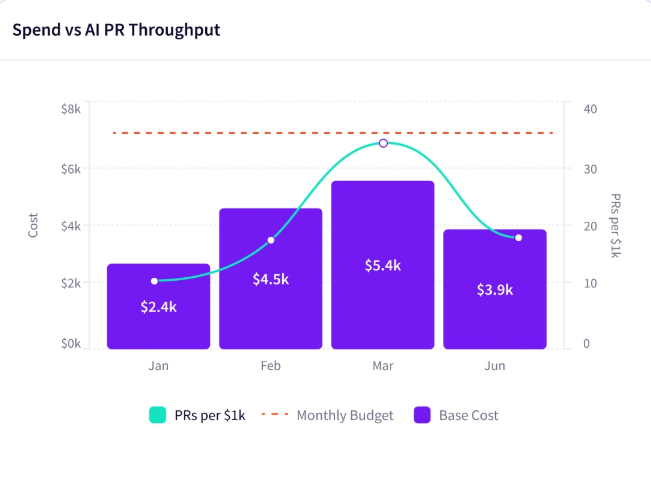
- AI token cost management: Token usage and spend get tracked across every tool, team, and model, then benchmarked against output to show which tools return value. You can also see how spend correlates with PR throughput over time and forecast from year-to-date run rate. That switches the ROI conversation from a debate about perceived time savings into a comparison between what you paid and what changed.
- Code review agent insights: Coverage extends to code review agents including CodeRabbit, Graphite, and Greptile, measured across the entire SDLC. Many teams answer the review bottleneck by adding more AI, and this is where you find out whether that worked.
- Developer experience surveys: Jellyfish DevEx pairs research-backed surveys with system data, so developer sentiment can be read against performance metrics from the same period. Both halves of the mixed-methods approach described earlier come from one platform.
Measuring AI coding quality and performance takes both halves of the picture at once, since throughput on its own supports whatever conclusion you already wanted. Attribution, code durability, review load, and spend against outcomes are what fill in the other half.
Book an AI Impact demo to see them for your engineering organization.
FAQs
FAQs
Does AI-assisted development increase technical debt?
It can, though the mechanism differs from what most teams expect. AI-assisted development produces code that passes tests and deploys cleanly, so the cost rarely appears as a defect.
It appears in maintainability, where verbose implementations, duplicated logic, and shallow test coverage make the next change harder than it needed to be. Teams that track software quality through defect rates alone will miss this entirely. Code turnover rate and cyclomatic complexity trends give you a clearer read on whether technical debt is accumulating.
How should engineering leaders measure ROI from AI agents?
AI ROI requires both sides of the equation, meaning what you spend and what changed in delivery.
- On the spend side, license costs and token consumption per team give you the denominator.
- On the outcome side, throughput, cycle time, and defect rates give you the numerator, provided you can separate agent-generated work from everything else.
AI agents complicate this further, since they open pull requests independently and consume tokens at a different rate than assistants. Measuring AI tool adoption alone answers none of this, because usage describes activity and not return.
Does high developer satisfaction mean AI tools are working?
Not reliably. Research at BNY Mellon found a weak correlation of r = 0.34 between developer satisfaction with GitHub Copilot and perceived time savings, where 86% of developers reported satisfaction while roughly 60% saved under an hour per week.
Developers can enjoy a tool that removes tedious work without that enjoyment producing measurable AI-driven time savings. Satisfaction data still belongs in your measurement program, though it answers a question about experience and not one about delivery.
About the author

Lauren is Senior Product Marketing Director at Jellyfish where she works closely with the product team to bring software engineering intelligence solutions to market. Prior to Jellyfish, Lauren served as Director of Product Marketing at Pluralsight.