In this article
Most engineering organizations adopted AI coding tools before they had a way to track what those tools cost. Usage grew across assistants, agents, and internal LLM applications, and the spend showed up as a single line on an invoice with no breakdown by team or workflow.
Token consumption is the unit that explains that invoice. It varies more than most leaders expect, and the heaviest users do not return proportionally more work.
Jellyfish analyzed 12,000 developers at 200 companies and found the cost per merged pull request runs from $0.28 among the lightest token users to $89.32 among the heaviest.
Most organizations have no idea where their own teams fall in that range. This guide covers the metrics an AI dashboard needs, the common causes of cost spikes, and how to measure token consumption against delivery.
Why AI Token Usage Monitoring Matters Now
Why AI Token Usage Monitoring Matters Now
Engineering software used to cost what the hiring plan said it would cost. Add a developer, add a seat, and the budget moved by a known amount.
AI coding tools broke that arithmetic because they price by consumption. The same ten engineers can generate very different bills from one month to the next, depending on what they do with the tools.
Four variables account for most of the swing:
- Model selection: Frontier reasoning models carry per-token rates an order of magnitude above small, fast models.
- Context size: Large system prompts and wide context windows push more tokens into every request.
- Retrieval strategy: Weak retrieval pulls in far more files than the task needs, and the model reads all of them.
- Agent autonomy: One task can trigger a long run of planning, editing, testing, and retrying, and each step bills as another call.
Pricing brings one more variable. AI coding tools bill across three token types, and input, output, and cache reads and writes each carry their own rate. Two developers can consume identical volumes and still cost different amounts, depending on how their tools handle context.
Jellyfish data shows what that variance costs. The median developer spends about $52 a month on tokens. The 90th percentile spends closer to $691, roughly thirteen times more. In token terms, the gap runs from about 51 million per month at the median to roughly 380 million at the top. A small group of power users accounts for most of that total, and an org-level number hides every one of them.
Example → Run that math at organizational scale. A 200-developer org sitting at the median spends about $10,000 a month on tokens. Move twenty of those developers to the 90th percentile and the bill climbs past $23,000, with nobody hired and no roadmap changed.
The Core Metrics for an AI Usage Dashboard
The Core Metrics for an AI Usage Dashboard
Different metrics explain different parts of the picture. Some show where the budget goes, while others point to inefficient workflows or changes in developer behavior.
Together, they provide enough context to understand AI spend. The table below summarizes the core metrics and what each one tells you.
| Metric | What it tells you | Warning sign |
| Total token consumption | The baseline for every invoice and forecast. This is the number finance works from and the one that anchors budget conversations. | Consumption that climbs faster than headcount and roadmap scope, which means workflow changes are driving the bill. |
| Usage by tool | How the budget splits across assistants, agents, and internal LLM applications. | One tool holding a large share of spend while few developers touch it. |
| Usage by team and user | Where consumption concentrates, down to the accounts responsible for it. | A small group carrying a share of spend well above its share of the work. |
| Input, output, and cache mix | How well your tools handle context. Input dominates most coding workloads, and cache reads price below the other two types. | Input climbing faster than output, or cache reads sitting near zero. |
| LLM call volume | How much traffic your tools generate, counted separately from the token weight of each call. | Calls rising faster than tokens, which points to retries and agent loops. |
| Response latency | Whether developers keep the tool switched on. A slow tool gets disabled and keeps billing for its seat. | A p95 slow enough that developers turn features off. |
| Spend by provider and model | Which vendors and models consume the budget, and how much leverage you carry into a renewal. | Premium models running work a cheaper model handles well. |
These metrics provide an operational view of AI usage. They explain how teams use AI, where costs increase, and which workflows deserve attention. To assess the return on that spend, engineering leaders also need to compare usage with engineering outcomes.
The next section looks at how token consumption relates to PR throughput, cycle time, code review activity, and delivery impact.
Tying Token Consumption to Engineering ROI
Tying Token Consumption to Engineering ROI
Every token your teams consume gets metered somewhere, usually by the AI tool itself, an internal gateway, or the provider’s API. Every pull request they ship gets recorded somewhere else, in Git and Jira and the CI/CD pipeline.
Both records are accurate, and nothing connects them. A token count arrives attached to a request ID, while a merged PR arrives attached to a commit, and no field in either one points at the other. Someone has to read both and work out which tokens produced which code.
Take a pod that burned 100 million tokens last month. Three questions decide whether that was money well spent:
- Did the pod ship more than it shipped before?
- Did the work move through review faster?
- Did the code hold up once it got there?
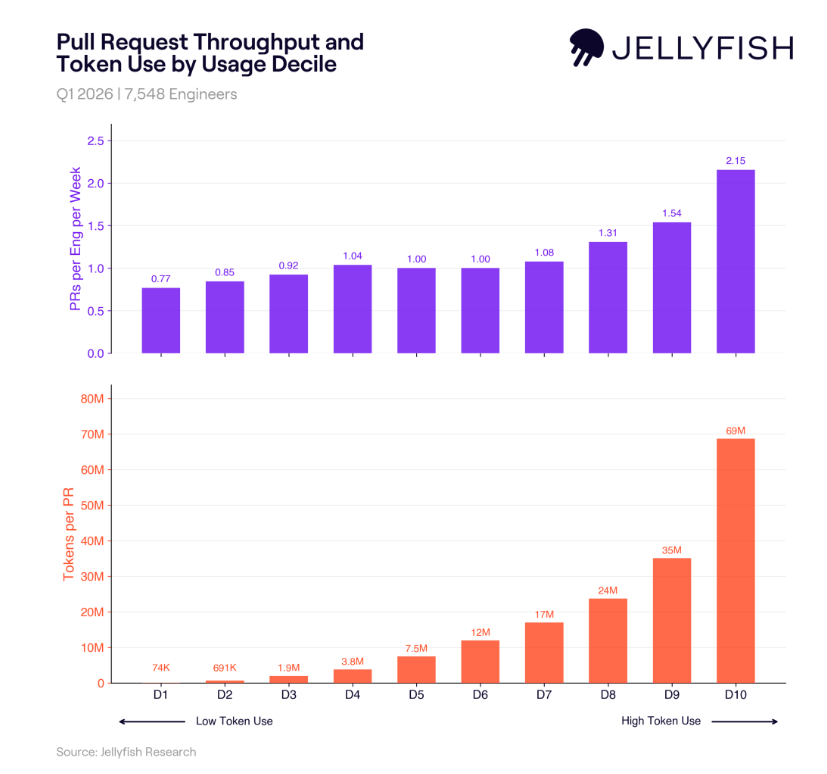
Jellyfish sorted 7,548 engineers into deciles by token use and found that output does rise with consumption, climbing from 0.77 PRs per engineer per week at the bottom to 2.15 at the top. The price of each one rises faster. A median developer spends about 7.5 million tokens per PR, while the top decile spends 69 million, which works out to ten times the tokens for a bit over twice the work.
There are four measurements that bring that comparison down to team level:
- Tokens per PR: Tracks efficiency as a trend line. The number only means something against a team’s own history, since a typo fix and a 2,000-line refactor both count as one PR.
- PR cycle time: Measures whether AI-assisted work clears review faster. A rise here can mean the tool produces code that reviewers slow down on.
- Code review activity: Catches quality effects that raw throughput hides. More PRs matter less if each one takes longer to approve.
- Roadmap and KTLO allocation: Shows which category of work absorbed the tokens. Maintenance throughput and feature throughput cost the same and return very differently.
Jellyfish pulls token data from Copilot, Cursor, Claude Code, and the agents alongside them, joins it to the Git and Jira records your teams already generate, and tracks spend against PR throughput over time.
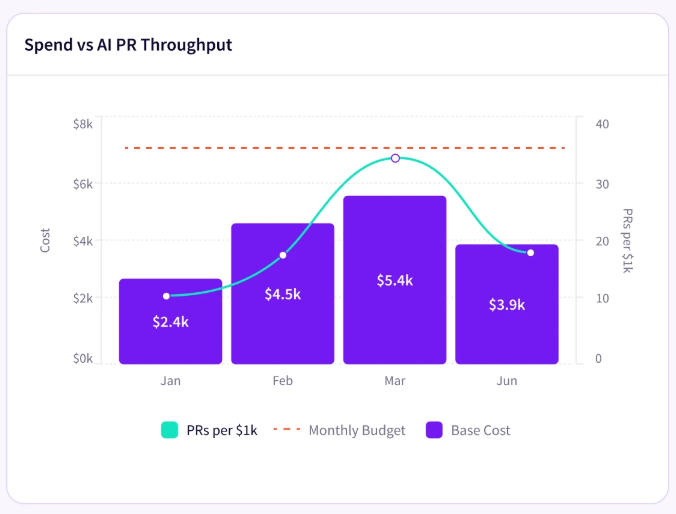
None of that takes new instrumentation. Git and Jira have held the delivery record for years, and the token data comes from the tools your developers already have open.
Common Causes of Cost Spikes & How to Optimize Them
Common Causes of Cost Spikes & How to Optimize Them
Most AI cost spikes come from the way teams set up prompts, models, and workflows. A small problem in any of these areas can raise token use across many requests.
The following issues are the most common places to look:
Bloated Context and Over-Retrieval
Large context windows can push token usage up quickly. A request may include far more code, history, or documentation than the model needs to complete the task.
This often happens when retrieval rules are too broad or prompts contain repeated guidance. The extra context raises cost and can also slow the workflow down.
How to optimize it →
- Set retrieval limits so the workflow pulls only the files, code blocks, or documents that match the task.
- Keep system prompts concise and avoid repeating instructions across multiple layers of the workflow.
- Reduce context window size for routine tasks that do not require repository-wide awareness.
- Use caching for stable context, such as shared documentation or coding standards, so the model does not process the same material from scratch on every call.
Example → A developer asks an AI coding assistant to rename a variable in a single file. Instead of sending just the relevant code, the retrieval system includes dozens of related files and project documentation. The change still takes a few seconds to complete, but the request consumes far more input tokens than the task requires.
Choosing the Wrong Model for the Job
Not every AI task requires the most capable model. Teams often default to a premium model for every request, even when a smaller or faster model can produce similar results. Over time, that choice increases costs across thousands of requests.
How to optimize it →
- Reserve premium reasoning models for tasks that need deeper analysis or complex code generation.
- Use smaller, faster models for autocomplete, summarization, and similar routine work.
- Test multiple models on representative workloads before standardizing on one.
- Reevaluate model choices as pricing and model capabilities evolve.
Example → A team routes every request through the same premium model, including code summaries and documentation updates. Moving those routine tasks to a smaller model reduces costs while maintaining the same quality.
Agentic Workflows That Generate Too Many LLM Calls
AI agents often divide one task into several steps and use a separate model call for each one. A coding agent, for example, may inspect files, propose a plan, generate code, run tests, review the output, and revise its work. This can improve the result, but it also makes token use harder to predict. A small change in agent logic can add many extra calls across a large team.
How to optimize it →
- Set limits on the number of retries and planning steps an agent can perform before it stops.
- Review workflows with unusually high LLM call counts to find unnecessary loops.
- Use simpler workflows for routine tasks that do not need autonomous planning.
- Monitor both token usage and LLM calls to understand where costs increase.
Example → An engineer asks an AI agent to investigate a failing integration test. The agent inspects logs, searches the repository, proposes a fix, reruns the tests, and revises the code after each failure. A task that appears simple from the outside can consume a large number of tokens before it reaches a working solution.
Missing Guardrails and Cost Controls
AI usage changes over time. Teams update prompts, switch models, add new tools, and deploy new workflows, all of which can affect token consumption. Without guardrails to monitor these changes, engineering leaders have little visibility into where costs increase or what caused them.
How to optimize it →
- Set expected usage ranges for each team and workflow so you can compare current spend with a clear baseline.
- Define thresholds for unusual usage and investigate them while the related change is still recent.
- Give high-cost or autonomous workflows clear limits for calls, retries, and total spend.
- Review inactive tools, old API keys, and unused workflows regularly to remove sources of background spend.
Example → A team updates the system prompt for an internal coding assistant to include additional documentation and coding guidelines. The change improves consistency, but it also doubles the number of input tokens for every request. Because no one monitors usage after deployments, the increase goes unnoticed for several weeks.
Inactive Workflows and Shadow AI
Engineering organizations tend to accumulate AI tools over time. What starts as a proof of concept or a small internal automation may become part of production, while newer solutions gradually take its place. Unless teams review their AI portfolio regularly, they may continue paying for workflows that no longer support current engineering priorities.
How to optimize it →
- Schedule periodic reviews of AI tools, automations, and agents across engineering teams.
- Remove or disable workflows that no longer support active products or development processes.
- Separate experimental projects from production workloads to make inactive tools easier to locate.
- Track usage trends over time and investigate workflows that continue consuming tokens despite low adoption.
Example → A prototype AI assistant moves into production during a busy release cycle. Over time, another tool replaces it, but the original service continues to run because no one formally decommissions it. Usage reports reveal steady token consumption despite almost no active users.
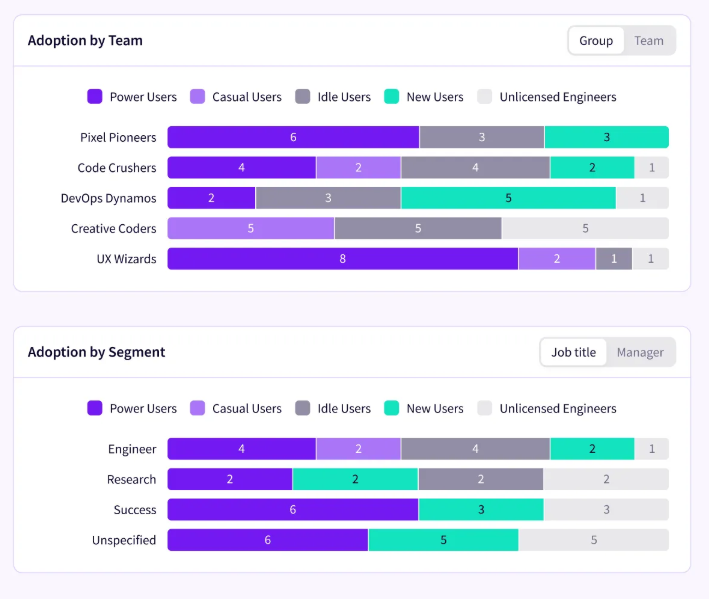
PRO TIP 💡: Shadow AI is hard to inventory because nobody registers it. Jellyfish detects which AI tools your developers use from system signals, without surveys or self-reporting, which picks up the workloads nobody put on a list.
Best Practices for AI Token Usage Tracking
Best Practices for AI Token Usage Tracking
There are six practices worth following in any AI monitoring program. They cover what to measure, how to break it down, and what to do with the results:
- Compare token usage with engineering output: Token consumption shows how much AI a team uses, but it doesn’t explain whether that usage improves delivery. Review token data alongside metrics such as PR throughput, cycle time, and code review activity to understand whether higher AI investment translates into better engineering results.
- Segment by team, model, and workflow: Aggregate totals hide the distribution underneath them. A single org-level number averages a developer who spends $52 a month against one who spends $691, and the result describes neither of them.
- Track latency alongside cost: Model choice affects both, and the cheaper model is often the slower one. Autocomplete tolerates very little delay, while a background agent tolerates a lot. Track p95 latency per tool and read it against that tool’s spend before you route a workflow to a cheaper model.
- Track the full token mix: Total consumption provides a useful baseline, but the mix of input, output, and cached tokens often explains much more. Changes in that balance can point to inefficient prompts, oversized context windows, or workflows that generate more output than necessary.
- Set alerts on unusual usage patterns: Alerts work on percentage change in daily or weekly consumption, and thresholds per team catch more than a single org-wide threshold. The common triggers are a workflow change, a model change, a new user, and a retry loop.
- Decide what chargeback should encourage: Full allocation makes teams cost-conscious. Partial allocation, where a baseline gets absorbed centrally and only usage above it gets charged back, keeps accountability without discouraging developers who barely use the tools yet.
- Review default model choices quarterly: Workflows get a model at build time and keep it. Pricing and model performance both move faster than that. A quarterly review over the model-level spend breakdown finds the workflows paying frontier rates for routine work.
Quick tip → Start with visibility before optimization. Teams often discover unnecessary AI costs simply by understanding where tokens are used and which workflows generate them. Once that baseline is in place, it becomes much easier to decide where optimization will have the greatest impact.
Types of AI Monitoring & Measurement Tools
Types of AI Monitoring & Measurement Tools
AI monitoring is not a single category of software. Different tools focus on different parts of the AI lifecycle, from debugging prompts and managing infrastructure to tracking costs and measuring engineering outcomes.
The table below summarizes the main categories and the role each one plays:
| Category | What it does | Best for | Typical users |
| Native AI vendor dashboards | Show token usage, API requests, costs, and basic usage statistics for a single AI provider. | Teams that want basic visibility into AI usage within one platform. | Tool admins, engineering managers |
| LLM observability & tracing | Capture individual AI requests, prompts, responses, latency, and model behavior. | Debugging prompts, troubleshooting AI applications, and improving model performance. | AI engineers, developers building LLM applications |
| AI gateways & proxies | Route requests between applications and AI providers while managing authentication, policies, rate limits, and model selection. | Organizations that need centralized AI infrastructure and governance. | Platform engineering, infrastructure teams |
| AI cost and usage management | Track token consumption, spending, budgets, and cost allocation across AI services. | Monitoring AI costs, forecasting budgets, and improving financial visibility. | Finance, FinOps |
| Software Engineering Intelligence (SEI) platforms | Combine AI usage data with engineering metrics such as delivery, cycle time, code reviews, and developer activity. | Engineering leaders who want to understand whether AI investment improves software delivery and engineering performance. | Engineering leaders, VPs of Engineering, CTOs |
Most organizations run several of these categories at once, and each tool covers the part of the AI lifecycle it was built for. Their shared limitation is that they all read the AI side of the stack, whether that means routed traffic, individual requests, or invoices. The record of what teams delivered is in Git and Jira, so the question of whether AI spend produced anything falls outside what any of these tools can report on.
Software engineering intelligence platforms cover that part of the lifecycle, and Jellyfish reads both sides of it. Token data comes in from the AI tools your teams already use, the delivery record comes from Git and Jira, and the platform maps one onto the other so that spend and output can be read together.
None of your existing tooling comes out in the process, since Jellyfish reports on the traffic a gateway routes without doing the routing itself.
Track AI Token Usage with Jellyfish
Track AI Token Usage with Jellyfish
Engineering leaders need a practical way to bring together AI usage, costs, and engineering metrics without switching between multiple dashboards or manually combining data from different systems.
Jellyfish is an SEI platform that measures engineering work across an organization. Its AI Impact product covers the AI side of that, tracking token consumption, spend, developer adoption, and delivery performance together, so a leader can evaluate AI investment against the engineering goals it was meant to serve.
What the product covers for AI token monitoring:
- Tool ROI benchmarking: Every AI vendor reports its own activity metrics, and none of them compare cleanly. Jellyfish measures all of them against a single model, benchmarking token spend against output so a leader can see which tools produce value.
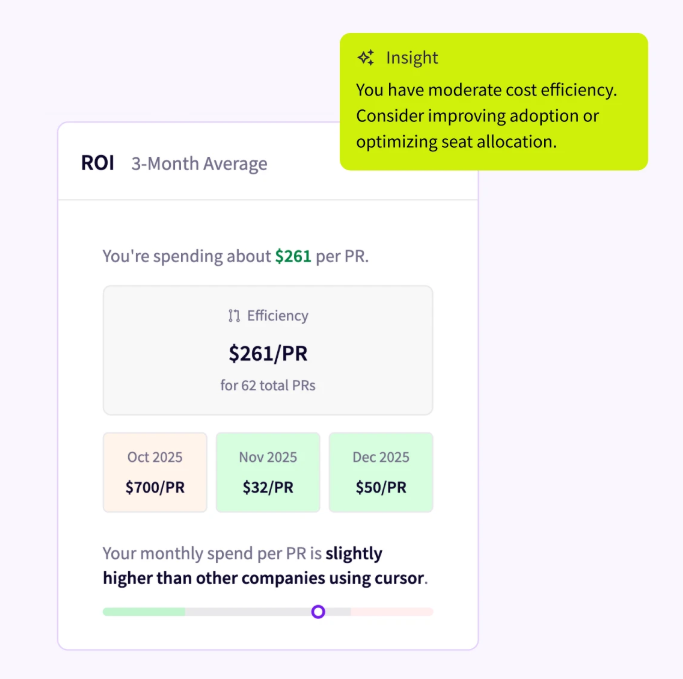
- Spend measured against throughput: Jellyfish tracks how token consumption correlates with PR throughput over time. A team’s trend line against its own history is the comparison that holds up, given that productive developers tend to use more of everything.
- Output drivers: Throughput is an aggregate, and aggregates hide the work underneath them. Jellyfish opens up the PR events behind the number, which shows where the output came from and how much AI had to do with it.
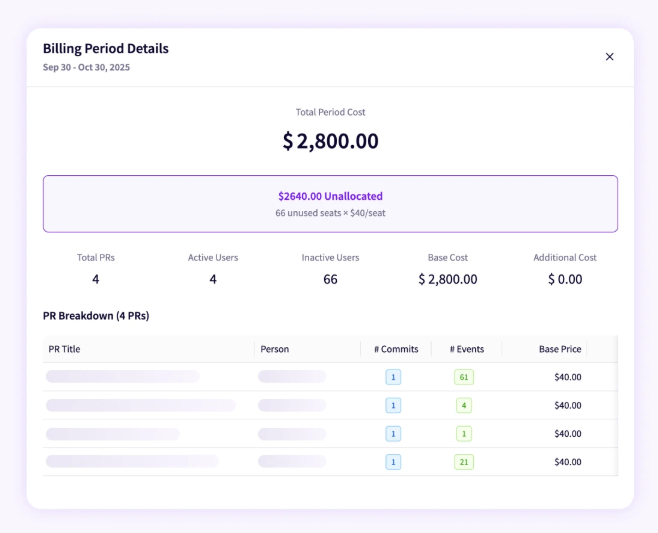
- Roadmap and KTLO breakdown: Jellyfish reports how AI changes the split between roadmap work, innovation, and KTLO. A pod that burns 100 million tokens on maintenance and a pod that burns the same on feature work produce identical invoices and very different quarters.
- Budget forecasting: The platform reports YTD token spend, projected spend, and run rate, which covers what finance needs for the next planning cycle. The same data supports cost allocation and chargeback across business units.
Everything in this guide comes down to reporting usage and delivery together. Jellyfish does that across every AI tool your teams use, with no tagging or migrations involved.
Get an AI Impact demo to see what it reports on your teams.
FAQs
FAQs
Which models should teams use to optimize costs?
Reserve frontier models for work that needs them. A reasoning model from Anthropic or a premium option like GPT-4o costs an order of magnitude more per token than a smaller, faster model, and much of what an engineering team runs through AI does not need that capability.
Autocomplete, summarization, and documentation updates all run acceptably on lighter models, including open-weight options like Mistral.
Test a few candidates on representative workloads, then route each workflow to the cheapest model that clears your quality bar. Revisit the choice every quarter, since LLM cost and model performance both move quickly.
How do input and output tokens differ, and why does the split matter?
Input tokens cover everything the model reads, including the system prompt, the conversation history, and any retrieved files.
Output tokens cover what the model writes back. Each type carries its own rate, and most providers price output several times above input, while cache reads price below both.
Most usage dashboards report a single “total_cost” field, and that number hides where a problem starts. When you monitor token usage, track the three types separately. Input climbing against flat output points to context bloat. Output climbing on its own points to verbose responses or an agent that generates without converging.
About the author

Lauren is Senior Product Marketing Director at Jellyfish where she works closely with the product team to bring software engineering intelligence solutions to market. Prior to Jellyfish, Lauren served as Director of Product Marketing at Pluralsight.