In this article
Your DevOps pipeline decides how fast your team ships, how often things break, and how much time engineers spend on actual product work.
Get the pipeline right, and releases go out on schedule, bugs get caught early, and your team has time to build new features. Get it wrong, and every downstream metric pays the price.
DORA’s State of DevOps research found that elite software delivery teams are twice as likely to meet or exceed their organizational performance goals, and a clean pipeline is what separates the two.
This article walks through the core stages of a modern DevOps pipeline, the components that handle each stage, the bottlenecks that show up most often, and how to assess the strength of your own setup.
What is a DevOps Pipeline?
What is a DevOps Pipeline?
A DevOps pipeline is the automated workflow that moves a code change from a developer’s laptop to production, along with the feedback that flows back to the team.
It chains together the automated processes a team uses to plan, build, test, release, run, and monitor software, so a single commit can trigger everything downstream without anyone manually moving work between stages.
Before DevOps caught on, releases went out once a month or once a quarter. Developers wrote the code, operations teams took it from there, and any production issue turned into a blame match between teams who barely talked.
A DevOps pipeline replaces those handoffs with one connected system that runs code, infrastructure, security checks, and monitoring through the same automated flow.
Every mature pipeline shares a few fundamentals →
- Automated movement between stages, with no manual handoffs
- Version control as the single source of truth for code, infrastructure, and pipeline configuration
- Feedback at every stage, so problems get caught early
- Shared visibility across developers, ops, security, and leadership
- Infrastructure is managed the same way as application code
What it looks like in practice → An engineer opens a pull request in GitHub. GitHub Actions runs the unit tests and a Snyk dependency scan. The team reviews and merges. Terraform spins up a fresh staging environment, integration tests run against it, and the build deploys to production behind a LaunchDarkly feature flag. Datadog watches error rates while the flag rolls out to ten percent of users, then fifty, then everyone. If something looks off, the team kills the flag without redeploying.
The Core Stages of the DevOps Lifecycle
The Core Stages of the DevOps Lifecycle
The DevOps lifecycle is the full path a piece of software travels, from someone deciding it should exist to a team running it in production and learning from how it behaves.
It’s usually drawn as a loop because the work doesn’t stop at deployment. What you learn from operating the software feeds back into the next round of planning, and the cycle starts again.
Most teams break the lifecycle into four phases. Each one pairs two closely related stages that almost always run together in practice:
Plan and Code
This phase covers everything from deciding what to build to writing the software itself. Product, engineering, and design define what’s coming next, break it into tickets, and prioritize the work. Engineers then pick up tickets, write code locally, and open pull requests for review.
However, the line between planning and coding is fuzzy enough that even engineers studying DevOps processes formally end up unsure whether Plan is officially its own phase.

The handoff between planning and coding is where a lot of pipelines start to lose time. If tickets show up half-defined, engineers spend cycles asking questions or building the wrong thing.
On the other hand, if code review queues pile up, finished work waits days before it can move to the next stage. Both problems show up later as missed deadlines and frustrated teams.
Common tools →
- Planning and tracking: Jira, Linear, Asana, GitHub Projects
- Documentation: Confluence, Notion
- Source control: GitHub, GitLab, Bitbucket
- Code editors: VS Code, JetBrains IDEs, Cursor
- Code review: Native pull request tooling in GitHub or GitLab, plus automated assistants like CodeRabbit
Example of a healthy plan and code phase → Tickets arrive with clear acceptance criteria while engineers move from a ticket to a draft pull request without blockers. Most pull requests get reviewed within a day.
Build and Test
This is where code gets compiled into something runnable and put through automated checks before anyone ships it. The build step pulls source code from the shared repository, resolves dependencies, compiles or packages it, and produces an artifact (a container image, a binary, a deployable bundle).
Then, the test step runs that artifact through unit tests, integration tests, code quality scans, security checks, static analysis, and validation through performance tests.
This phase is where the speed-versus-quality tradeoff plays out. Slow builds and tests train engineers to context-switch while they wait, which stretches cycle time. Shallow tests let bugs through to production. The goal is fast, trustworthy feedback within minutes of a push.
Common tools →
- Build automation: Jenkins, CircleCI, GitHub Actions, GitLab CI, Buildkite
- Containerization: Docker, Buildpacks
- Artifact registries: Docker Hub, JFrog Artifactory, GitHub Container Registry
- Testing frameworks: Jest, Pytest, JUnit, Cypress, Playwright
- Security and dependency scanning: Snyk, Dependabot, SonarQube, Trivy
Example of a healthy build and test phase → Builds finish in under ten minutes for most services, and the test suite gives a clear pass or fail signal that engineers trust. Security scans hook known vulnerabilities at the pull request stage, well before any code reaches production.
| Benchmark check → Healthy build times for most services run between 5 and 15 minutes. Anything over 30 minutes for a typical service usually points to a slow test suite, missing parallelization, or accumulated dependencies that need cleaning up. |
Release and Deploy
This phase decides how a tested change reaches users and how fast it can come back if something goes wrong. Release is the version cut, which produces a tagged artifact, release notes, and a published build. Deploy puts that build on the production infrastructure.
The two work together, but they’re separate steps. A software release can sit ready for hours before it deploys, and many teams deploy a release behind a functionality flag well before they turn the change on for users.
Deployment strategy carries most of the weight here. Pushing every change to everyone at once is quick but risky. Blue/green deployments, canary releases, and feature flags give a team a way to ship in stages, monitor real traffic, and reverse a bad change without a redeploy. The aim is to make production deployments boring.
Common tools →
- CD platforms: Argo CD, Spinnaker, Harness, GitHub Actions, GitLab CI
- Infrastructure as code: Terraform, Pulumi, AWS CloudFormation
- Container orchestration: Kubernetes, Amazon ECS, Google Cloud Run
- Feature flags and progressive delivery: LaunchDarkly, Split, Flagsmith, Unleash
- Artifact registries: JFrog Artifactory, GitHub Container Registry, Amazon ECR
Example of a healthy release and deploy phase → Engineers ship to production multiple times a day without a war room, and deployments roll out gradually behind feature flags or canary stages. A bad release gets rolled back in minutes, with no redeploy needed.
Operate and Monitor
This stage covers two sides of the same work. Operate is the day-to-day motion of incident response, on-call rotations, capacity planning, scaling, and patching.
Monitor is the data module underneath. Logs, metrics, traces, and alerts tell the team what’s happening inside the systems and when something needs attention.
Common tools →
- Monitoring and observability: Datadog, New Relic, Honeycomb, Grafana, Splunk
- Log management: Elastic, Sumo Logic, Loki
- Incident response: PagerDuty, Opsgenie, Incident.io
- Status pages: Statuspage, Better Stack
- Cloud-native monitoring: Amazon CloudWatch, Google Cloud Operations, Azure Monitor
Example of a healthy operate and monitor phase → A team sees production problems on a dashboard before customers feel them, and on-call engineers can triage from the context already in front of them. The next planning cycle picks up where production left off, and user behavior sets the priorities.
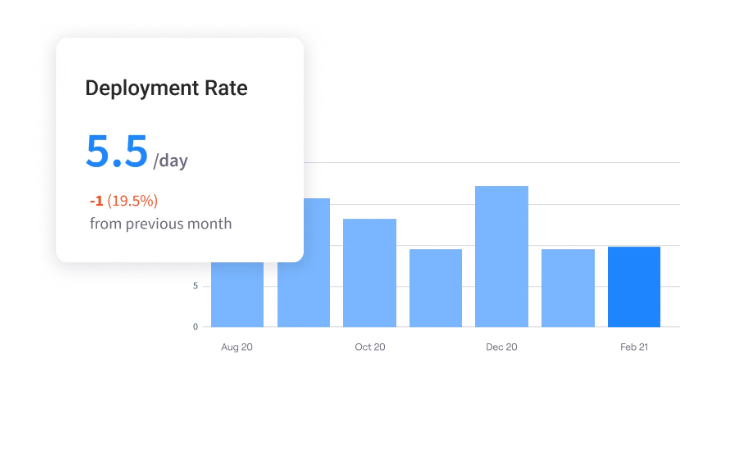
PRO TIP 💡: The biggest payoff from the operate and monitor phase comes from feeding production data back into the next planning cycle. Most teams collect logs and metrics, then plan the next sprint based on opinions and gut feel. Jellyfish’s allocations and DORA dashboards bring production performance directly into planning conversations, so engineering effort lines up with what the data shows.
Benefits of an Automated DevOps Pipeline
Benefits of an Automated DevOps Pipeline
The cost of running without an automated pipeline is rarely a line item, though it shows up everywhere. Slow releases, broken deploys, late nights chasing production issues, and engineers stuck on manual work.
The eight benefits below are what DevOps teams get back when they fix it:
- Fewer broken deploys: Automation runs every test, scan, and approval gate the team sets up, no matter how rushed the day feels, which keeps human error out of the path to high-quality software. DORA’s State of DevOps research finds that elite performers have a 3x lower change failure rate than low performers, and the bad deployments that slip through get caught and rolled back faster.
- Quicker bounce-back from incidents: Outages happen on every team. The difference is how fast they get caught and reversed. The same DORA research found that elite performers recover from failures in minutes, while low performers take a week or more, and the gap traces straight back to pipeline maturity.
- More time for product work. Engineers lose less of the day to broken builds, environment mismatches, and manual handoffs. McKinsey found that companies with strong tooling, including CI/CD, are 65% more innovative than the bottom quartile, and pipeline maturity is the biggest driver.
- Shorter time from commit to production: An automated pipeline shortens the path from code commit to customer use. DORA’s 2022 State of DevOps Report found that teams who combine version control systems and continuous delivery are 5x more likely to have high software delivery performance than teams who only focus on one, and the gap widens as engineering organizations scale.
- Stronger business outcomes: The benefits compound over time. 99% of organizations that practice DevOps report positive effects on their business, with gains in time to market, customer satisfaction, and revenue per engineer. Teams who operate their pipelines well outperform teams who don’t.
- Better security through shift-left: An automated pipeline runs security checks on every commit, alongside the build and test stages, well before code reaches production. Black Duck’s 2024 Global State of DevSecOps Report found that 36% of teams identify industry DevSecOps best practices as a top priority for security testing, with automation ranking just behind. The pipeline is what makes that automation possible.
Best Practices for Building a Scalable DevOps Pipeline
Best Practices for Building a Scalable DevOps Pipeline
A pipeline that runs cleanly for one team often falls apart once five teams are pushing services through it. Plenty of engineers know the feeling.

The practices below cover what holds up at scale, with concrete signals you can use to check your own setup.
Treat Your Pipeline as Code
Anything that defines how your pipeline runs (CI configs, infrastructure code, deployment scripts) belongs in version control next to the application code. The same review process applies.
Open a pull request, get a second pair of eyes, and merge. From there, the pipeline has a clear history, rollbacks are one command away, and a new service can pick up a working setup by copying a template. Pipelines edited by hand in the CI tool usually break in ways nobody can trace later.
Signs you’re doing this well →
- Pipeline configs (CI/CD YAML, Terraform, Helm charts) belong in the same repo as the code they deploy, or in a clearly named platform repo
- Every change to the pipeline goes through a pull request with at least one reviewer
- A new service can pick up a working pipeline from a template in under an hour
- Rolling back a bad pipeline change takes one Git command and a redeploy
- New engineers can find and read every pipeline definition on their own
Example → A platform team at a SaaS company keeps every pipeline definition in a single Git repo, with one folder per service. When a developer adds a new microservice, they copy the closest matching template, change a few values, and open a pull request. The platform team reviews and merges it. Within an hour, the new service has a working CI/CD pipeline with the same security scans, deployment gates, and observability hooks as every other service in the org.
Run Security Checks on Every Commit
Security belongs inside the pipeline, alongside the build and test stages. Every commit triggers the same automated checks that include dependency scans, static analysis, secrets detection, and container image scans where they apply.
The cost difference is dramatic. A vulnerability caught at the pull request stage takes minutes to fix, since the engineer who wrote the code still has the context. The same vulnerability found in production three months later takes a week, often with a different engineer doing the work.
Signs you’re doing this well →
- Every pull request triggers static analysis, dependency scanning, and secrets detection
- Security check failures block merges by default, with a clear path to override for false positives
- Container image scans run as part of the build, before the image gets pushed to a registry
- Findings flow back to the developer who opened the PR, with enough context to act on
- The security team and engineering team work from the same dashboard, with shared definitions of what counts as a blocker
Example → A fintech platform runs Snyk and Trivy on every pull request. A developer pulls in a new logging library with a known CVE. The PR fails within ninety seconds and points to the version that fixes it. The developer bumps the dependency, the checks pass, and the vulnerability never reaches production.
| Quick note → Security check failures should block roughly 5-10% of pull requests in a healthy pipeline. Below 5% and the checks aren’t sensitive enough. Above 15% and false positives are wearing down developer trust, which is the fastest way to get scans bypassed entirely. |
Standardize the Pipeline Across Teams
A platform team maintains a shared set of pipeline templates that match the patterns most services at your org follow. Teams adopting one of those templates get the security scans, deployment gates, and observability hooks already worked out.
The point is to make the common path the easiest one to take. A new service spins up in an hour with the same defaults as every other service. Engineering leaders get one place to roll out new policies, swap tooling, or upgrade a base image.
Signs you’re doing this well →
- A small set of pipeline templates covers most service types in the org (web service, batch job, data pipeline, etc.)
- A platform team owns the templates, and ships updates the same way application teams ship features
- Teams can extend a template for genuine edge cases, with the extensions reviewed by the platform team
- A change to security scanning or deployment policy can roll out to every service through a template update
Example → A platform team at a 200-engineer SaaS company maintains five pipeline templates, one for each common service type. Each template comes with the same security scans, deployment gates, and observability defaults. When a new SBOM requirement comes in, the platform team updates the templates once, and every service picks up the change on its next deployment. Individual teams can add extras like a custom load test, but the security and policy floor stays the same everywhere.
Design for Safe Deployments
Every deployment carries some risk, so the pipeline should make every deployment easy to reverse. Blue/green deployments, canary releases, feature flags, and automated rollbacks all give a team ways to ship changes gradually and pull them back when something goes wrong.
Software engineers should be able to run a deployment on a Tuesday afternoon without thinking twice. A change ships behind a flag, the team watches error rates, and the flag opens to ten percent of traffic, then fifty, and then everyone. When deploys feel risky, teams batch changes into bigger releases that are even riskier, and the cycle gets worse.
Signs you’re doing this well →
- Production deploys happen multiple times a day without a war room or special approval
- Most changes ship behind a feature flag, with gradual rollouts to a subset of end users
- A bad deploy gets rolled back in minutes through a flag flip or a one-command revert
- The team can deploy on a Friday afternoon without anyone flinching
- Deploy strategy (canary, blue/green, flag-gated) is a standard part of the pipeline, not a per-team decision
Example → A consumer app team ships every change behind a feature flag. A new checkout flow deploys with the flag off, opens to one percent of users, then ten, then fifty, then everyone, with the team watching dashboards at each step. When a later deployment spikes the error rate, the team kills the flag in seconds, and customers never feel the bug.
Track DORA Metrics from Day One
DORA metrics give an engineering leader a clear read on pipeline health without a custom dashboard or a consultant. The four metrics balance speed and stability and pull directly from the tooling a team already uses for builds, deploys, and incidents.
The goal isn’t elite-tier benchmarks in week one. The point is to have a baseline the team can track and an early signal when something starts to slip. Most of the value comes from spotting changes early, like a refactor that quietly slows lead time or a skipped review that spikes change failure rate.
Signs you’re doing this well →
- The team pulls all four DORA metrics from their CI/CD and incident tools, with no manual spreadsheets
- Engineering leadership reviews the metrics on a regular cadence, usually weekly or biweekly
- A drop in any metric kicks off a conversation about what changed
- Metrics break down by team, service, or product area, so leaders know where to focus
- Refactors, tooling changes, and new frameworks get measured against the baseline they replace
Example → A 50-engineer SaaS company tracks the four DORA metrics on a dashboard fed by GitHub, Jenkins, and PagerDuty. The team reviews them every two weeks. Three months in, the change failure rate on one team jumps from 8% to 22%. They trace it to a flaky test suite engineers had been bypassing, fix the tests, and the metric drops back to 9%.
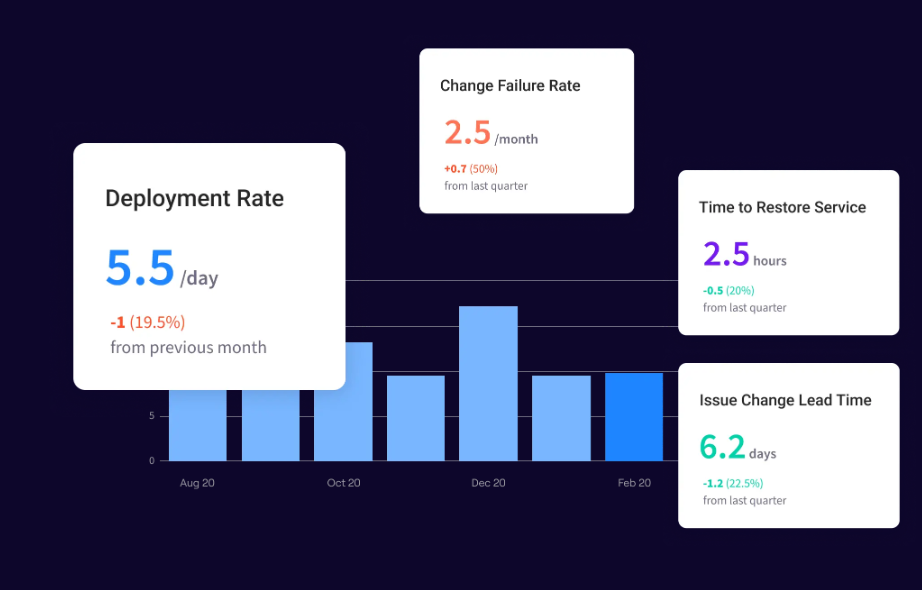
PRO TIP 💡: The fastest way to kill a DORA tracking effort is to do it by hand. Software development teams that try to pull metrics from CI/CD logs into spreadsheets usually abandon the exercise within two quarters, since the manual collection eats most of the value. Jellyfish reads DORA metrics straight from the tools your team already uses (GitHub, Jenkins, PagerDuty, and so on), with team and service breakdowns from day one.
Optimizing Your Pipeline Throughput with Jellyfish
Optimizing Your Pipeline Throughput with Jellyfish
Engineering leaders running a modern DevOps pipeline usually have access to the data they need. Lead time, deployment frequency, change failure rate, and team-level allocations all flow through the tools the pipeline already uses.
But bringing that data together into a clear, consistent view across teams and services takes either a custom internal dashboard or a platform built for the job.
Jellyfish is a software engineering intelligence platform that handles the second option. It connects directly to your source code repositories, issue trackers, and CI/CD pipelines, and gives engineering leaders one place to see how delivery is performing across teams and services.
Here are just some of the things you’ll be able to do:
- Track DORA metrics across teams: Jellyfish connects build, deploy, pull request, and incident data from GitHub, GitLab, Jenkins, PagerDuty, and similar tools, then calculates the four DORA metrics in real-time. Engineering leaders can drill down from org-wide trends to a single service, compare quarters, and segment by team, repo, or business unit without writing custom queries.
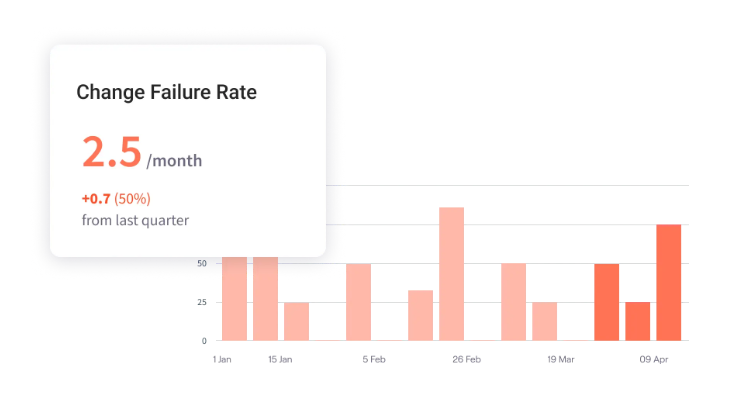
- Spot pipeline bottlenecks: The platform tracks the path every change takes from ticket to production and measures how long each stage takes. Combined with developer survey input from the DevEx module, it shows whether the slowdown comes from PR review queues, flaky CI stages, environment provisioning, or deploy approvals, with named owners and historical trends so the team knows what to fix first.
- Plan capacity and forecast delivery: Historical pipeline performance, ticket throughput, and team allocations feed capacity models at the team and individual level. The Scenario Planner helps leaders model what happens when scope changes, headcount changes, or priorities reshuffle, and early risk alerts fire when delivery dates start to change.
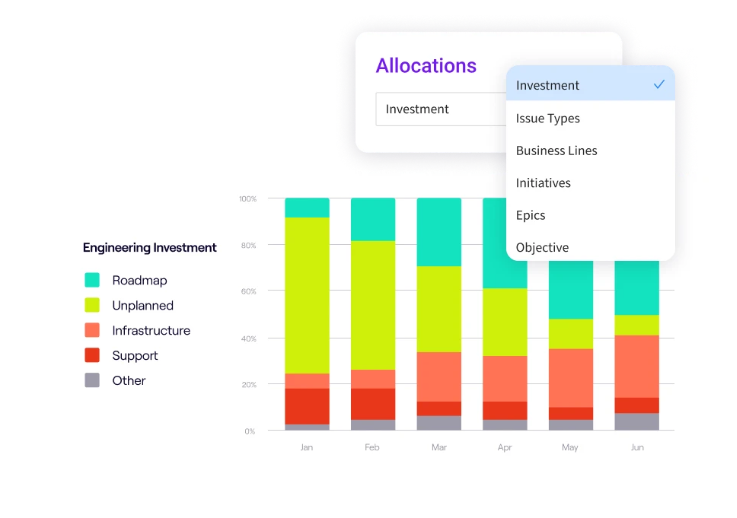
- Map engineering activities to business priorities: A patented allocations model classifies every commit, PR, and ticket against business categories like roadmap initiatives, tech debt, KTLO, customer support, and compliance work. Leaders can see the exact split of engineering investment per quarter, defend it to finance and the board, and rebalance the work when business priorities change mid-cycle.
- Measure AI’s impact on delivery: Adoption, spend, and downstream impact of AI coding tools like GitHub Copilot, Cursor, and Claude Code get tracked at the engineer, team, and codebase level. You can compare delivery metrics before and after rollout, see which teams get the most value, and connect tool spend to lead time, change failure rate, and engineer-reported productivity.
- Benchmark against industry standards: The largest engineering intelligence customer dataset in the industry, drawn from over 20,000 engineering teams, powers every dashboard. DORA metrics, allocation patterns, and AI adoption all get benchmarked against peers by industry, team size, and tech stack, so leaders know which numbers are competitive and which need investment.
Running a DevOps pipeline at scale produces a lot of data and very little time to make sense of it. Jellyfish handles the measurement, comparison, and forecasting, so engineering leaders can focus on decisions and skip the spreadsheets.
Book a demo and see what Jellyfish can do for your team.
DevOps Pipeline FAQs
DevOps Pipeline FAQs
What is the difference between a CI and a CD pipeline?
CI (continuous integration) handles the merge-and-verify side. A commit triggers a build and automated tests, so integration issues show up within minutes of the push.
CD handles the release side. Continuous delivery automates the path to staging with a human approval before production. Continuous deployment automates the path all the way through the production environment.
Most teams run both together as one pipeline.
What are the most popular DevOps pipeline tools?
The tools depend on which stage of the pipeline they handle.
- Plan and code: Jira, Linear, GitHub, GitLab
- Build and test: Jenkins, GitHub Actions, GitLab CI, CircleCI, Snyk, SonarQube
- Release and deploy: Argo CD, Spinnaker, Terraform, Kubernetes, LaunchDarkly
- Operate and monitor: Datadog, New Relic, PagerDuty, Honeycomb
Most modern pipelines combine four to eight tools across these stages.
Can a DevOps pipeline be entirely automated?
Most of it, yes. Builds, tests, security scans, deployments, rollbacks, and continuous monitoring can all run without human intervention, and modern teams routinely push code from commit to production with no manual steps in between.
However, a few stages still benefit from a human in the loop. Production deploys for high-risk services often keep an approval gate, security findings sometimes need a human to triage false positives, and incident response always involves people.
How do Azure DevOps and Azure Pipelines fit into a modern DevOps pipeline?
Azure DevOps is Microsoft’s all-in-one platform for the full DevOps lifecycle, from work tracking to deployment. Azure Pipelines is the CI/CD service inside Azure DevOps that runs builds and deploys for any language, including Node.js, Maven, and npm-based projects.
Teams already in the Microsoft ecosystem often pick Azure DevOps for the integrated experience. Teams on GitHub or GitLab can still use Azure Pipelines as a standalone CI/CD service through its API.
Why is continuous testing important in DevOps?
Continuous testing runs automated checks at every stage of the pipeline. Bugs get caught while the new code is still fresh in the engineer’s head, and the cost of fixing them stays low.
It also gives the team the confidence to deploy often. Without trustworthy tests, every deployment feels like a coin flip, and teams batch changes into bigger, riskier releases.
What does a DevOps engineer do day to day?
A DevOps engineer builds and maintains the pipeline that moves a code change from commit to production. The role spans CI/CD, infrastructure provisioning, security automation, and the dashboards that show how the system behaves.
Most DevOps engineers split their time between pipeline code, support for product teams, and on-call work for production systems. The goal is a setup where every developer can ship safely without a separate handoff.
About the author

Lauren is Senior Product Marketing Director at Jellyfish where she works closely with the product team to bring software engineering intelligence solutions to market. Prior to Jellyfish, Lauren served as Director of Product Marketing at Pluralsight.