In this article
The Gemini Code Assist analytics dashboard gives you active users, code suggestions, accepted suggestions, and lines of code accepted. Read together, they show how much your team leans on the assistant day to day.
Google’s own documentation limits this data to interactions between a developer and the assistant. Review time, merge time, rework, and production behavior all stay outside it, which is where you would look to answer:
- Are teams shipping faster?
- Is quality holding?
- Is the spend returning anything?
This article walks through how Gemini Code Assist analytics works, what it leaves out, and how engineering leaders track AI-assisted code through review, merge, and production.
Overview of Gemini Code Assist Analytics
Overview of Gemini Code Assist Analytics
Gemini Code Assist reports on itself through two Google Cloud services, and what you get from each depends on the setup you may not have done yet.
The sections below cover how the data reaches you and what it contains.
How it Works
Gemini Code Assist records what developers do with the assistant inside the IDE and sends that telemetry to your Google Cloud project. The plugin reports each interaction as an event, and Google Cloud stores those events through two services that behave differently from each other:
- Cloud Monitoring counts the events for you and needs no configuration. The dashboard appears on the Gemini Code Assist Overview page once developers use the assistant. Two IAM roles control what you see. Monitoring Viewer grants access to the dashboard, and Gemini Cloud Assist User determines which developers appear in the data.
- Cloud Logging records each event on its own, and it stays off until an administrator switches it on. Two separate toggles control what Google keeps. The metadata toggle records the facts about each interaction, such as how many lines a developer accepted from a suggestion. The prompts and responses toggle records what developers write to Gemini and what Gemini writes back. Both apply to Standard and Enterprise, and you set them per project on the Admin for Gemini page.
Each metadata log entry names a developer and records one of four events. Gemini showed a code suggestion, the developer accepted one along with its line count, Gemini answered in chat, or the developer kept code from that answer.
A shared request ID connects every exposure to its acceptance, which is how you calculate acceptance rate, since Google doesn’t report it directly.
Google publishes a sample dashboard definition that assembles these events into six charts.
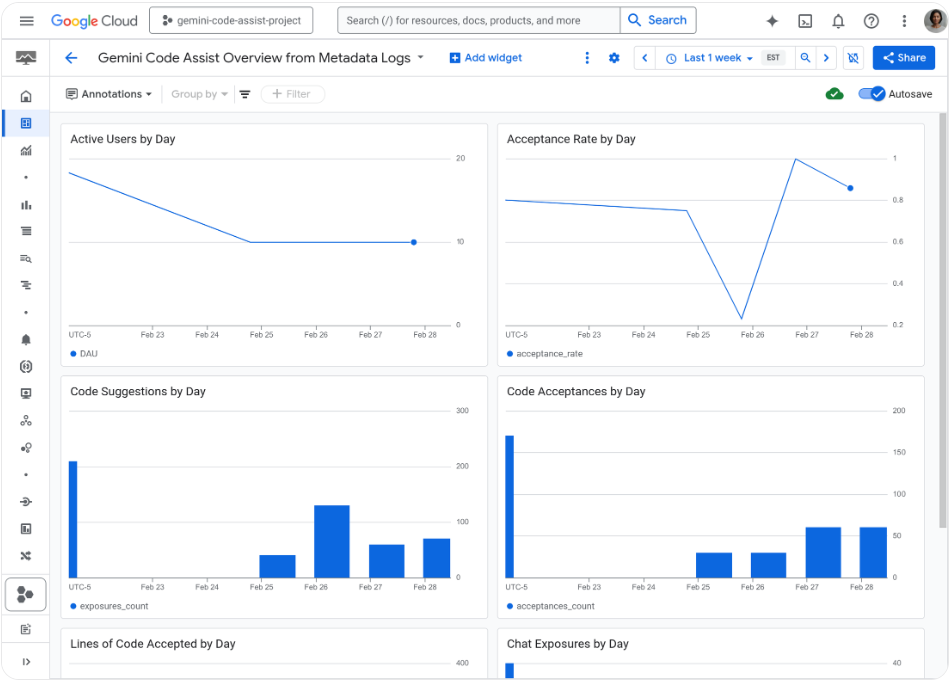
Google’s sample dashboard, built from Code Assist metadata logs. Six charts, all of them measuring activity inside the editor.
Once the events are stored, you have four ways to work with them:
- Logs Explorer works like a search box over your raw log entries. You write a filter, save it as a counter, and chart the result.
- Log Analytics lets you query the same logs with SQL, which suits anyone comfortable writing their own reports.
- BigQuery copies the data into Google’s data warehouse, either through a routing rule called a log sink or through a linked dataset. Teams pick this when they want to combine Code Assist data with information from other tools. The two paths cost different amounts, so it’s worth checking pricing before committing.
- The gcloud command line covers quick one-off checks, like counting how many unique people used the assistant in the past 28 days.
What this setup doesn’t cover → Logs arrive project by project, and an organization-wide view means you create a central logging project and route every other project’s logs into it. Code reviews handled by Gemini Code Assist on GitHub never reach Cloud Logging. Gemini CLI depends on its own OpenTelemetry setup, which puts terminal and agent work in a different place.
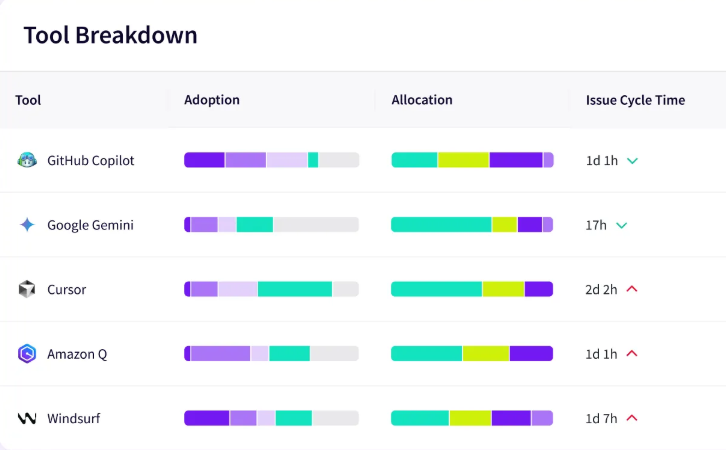
PRO TIP 💡: GitHub code reviews and terminal work stay outside Cloud Logging, so a large part of AI activity never reaches your dataset. Jellyfish AI Impact detects AI signals from Git and planning data instead of from any single vendor’s telemetry, and its multi-tool comparison covers assistants, review agents, and agentic tools on one measurement model.
What Gemini Code Assist Analytics Measures
Everything Google reports falls into three groups, all available in Cloud Monitoring without any setup:
| Group | What you get |
| Adoption | Active users across four windows (hourly, daily, weekly, 28-day) |
| Suggestions and chat | Suggestions shown and accepted, lines accepted, chat conversations, chat responses, chat acceptances |
| Consumption | API calls, plus input, output, and cached tokens |
The adoption windows are worth reading side by side:
- A rising daily count against a flat 28-day count means your existing users have gotten busier without anyone new joining them.
- A rising 28-day count against a flat daily count means more people have touched the assistant at least once, though it doesn’t say whether they came back.
Neither reading is available from one window alone.
Consumption is the usage group. Google reports API calls and token consumption, including input, output, and cached tokens, so these counts show how heavily your organization is using the underlying models.
Metadata logging adds detail the dashboard leaves out, provided the Code Assist telemetry setting is enabled in the VS Code and IntelliJ extensions, since code exposure and acceptance events come from those two editors alone:
- Acceptance rates, three of them, for inline code, for chat, and for both combined. You can break any of them down by developer or by programming language to see whether Python suggestions hold up better than Go ones.
- An Agent Mode marker on chat events, which lets you measure agentic work separately from ordinary chat.
- The editor name and version, which separates VS Code activity from IntelliJ.
- The comment line count inside each acceptance, so you know how much of a large line total was comments.
Quick note on acceptance → The word covers more than it sounds like it does. Google records typeover, tab, and full acceptance as the same event, so a developer who takes fifteen lines and rewrites twelve of them still registers one acceptance worth fifteen lines.
5 Ways to Measure Gemini Code Assist Analytics Usage and Impact
5 Ways to Measure Gemini Code Assist Analytics Usage and Impact
Five approaches cover the ground native telemetry leaves open. They vary widely in cost and in what they prove, and many organizations end up combining two or three.
1. Leverage Native Google Cloud Telemetry
How it works: Google collects the data for you. Cloud Monitoring keeps the totals without any setup, and metadata logging fills in the individual events once an administrator turns it on. You read it in the built-in dashboard, query it in Log Analytics or BigQuery, or pull quick numbers from the command line.
Where it’s enough on its own: License decisions. You can see who uses their seat, who doesn’t, which teams took to the tool, and how consumption moves month to month. In the first few months after purchase, that covers what you need, and none of it costs anything past the setup you already did.
Trade-off: The data ends where the editor ends. It covers the exchange between developer and assistant, and it goes quiet on review, merge, and everything after. Acceptance is a rough measure too, given that a tab press counts the same as a block someone kept in full.
Best fit: Use native Google Cloud telemetry when you want the lowest-friction way to understand adoption and interaction patterns before investing in a broader measurement setup. It works especially well as a baseline for teams that primarily need to know who is using Gemini, how often, and which outputs developers accept.
2. Conduct Controlled A/B Cohort Testing
How it works: Two matched groups of developers work through the same period, one with Gemini Code Assist and one without. At the end, you compare their delivery data, cycle time, PR throughput, review time, and change failure rate, all of which comes from your version control and CI systems.
What it shows that native analytics can’t: Whether Gemini likely contributed to the change. Usage data and delivery data can both improve in the same quarter without either one explaining the other, and native telemetry gives you no way to separate them. A holdout group does, because both cohorts sat through the same incidents, the same hiring, and the same seasonal noise. That makes it the strongest evidence available to you.
Trade-off: The result only holds if the cohorts genuinely match. Google’s own guidance warns that comparing an experienced team using the assistant against a less experienced team without it produces an evaluation you can’t rely on. You also need enough developers in each group for the numbers to mean anything, a window long enough to cover normal variation, and a team willing to keep the tool away from engineers who want it.
Best fit: Use this for a major purchase or a renewal where the number has to survive scrutiny. It works best while some teams still lack licenses, since the comparison group already exists.
3. Implement Qualitative DevEx Pulse Surveys
How it works: You ask your developers. A short survey every month or quarter, four or five questions, about how much time the assistant saves them, whether they trust what it writes, and which parts of the job it helps with.
What it shows that native analytics can’t: Telemetry records that a developer accepted a suggestion, and it has nothing to say about whether that suggestion saved time, needed heavy cleanup, or made the task harder. DORA’s 2025 research found more than 80% of technology professionals believe AI improved their productivity, while 30% place little or no trust in the code it writes. The same developer can feel faster and still not trust the code they merged. Acceptance rate looks the same either way.
Trade-off: Survey data is self-reported, so it’s vulnerable to perception bias and should not be treated as a substitute for delivery or quality metrics. Response fatigue can also become a problem if surveys are too long or too frequent.
Best fit: Use surveys when you want to understand the human side of adoption and explain the patterns you see in telemetry. They work as a companion to your usage numbers, and they won’t carry an ROI case on their own.
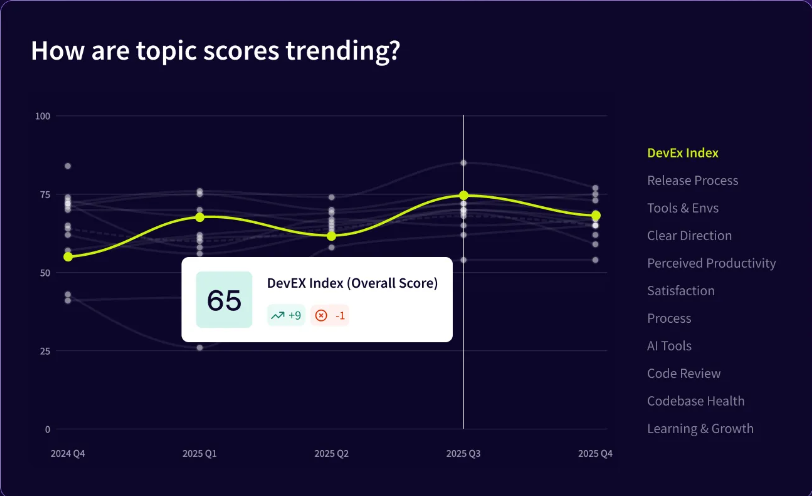
PRO TIP 💡: Survey data works hardest next to delivery data. Jellyfish DevEx keeps developer surveys in the same platform as your Git and CI signals, which means you can compare what your teams report against what they shipped.
4. Build Custom DevOps Intelligence Pipelines
How it works: You export Code Assist logs to BigQuery and join them with data from the rest of your delivery stack, mainly Git, your CI system, your ticket tracker, and your incident tooling. The user ID in each log entry becomes the key that connects a developer’s Gemini activity to the pull requests they opened, the reviews they waited on, and the incidents that followed. From there, the dashboards are yours to build.
What it shows that native analytics can’t: What happened to the code. Once Gemini events share a table with your Git history, you can compare review time on PRs with heavy AI involvement against the rest, look at whether AI-assisted changes get reverted more often, and analyze what happens downstream on work associated with heavier Gemini usage. Native telemetry ends at the editor, and this approach is what carries the data across that boundary.
Trade-off: The flexibility costs you engineering time. You need reliable identity mapping, consistent metric definitions, and someone to maintain all of it as log formats change. And even a well-built pipeline gives you correlation, since AI usage moving alongside delivery outcomes doesn’t prove one caused the other.
Best fit: Use a custom DevOps intelligence pipeline when you already have a mature data platform and want full control over how AI impact is measured. It makes the most sense for larger engineering organizations with the resources to maintain the integrations and analysis themselves.
5. Deploy a Software Engineering Intelligence (SEI) Platform
How it works: An SEI platform connects to your Git provider, CI system, ticket tracker, and AI coding tools, then models the relationships between them. You get the same joins a custom pipeline would produce, without writing or maintaining them. AI measurement is built into most of these platforms, so Gemini activity is already mapped against cycle time, review load, and throughput.
What it shows that native analytics can’t: The whole path from suggestion to production. Gemini’s dashboard stops at the editor, and an SEI platform picks the code up from there, following it through review, merge, and release. That lets you compare delivery speed on AI-assisted work against the rest, and it lets you see how much of the time saved in writing comes back as review load. It also solves the multi-tool problem, since each vendor’s dashboard covers only that vendor.
Trade-off: An SEI platform brings another tool and cost to the stack, and the quality of the analysis still depends on having clean integrations and well-defined engineering metrics. It also works best when AI usage can be reliably connected to the developers and workflows represented in the rest of your engineering data.
Best fit: Invest in an SEI platform when you want AI impact measured alongside the rest of engineering performance, and you’d prefer not to build the data infrastructure yourself. It suits larger organizations that already track engineering efficiency and want AI adoption to become one more dimension of that analysis.
Limitations of Gemini Code Assist Analytics
Limitations of Gemini Code Assist Analytics
Google is upfront about most of these. The limits appear in the documentation itself, and each one narrows what you can say about the assistant’s effect on delivery.
- Native analytics cover two of Google’s own four steps: Daily active use, code suggestions, acceptance rates, and lines accepted cover the first two steps, and all four come from Gemini. Acceleration and impact are built from DORA measures, story points, ticket closures, revenue, and time to market, which come from systems Google never sees.
- It only covers activity inside the IDE: Google repeats this across its documentation for both Cloud Monitoring and Cloud Logging. What happens to accepted code afterward, through review, merge, deploy, and production, never enters the dataset.
- Acceptance covers three different behaviors: A typeover, a tab press, and a fully kept block all produce the same event with the same line count. The record also closes at the moment of acceptance, so code a reviewer removed and code that shipped look identical.
- Not every part of Code Assist reports back: Gemini Code Assist on GitHub sends nothing to Cloud Logging, which leaves AI-assisted code review outside your data. Gemini CLI logging uses a separate OpenTelemetry pipeline. And the code exposure and acceptance events come from VS Code and IntelliJ alone.
- The logs leave out what developers say about the suggestions: Google documents that Code Assist sends no other interaction data to Cloud Logging, and it names written feedback specifically. That means you can see a suggestion was rejected and never see why.
- No history exists before somebody enables logging: Metadata logging is off until an administrator switches it on, and Google fills in nothing retroactively. Logs also arrive project by project, so an organization-wide view needs a central logging project, sinks from every source project, and access set up around all of it.
- Google reports on its own product only: Most engineering organizations now run more than one assistant, and each vendor built its own definitions of acceptance and active use. Comparing them means doing the reconciliation yourself, and adding them together isn’t possible.
Gemini Code Assist Analytics and Reporting Alternatives
Gemini Code Assist Analytics and Reporting Alternatives
Several engineering intelligence platforms cover the ground Gemini’s native reporting doesn’t. They vary in emphasis, and the five below are the ones that come up most often when teams need AI activity measured against delivery outcomes.
| Platform | Best for | What it adds to Gemini’s data |
| Jellyfish | Leaders who need AI impact reported next to delivery outcomes and engineering investment | An AI Impact module that covers assistants, agents, and AI code review tools, with spend tracking alongside delivery data |
| Faros AI | Organizations with complex toolchains that want deep custom analysis | Data connected across the software development lifecycle, with industry benchmarks and AI-specific analysis |
| LinearB | Teams who want to act on the data inside their existing workflow | Workflow analytics with automation built into the PR process, plus AI attribution through labeling |
| Swarmia | Teams tracking adoption and cost across several AI tools at once | Licenses, active users, and idle seats per tool, with developer surveys and AI spend in the same view |
| DX | Organizations measuring developer experience alongside delivery | Survey data paired with metrics pulled from repos and CI systems |
Whichever you choose, the value depends on the connections underneath it. Each of these platforms needs access to your Git provider, CI system, and ticket tracker, and the analysis only holds if developer identities match across all three. That mapping is the same work a custom pipeline would need, with the difference that the platform handles it.
Prove the True ROI of Gemini Code Assist with Jellyfish
Prove the True ROI of Gemini Code Assist with Jellyfish
Native telemetry stops the moment a developer accepts a suggestion. What happens next, through review, merge, release, and any incidents that follow, exists in your delivery systems and nowhere in Gemini’s data. Connecting the two yourself means identity mapping, joins, metric definitions, and permanent maintenance.
Jellyfish is a software engineering intelligence platform that does that work for you. It reads AI signals directly from Git and your planning systems, connects them to throughput, cycle time, and quality, and covers every assistant your teams use on one measurement model.
The AI Impact module breaks down into six areas:
- Impact Insights connects AI activity to what your teams delivered, using signals from across the software development lifecycle. Accepted code is tracked through review, merge, and release, so you learn whether faster writing produced faster shipping. That’s the measurement Google’s framework calls acceleration.
- Multi-Tool Comparison applies one measurement model to every AI tool your organization manages. Gemini, Copilot, Cursor, and Claude Code each define acceptance differently, and this normalizes them so the numbers compare. That is especially important when you’re deciding which tools to keep funding.
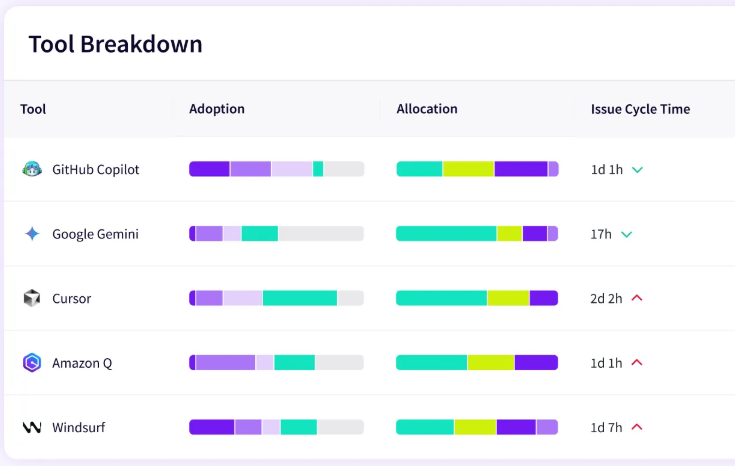
- Adoption Insights detects who uses AI, on what work, and through which tool, without any setup inside the IDE. Because Jellyfish can derive AI signals from Git and workflow data as well as tool integrations, it does not depend exclusively on Gemini’s native telemetry for impact analysis.
- AI Token Spend Dashboard attributes AI spend to specific tools, teams, and initiatives. As pricing moves toward usage-based models, that attribution decides whether you can explain a bill or only report it.
- AI Workflow Insights combines system signals, agent performance, and developer feedback in one view. That last part covers ground Google closes off entirely, since the ratings developers give inside the IDE never reach Cloud Logging.
- Auto Report Builder produces AI reports formatted for an executive audience, covering what’s working, what isn’t, and where the next investment should go. The work of assembling that from raw data is what most teams underestimate.
Request a demo to see how Jellyfish measures your Gemini Code Assist investment against delivery outcomes, or tour the product to explore the AI Impact dashboards yourself.
FAQs
FAQs
Which IDEs and environments does Gemini Code Assist analytics cover?
The assistant supports Visual Studio Code, JetBrains IDEs including PyCharm, GoLand, and WebStorm, Android Studio, Cloud Shell, and Cloud Workstations.
Google’s code exposure and acceptance events, which power acceptance rate and lines accepted, come from Visual Studio Code and the IntelliJ family alone.
Code completion and smart actions used in other environments produce activity your developers see, and your reporting doesn’t, so check which editors your teams use before you read too much into the numbers.
Does Gemini Code Assist analytics measure code quality or software delivery performance?
No. The data covers what developers did with the assistant and stops there.
Code quality and software delivery performance are measured downstream, in review time, change failure rate, rework, and incidents, none of which Gemini records. A developer who accepts a large refactoring suggestion and reworks half of it produces the same acceptance event as one whose code shipped untouched.
For questions about developer productivity or delivery outcomes, you need observability across your Git, CI, and ticket data alongside the assistant’s telemetry.
How does Gemini Code Assist analytics compare to other AI code assistants?
The reporting looks broadly similar across vendors. Many AI code assistants publish adoption counts and acceptance rates from inside the editor, and many stop at the same boundary.
Where they differ is in the definitions behind the numbers, so an acceptance in Gemini Code Assist Standard and an acceptance in Copilot are not the same measurement.
Language-level breakdowns differ too, which matters if you want to know whether TypeScript suggestions hold up better than JavaScript ones. The underlying large language models change often enough that year-over-year comparisons need care, since a change in LLMs moves acceptance rate independently of anything your teams did.
About the author

Lauren is Senior Product Marketing Director at Jellyfish where she works closely with the product team to bring software engineering intelligence solutions to market. Prior to Jellyfish, Lauren served as Director of Product Marketing at Pluralsight.