In this article
As an engineering leader, one of your most important responsibilities isn’t just building great systems, it’s clearly communicating the value of those systems to executive leadership and the board.
With the rapid rise of AI, that responsibility has only intensified. Leaders and board members are asking fundamental, high‑stakes questions like:
- How is our AI adoption progressing?
- What tangible impact is AI having on engineering performance?
How well you answer these questions is more than a status update. It signals to leadership how effectively your organization is navigating the broader AI‑driven transformation reshaping engineering.
The good news? With the right approach and the right tooling you can move from fragmented metrics to a clear, compelling narrative. Jellyfish AI Impact helps engineering leaders do exactly that by turning complex data into highly consumable, executive‑ready insights.
The Executive Reporting Problem
The Executive Reporting Problem
Every quarter, the board deck deadline arrives and with it, the same frustration. Proving AI usage and ROI often means:
- Manually pulling data from multiple dashboards
- Reconciling inconsistent metrics
- Translating engineering terms like PR Cycle Time into business outcomes executives actually care about
The result is a chaotic, time‑consuming process that can eat up time that should instead be spent on strategy. In other words, how can you prove AI ROI without spending two days in a spreadsheet? This is the gap executive reporting on AI needs to close.
Jellyfish’s AI Executive Reporting Workflow
Jellyfish’s AI Executive Reporting Workflow
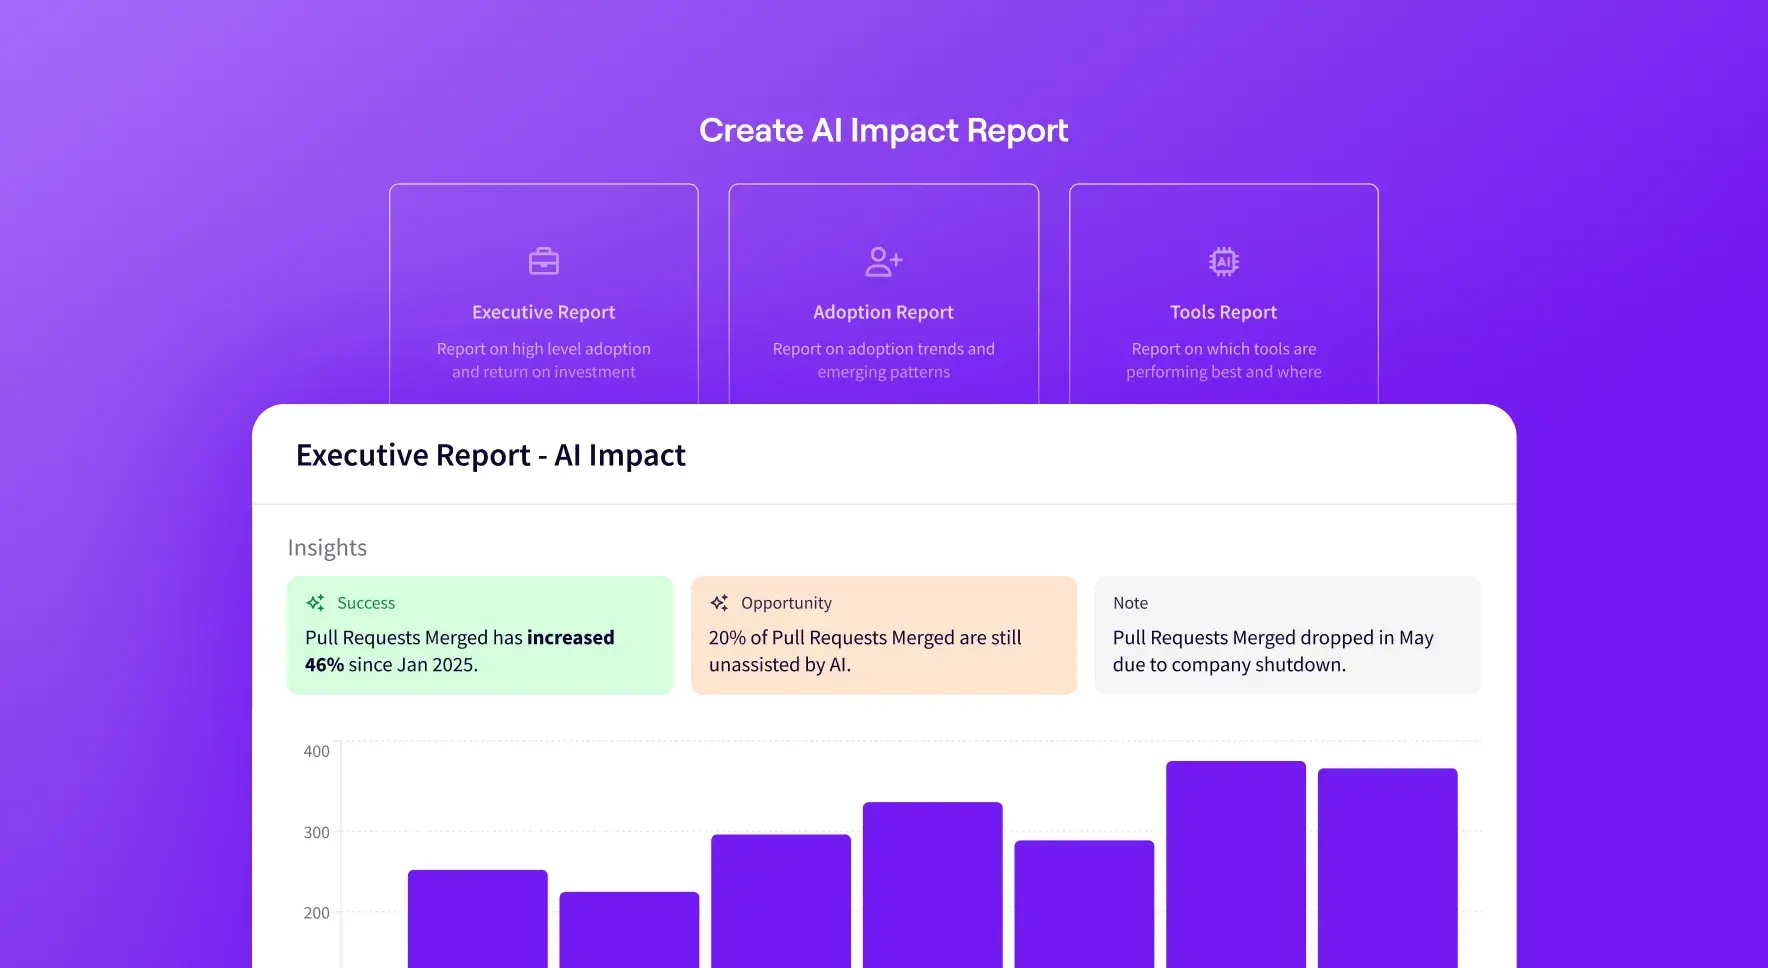
Jellyfish’s AI Executive Report is built using a workflow methodology. It’s not a passive dashboard, but an intentional, outcome‑driven process designed to produce one thing: a ready‑to‑present executive report.
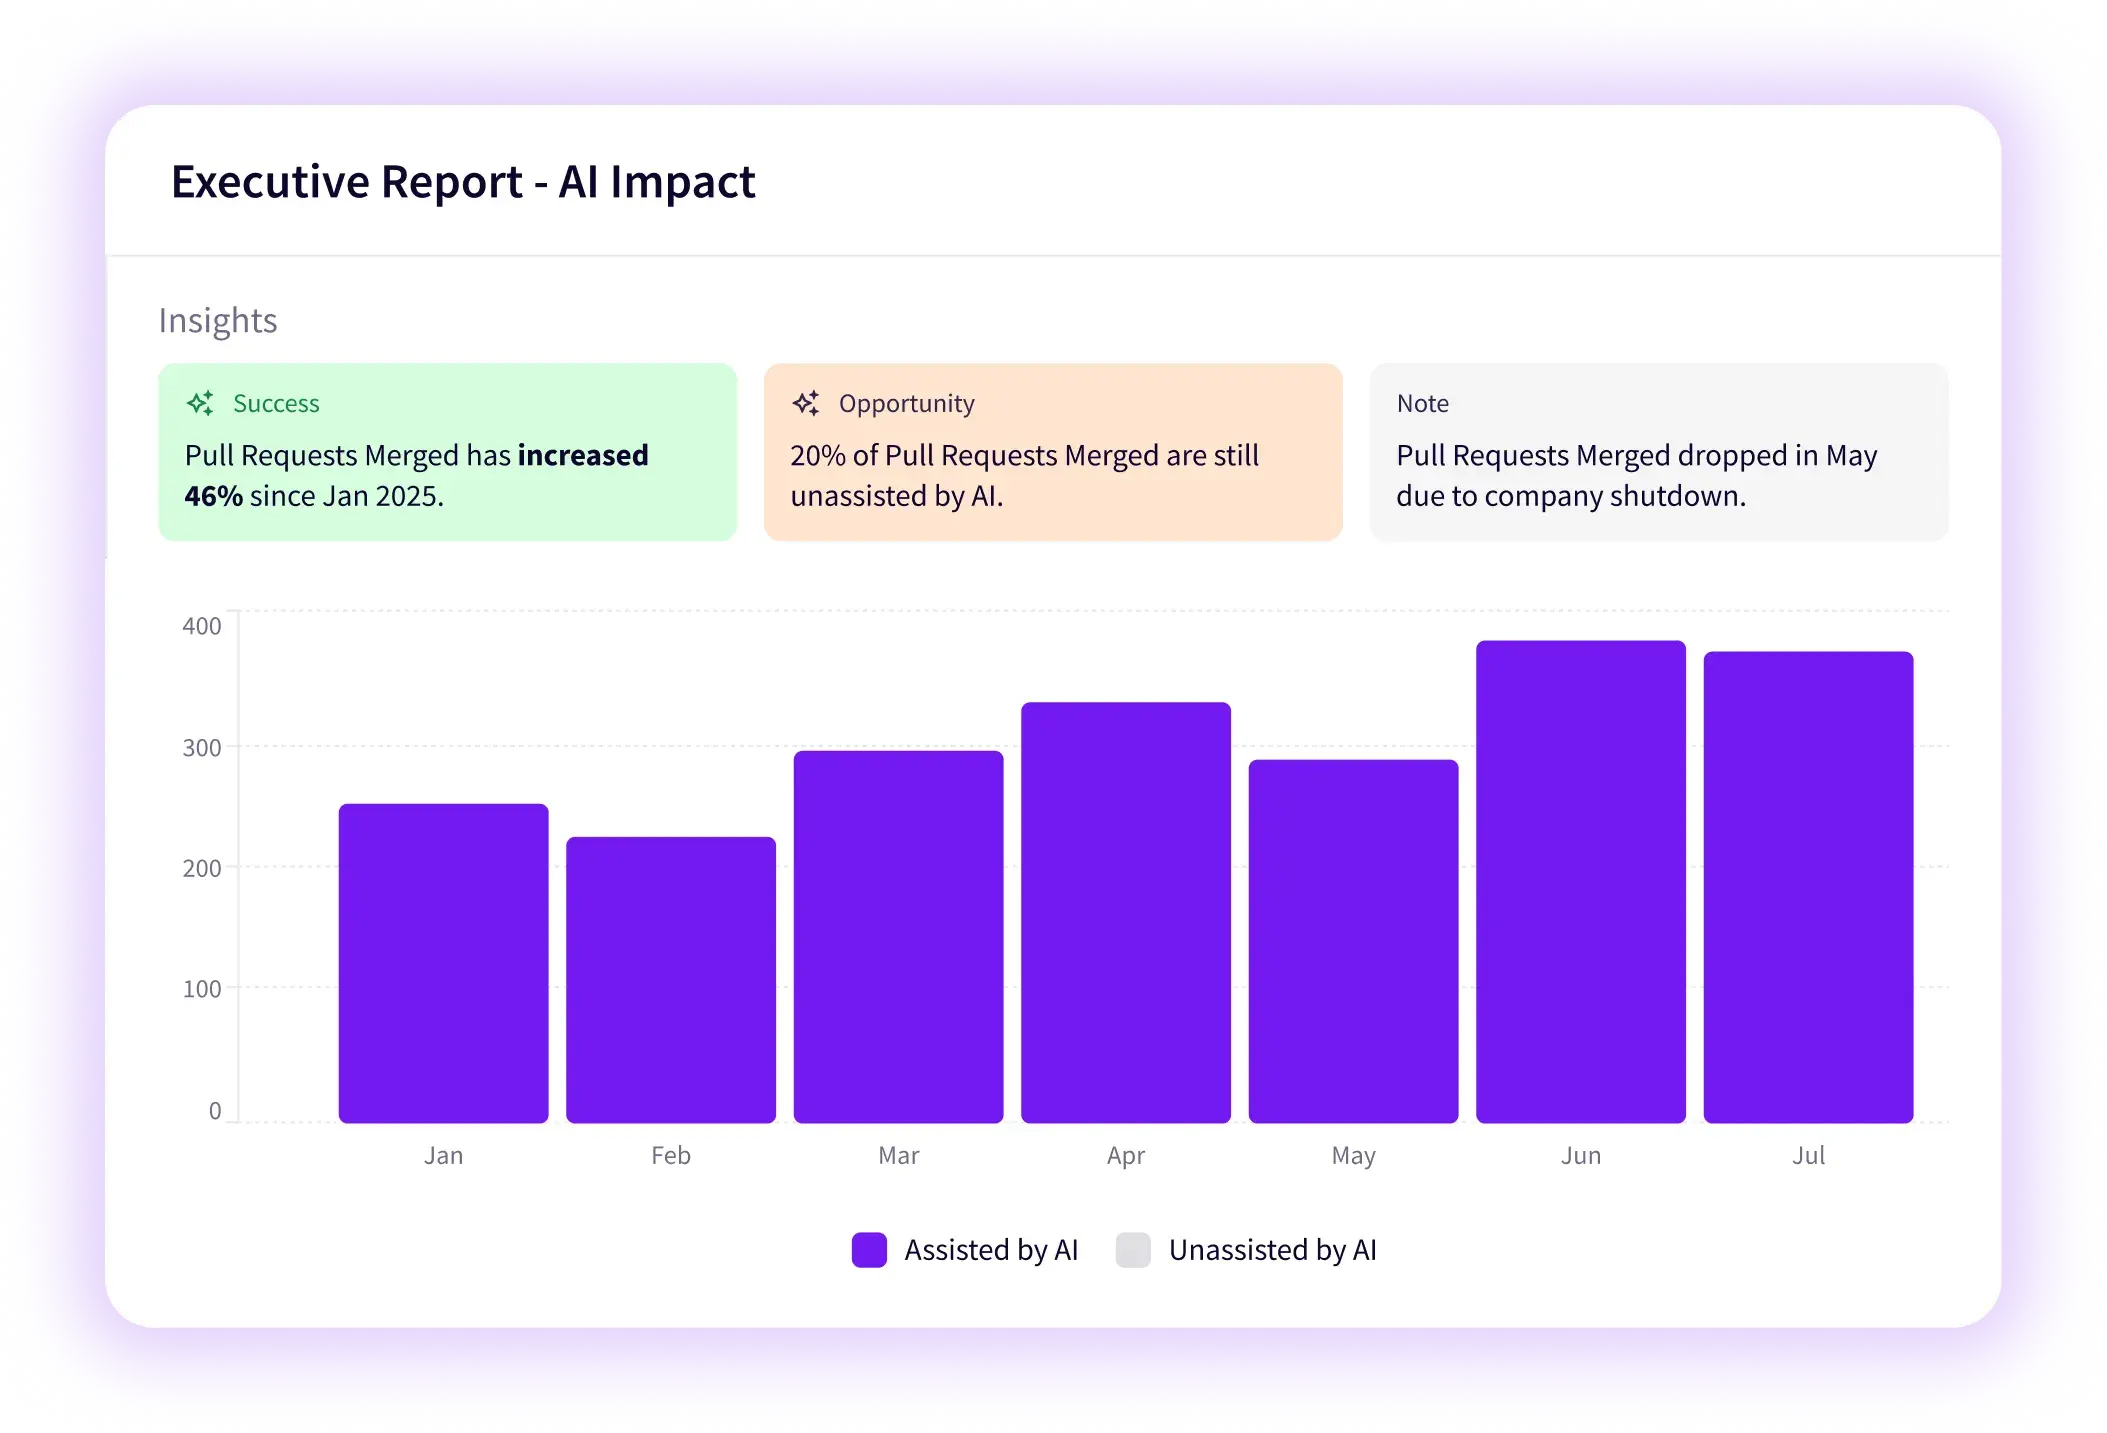
The report tells a clear story about how AI is being adopted, how it’s changing engineering output, and what that means for the business. Jellyfish brings the right data together so you can focus on shaping the narrative you need without manual effort or guesswork.
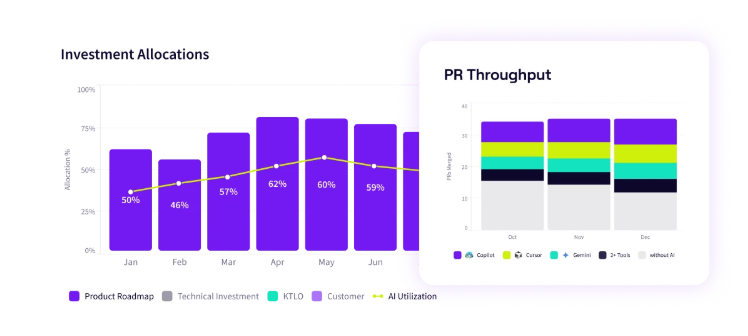
A default executive report on AI in Jellyfish is built around three core areas that matter most to leadership:
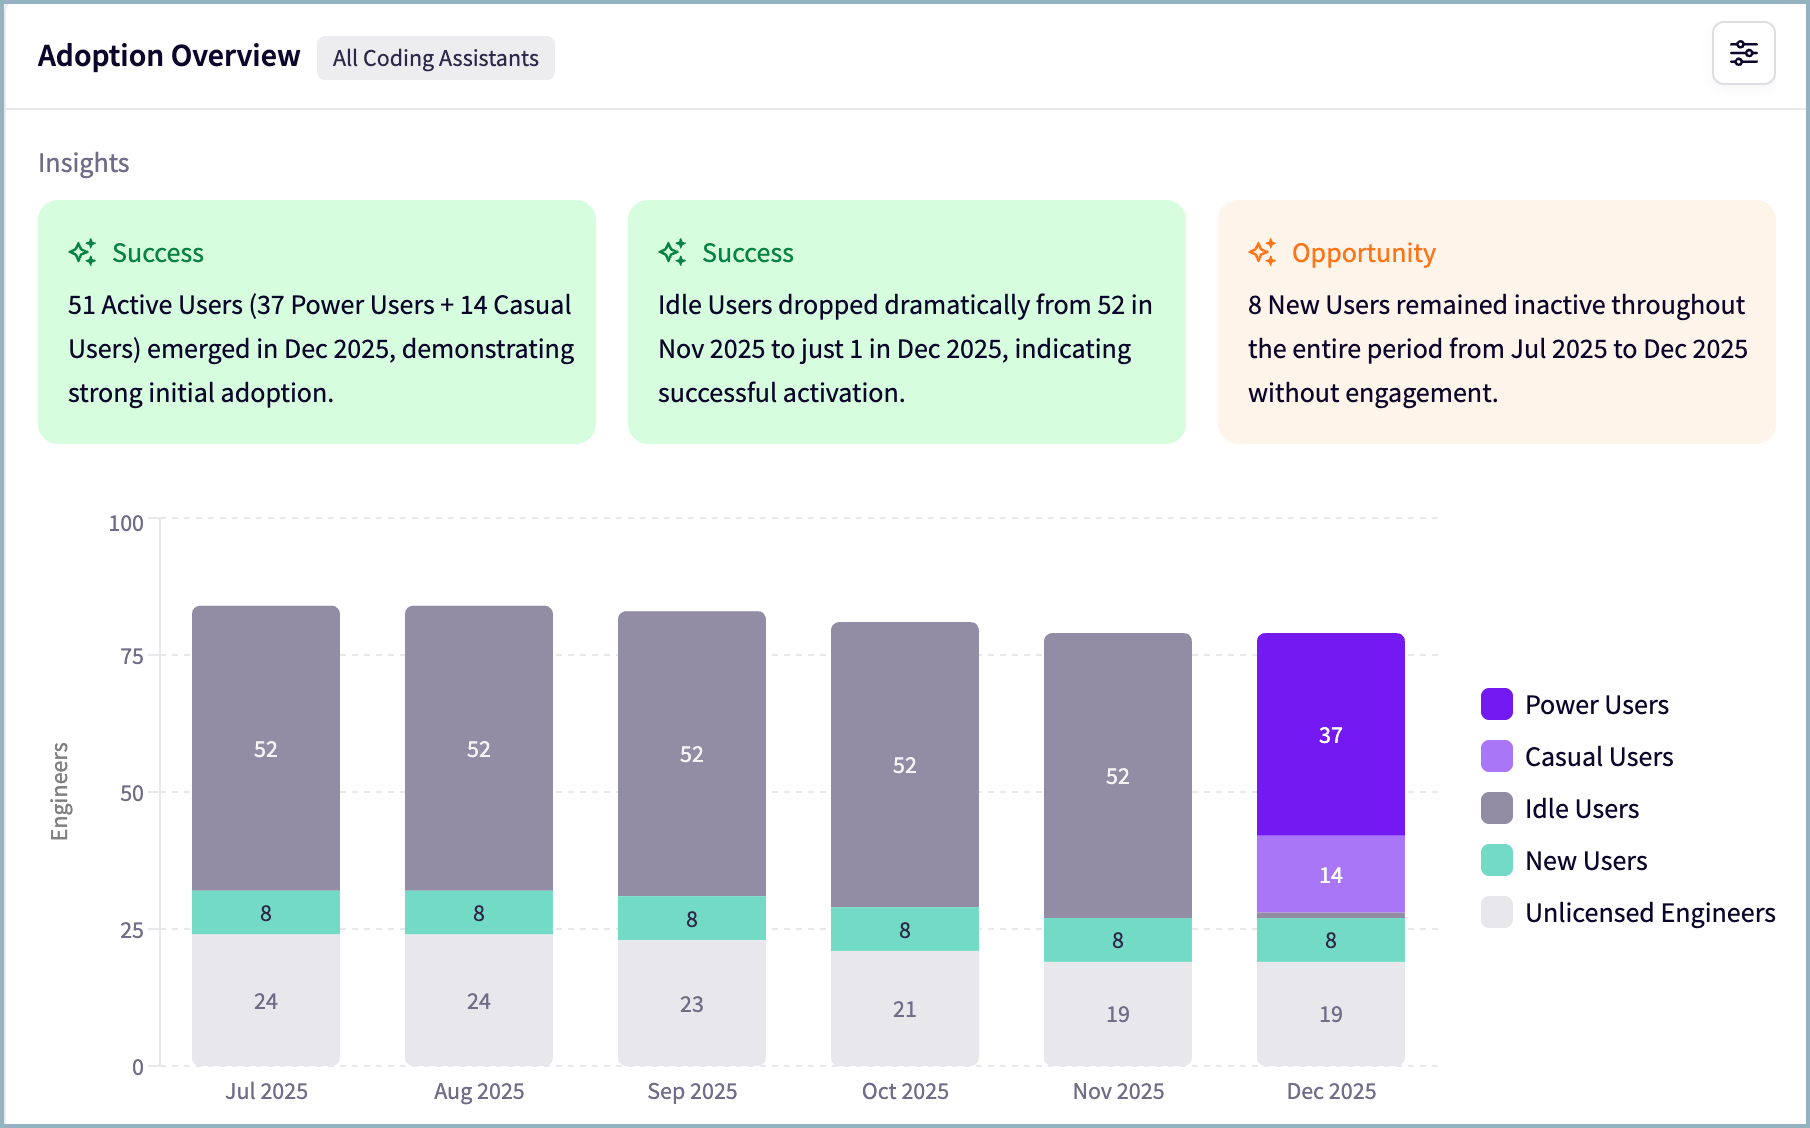
- Adoption: Visualizing tool usage (e.g., Copilot, Windsurf) over time.
- Output (PR Throughput): Showing the trend of engineering output.
- Impact (Issue Cycle Time & PR Cycle Time): A visual comparison of AI-assisted PRs vs. Unassisted PRs.
Communicating AI’s impact is perhaps the most critical skill when reporting to your board and exec team. Boards don’t speak PR Cycle Time. They speak ROI, risk, and operational efficiency. Executives make decisions about outcomes and capital allocation, not tooling. Your job is to translate engineering success into business terms they can act on.
By using Jellyfish’s AI Executive Reporting Workflow to frame Adoption, Throughput, and Cycle Time in terms of time saved, money saved, and risk reduced, you make AI’s ROI easy to understand.
Best Practices for Executive Metrics
Best Practices for Executive Metrics
Below are practical ways to communicate each metric effectively.
Adoption
Executive translation: Change‑management success and value realization
- How to say it:
- “X% of target developers have licenses; Y% are weekly active, indicating sustained behavior change.”
- “Idle or casual cohorts represent unlocked return – we’re converting them through targeted enablement.”
- Ineffective vs. effective:
- Ineffective: “Adoption is at 62%.”
- Effective: “62% coverage with 48% weekly active use creates sufficient critical mass for ROI; enablement is scheduled to convert the remaining users next sprint.”
- Possible decision call: “Approve training or licensing expansion where weekly active use is below the ROI threshold.”
- Pitfall to avoid: Don’t focus on tool trivia – keep the story on rollout maturity and business readiness.
PR Throughput
Executive translation: Increased output and capacity (direct ROI)
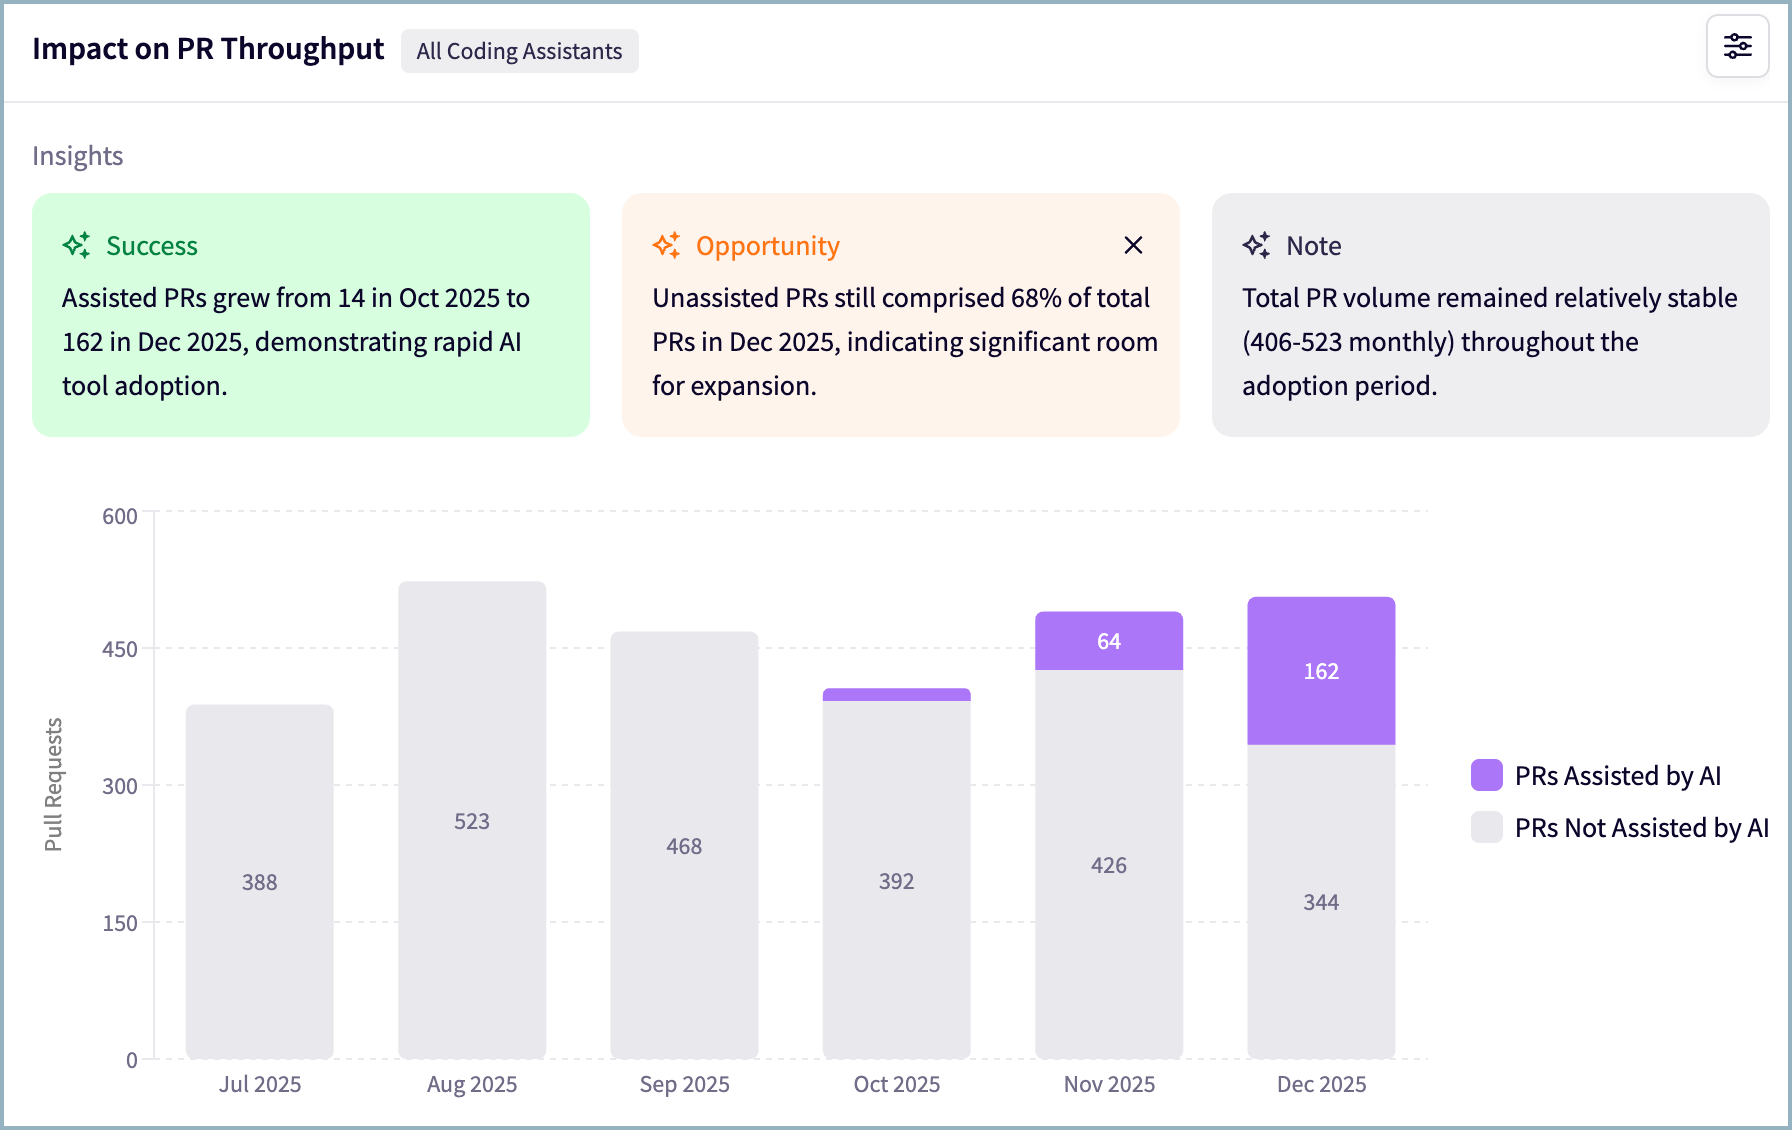
- How to say it:
- “Delivery rate increased X% – approximately +N PRs per month – without adding headcount.”
- “Throughput gains accelerate roadmap completion within the same budget.”
- Ineffective vs. effective:
- Ineffective: “PR throughput rose 12%.”
- Effective: “A 12% increase (~40 additional PRs per quarter) accelerates two roadmap initiatives without additional hires.”
- Possible decision call: “Replicate high‑gain practices and tools across priority teams.”
- Pitfall to avoid: Don’t bury throughput under efficiency charts – lead with output.
Issue Cycle Time
Executive translation: Time saved and faster time‑to‑value
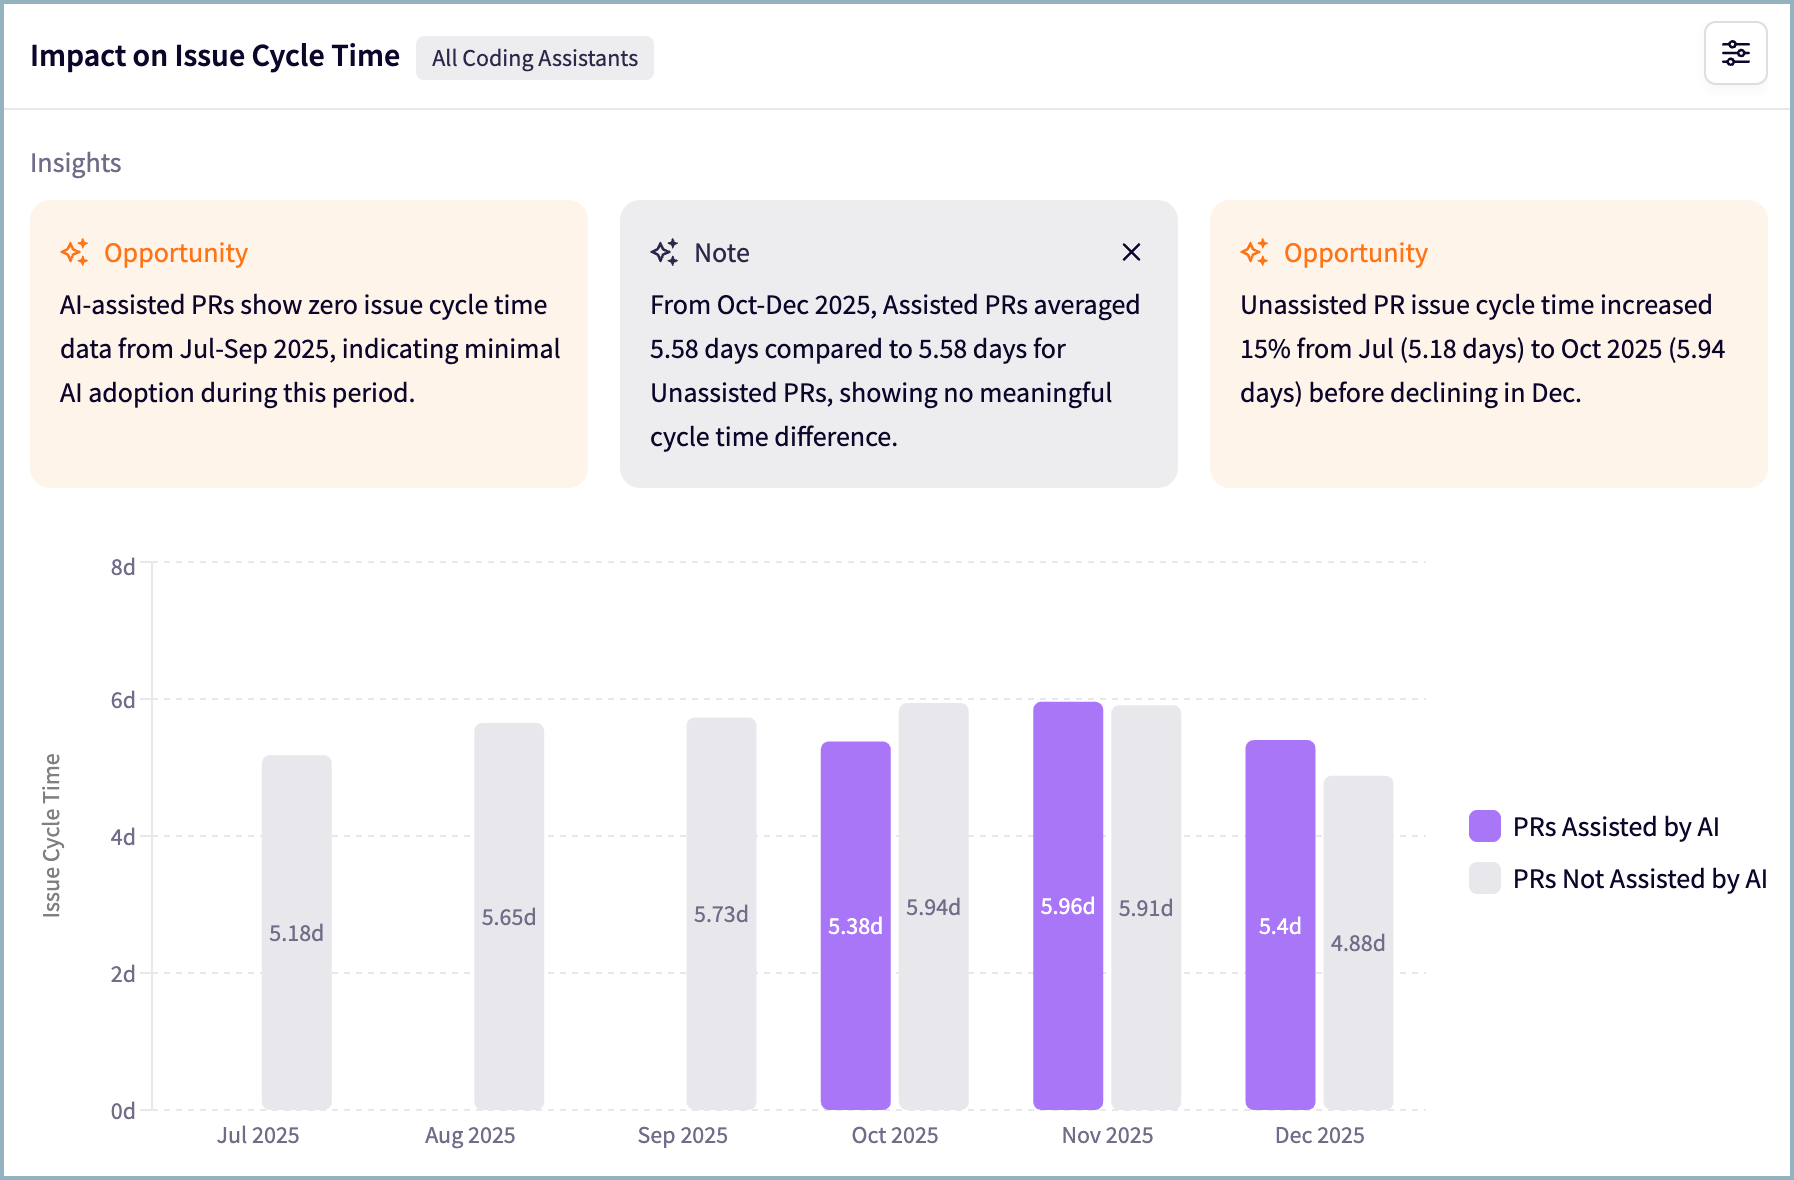
- How to say it:
- “End‑to‑end cycle time dropped X%, moving work through the system faster.”
- “Earlier delivery reduces waiting costs and pulls value recognition forward.”
- Ineffective vs. effective:
- Ineffective: “Issue cycle time decreased by 18%.”
- Effective: “An 18% end‑to‑end reduction pulls value into this quarter; combined with higher throughput, it compounds roadmap velocity.”
- Pitfall to avoid: Don’t present cycle time as the outcome – frame it as the leading indicator that fuels output.
PR Cycle Time
Executive translation: Time saved per unit with quality as a guardrail
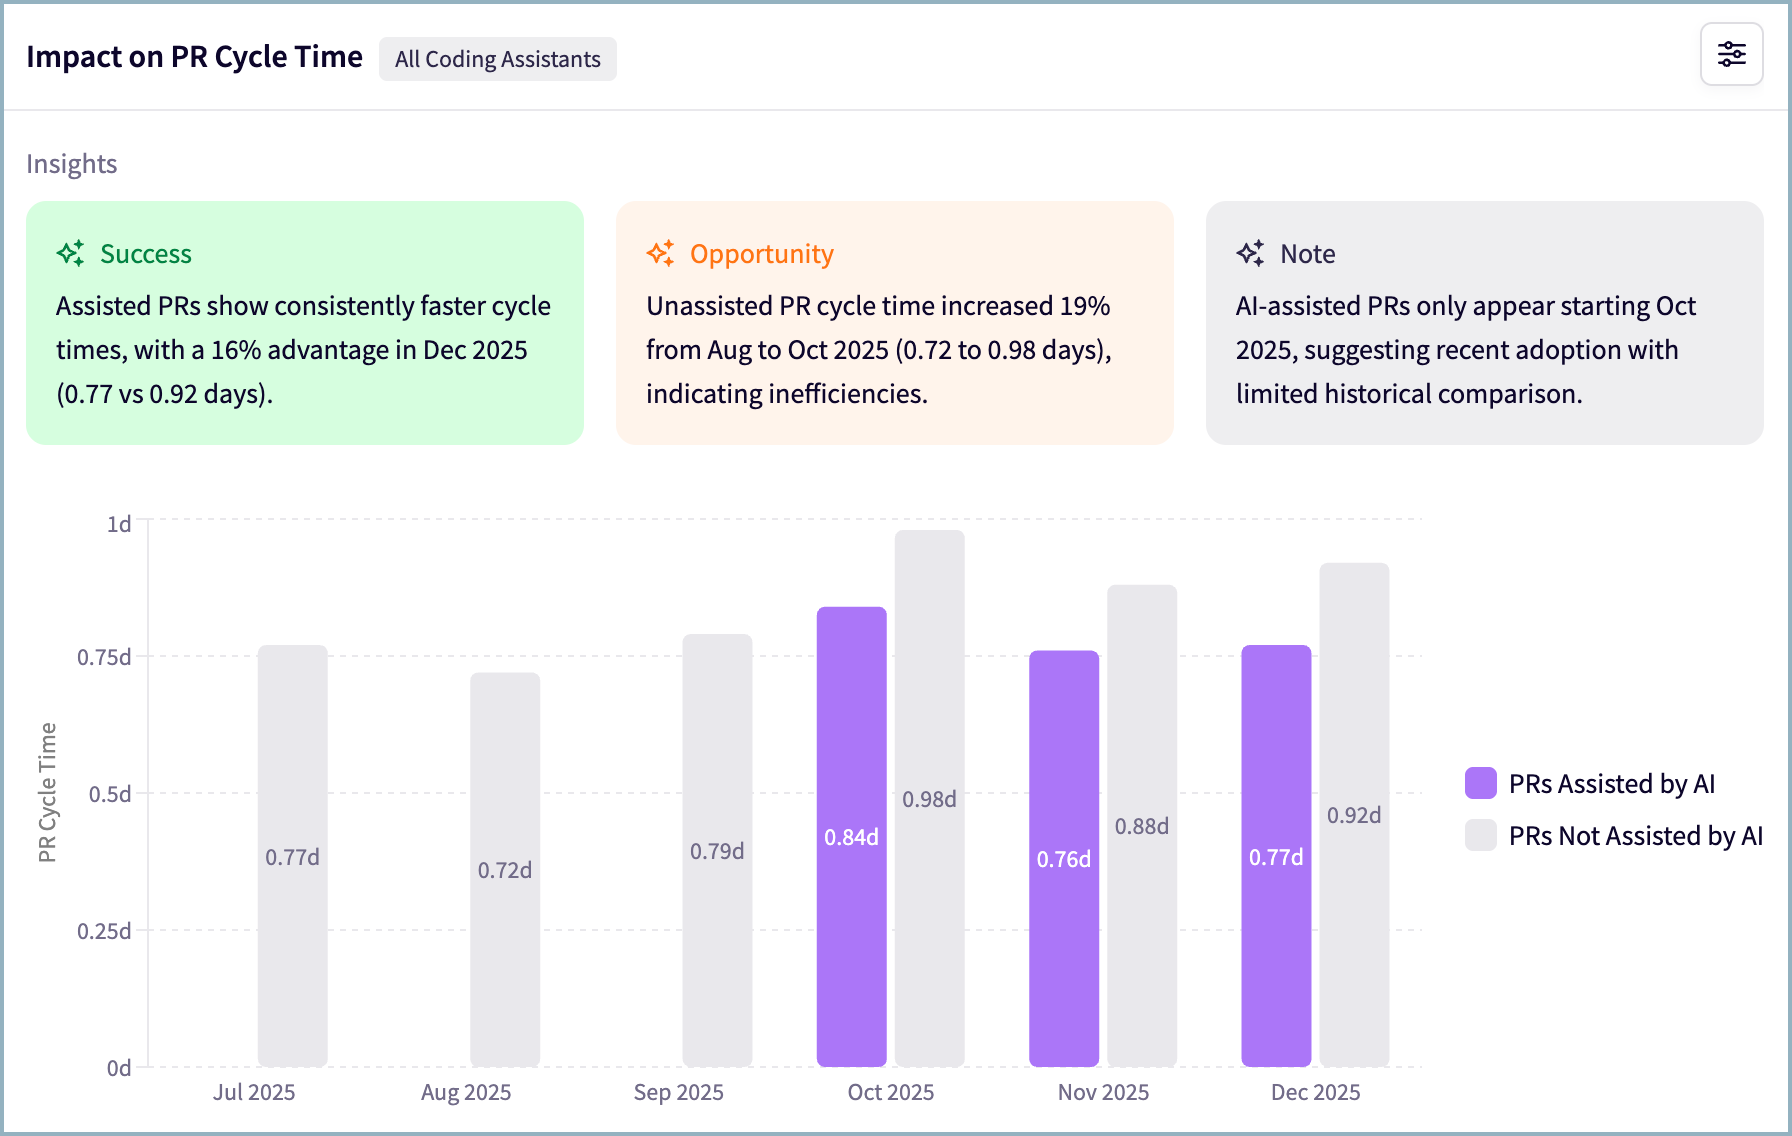
- How to say it:
- “Coding time fell X% while review time stayed stable – fewer engineer hours per PR with quality intact.”
- “Phase‑level efficiency lowers cost per change; review remains our risk control.”
- Ineffective vs. effective:
- Ineffective: “PR cycle time is down 10%.”
- Effective: “A 10% reduction driven primarily by coding efficiency lowers cost per PR, while steady review times protect quality.”
- Possible decision call: “If review becomes the bottleneck, invest in review automation or process improvements.”
- Pitfall to avoid: Not every phase must shrink – explicitly call out speed‑versus‑quality trade‑offs.
Get Board-ready AI Insights
Ready to provide more in-depth and impactful reporting on AI for your engineering organization? Learn more about Jellyfish AI Impact today!
Get a DemoAbout the author

Jackson is Customer Education Lead at Jellyfish where he heads up the Jellyfish Academy.