In this article
AI coding tools entered most engineering organizations through experimentation budgets, where a pilot for a small group of developers carried little financial risk and required little justification. Renewal changes those conditions.
Enterprise seat pricing and consumption-based billing have moved these tools into the core engineering software budget, which brings them under the same review as every other contract of that size.
Forrester expects enterprises to defer a quarter of their planned AI spend into 2027, with fewer than a third of decision-makers able to connect AI investment to financial growth.
Most engineering leaders prepare using vendor reports, which document product usage and leave the finance team to work out the return on its own. This guide covers the adoption, productivity, and outcome metrics that show what the spend returned.
Why Native Metrics Fail the CFO
Why Native Metrics Fail the CFO
The dashboards inside GitHub Copilot, Cursor, and Claude Code track engagement in useful detail, and that detail helps engineering managers understand how their teams work.
Those dashboards were built for those managers. A CFO reviewing the renewal wants the combined cost of every AI coding tool you license, along with evidence of what changed downstream.
The metrics engineering leaders reach for most often each break down in a particular way:
- Lines of code generated: Code volume arrives quickly with AI agents, and volume alone establishes nothing about value. GitClear’s analysis of 623 million code changes from 2023 to 2026 found code duplication up 81%, and refactoring line moves down 70% against pre-AI baselines. Higher output can carry a maintenance burden that costs more than the licenses.
- Suggestion acceptance rate: The metric counts how often developers keep the code a tool proposes, measured at the moment of the keystroke. Everything that determines whether the code was worth keeping happens later, in review, testing, and production. Acceptance describes how developers interact with the product, and a budget review needs evidence of what the product delivered.
- Active seat utilization: The metric reports the share of provisioned seats with any activity in a period, and it sets no threshold for meaningful use, so a developer who runs one autocomplete a week counts the same as one who works through the tool for most of the day. That range makes utilization useful for license planning and thin as evidence that the investment changed how the organization builds software.
- Self-reported time savings: Vendor ROI calculators multiply estimated hours saved by loaded developer cost, and developers supply the estimate. METR’s randomized trial found that experienced developers judged AI to have made them 20% faster on tasks where measured completion time ran 19% longer. Finance discounts self-reported productivity data for this reason.
- Token and request counts: These appear in every usage dashboard without any connection to the amount on the invoice. Consumption pricing makes that gap expensive, since the same volume costs different amounts across tools and across months. Your finance team reconciles spend against output as standard practice, and that reconciliation runs on billing data the vendor’s reporting never touches.
Keep in mind → None of this makes the dashboards useless. It makes them insufficient for the audience reviewing your budget, which needs data from source control, project tracking, and billing joined into one picture. The framework below organizes exactly that.
Crucial Metrics for AI Budget Justification
Crucial Metrics for AI Budget Justification
Finance examines a renewal case in a predictable order, starting with whether you used what you bought and working toward whether the business gained anything.
The Jellyfish AI Impact Framework organizes metrics along that same path, covering adoption, developer productivity, and business outcomes.
Building the case in this order means each pillar supports the one after it, and all of it runs on data you already collect.
Adoption & Enablement Metrics
A renewal fails fastest on adoption. Finance needs no engineering background to understand that an organization paying for 400 seats and using 250 of them has a problem, and that finding closes the conversation before any productivity data gets a hearing.
These five metrics show how far adoption spread, how deeply developers use the tools, what the unused seats cost, and how the work splits across your stack:
- AI adoption maturity score: A composite figure that scores how deeply AI tools have entered daily development work. It weighs frequency of use, the range of tasks developers apply the tools to, and how far your enablement work has closed the gaps. Finance accepts a rising score as evidence the organization adopted what it paid for. Show the trend across the full contract term and break it out by team.
- Daily to weekly active user ratio: How many of your weekly users show up daily. The ratio separates a tool developers reach for by habit from one they open when a task reminds them it exists. Finance knows this measure from other software categories, so it needs no explanation in the room.
- License utilization and idle seats: The share of seats with zero or minimal use across a rolling 30-day window. Native dashboards report this number to prove the purchase was justified, and a renewal case uses the same data the other way. Set an engagement floor, find every seat below it, and report what you reclaimed. Bring the idle seat count, the seats you cut, and the annual saving.
- Cross-tool distribution: Engagement across every AI tool you license, normalized so the figures compare directly. Jellyfish research puts the share of engineering teams that run two or more AI coding tools at 48%, and each one adds a contract, consumption charges, and its own definitions. Finance uses this to spot duplicate coverage, meaning two tools funded for the same work.
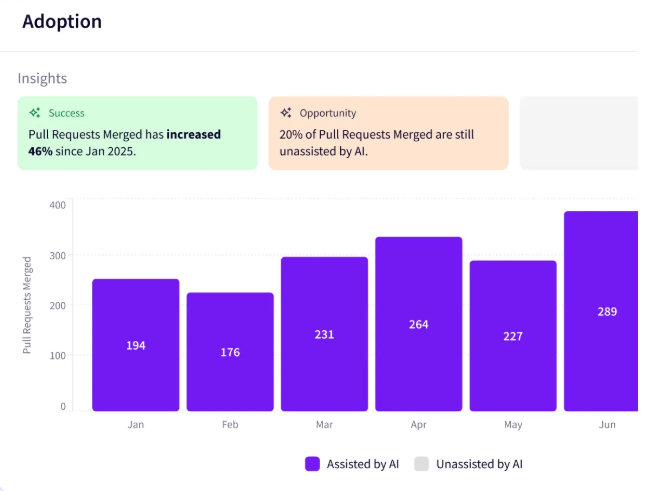
- Share of AI-assisted PRs: How much of your merged work involved AI, taken from Git rather than from a vendor. The metric moves adoption out of the editor and into shipped code, and it gives every later productivity claim a denominator. Report it monthly across the contract period and explain any plateau before finance asks about it.
The mistake to avoid: The common mistake is presenting high usage as the win. Finance already assumes developers use tools they were given, so a strong number confirms an expectation and moves nothing. What works is evidence of management, meaning the gaps you found, the seats you reclaimed, and the enablement work that raised the weak teams.
How to translate it for finance: Adoption metrics already carry cost information, so the conversion takes very little work. The share of engineers in daily use is also the share of your license spend doing something, and your idle seat count becomes an annual figure once you multiply it by the per-seat price. Doing that arithmetic before the meeting means your CFO reads the numbers in the terms they work in every day, and the engineering detail stays available for anyone who asks how you arrived at it.
PRO TIP 💡: Adoption data is scattered across vendor consoles, your identity provider, and Git, which is why most leaders rebuild it by hand each quarter. Jellyfish Adoption Insights detects who uses AI, on what work, and through which tool, straight from system signals. Enablement Insights then shows which teams stalled and what to change.
Developer Productivity & Velocity Metrics
This is the pillar where most renewal cases overreach. Speed gains are easy to find and easy to challenge, since a CFO who sees faster delivery will ask what it cost in quality and what else changed that year.
The metrics below answer both halves, and they pull from source control and project tracking history that predates your first license:
- PR cycle time, split into coding and review: The total time from first commit to merge, separated into the hours developers spend writing and the hours a pull request waits for review. The split matters more than the total, because AI tools compress coding time and can lengthen review as larger changes reach reviewers. Present both segments across the contract period.
- Escaped defects: Bugs that reach production without your testing pipeline catching them first. Any speed claim you make collapses if this number climbed during the contract period, so check it before you build the deck. Plot it against your AI-assisted PR share across the same months. A flat defect line under rising AI involvement is one of the strongest pieces of evidence available to you.
- Development throughput: Merged pull requests per developer across a period. The organization-wide figure has limited use, so cut it by team, language, and experience level to find where the gains came from. Finance reads a concentrated gain as a case for targeted licensing, and the teams that showed nothing give you a defensible place to reduce seats.
- Change failure rate: The share of deployments that need a rollback, hotfix, or patch. Google’s DORA research found that each 25% increase in AI adoption correlated with a 7.2% drop in delivery stability, so Finance has reason to ask about this one directly. Pair it with deployment frequency across the contract period.
- Developer experience index: A structured survey that covers friction, focus time, and satisfaction across the engineering organization. Self-reported estimates of time saved carry no weight in a budget review, and self-reported friction does, because developers describe their own experience more reliably than they measure their own speed.
The mistake to avoid: Overclaiming costs more than underclaiming in this pillar. A CFO who finds one unsupported attribution discounts everything around it, and twelve months of hiring, reorganization, and process change gives them plenty to find. Present the throughput gain with the confounders named, separate what your data can isolate, and call the rest correlation.
How to translate it for finance: This pillar resists dollar conversion, and forcing it produces the same weak arithmetic the vendor ROI calculators use. Multiplying hours saved by loaded developer cost assumes the saved hours went to valuable work, which is the thing you have not shown yet. Report productivity in units your CFO can check, meaning pull requests merged, days of cycle time, and defect counts, and leave the money conversion to the outcome metrics.
Outcome & Value Metrics
Adoption and productivity data describe what happened inside engineering. Outcome data describes what the business received, which is what your CFO needs to approve the renewal.
These metrics cover the cost of a unit of delivered work and the share of your capacity going to work that grows the business. Three of them do the job:
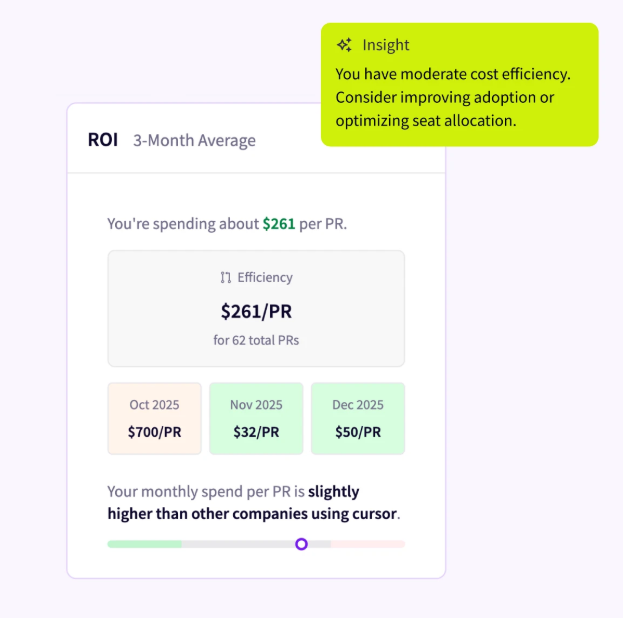
- Cost per merged pull request: Total engineering cost for a period divided by merged pull requests, with AI license and consumption spend included in the numerator. This is the closest the framework comes to a unit economics figure, and finance teams work in unit costs every day. A falling cost per PR across the contract term makes the argument without any translation. Pull it as a monthly series, since an annual figure hides whether the improvement held or reversed halfway through.
- Token spend against output: License cost is fixed and predictable. Token consumption is neither, and it climbs fastest on the agentic tools your teams adopted most recently. Dividing token spend by merged work at the team level shows where consumption produced results and where it funded expensive experimentation. Your finance team has already seen the overage line, so arriving with that breakdown answers the question before anyone asks it.
- Proportion of capacity going to growth work: The share of engineering effort on new capability against the share on maintenance, support, and technical debt. This metric converts efficiency into business value, because time freed from routine work only counts if it moved somewhere the business funds. Compare the split from before adoption with the split now.
The mistake to avoid: One big mistake is presenting savings as headcount reduction. A CFO who hears that engineering can produce the same output with fewer people will act on it, and you lose the argument you came to win. Frame the result as capacity redirected, meaning the same team delivering more of the work the business ranks highest. That’s the framing that supports a renewal.
How to translate it for finance: These metrics already use finance language, so the work here runs the other way. Put the cost per PR trend, the capacity moved toward growth work, and your total AI spend on the same page as the renewal number you are requesting. A CFO who sees the return next to the ask has everything needed to approve it, and anything you leave on a separate slide has to be connected by someone else.
PRO TIP 💡: Cost per PR and token efficiency both require billing data joined to delivery data, and nothing does that join by default. The Jellyfish AI Token Spend Dashboard breaks consumption out by tool, team, or initiative with the output already attached, which is the reconciliation your finance team asks for.
Justify and Secure Your AI Investment & Budget with Jellyfish
Justify and Secure Your AI Investment & Budget with Jellyfish
Compiling these metrics manually is a project in itself. Each AI tool reports on its own product with its own definitions, your finance systems have no connection to Jira or Git, and the reconciliation falls to whoever owns the renewal. Most engineering leaders start that work too late and present whatever they managed to assemble.
Jellyfish works as the system of record for AI in engineering. It reads signals from Git, your planning systems, and your workflow data, then normalizes the fragments into one view of your whole AI stack. Because the numbers come from systems your finance team already trusts, they hold up in a budget review without a vendor’s name attached to the source.
What leaders track with Jellyfish:
- Adoption insights: Shows who uses AI, on what work, and through which tool, all from signals Jellyfish detects automatically. Your adoption case needs the daily active ratio, the AI-assisted PR share, and seat-level engagement, and this covers all three without a manual export.
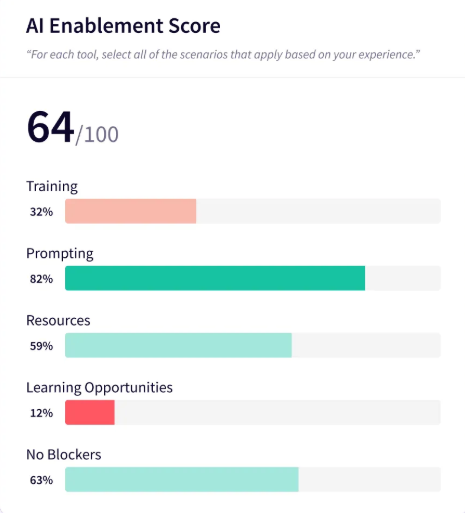
- Enablement insights: Finds your power users, shows where adoption stalled, and recommends what to change. A maturity score means more when you explain the movement behind it, and this gives you the enablement work and the teams that responded to it.
- Multi-tool comparison: Measures every assistant, agent, and newer tool against one model, so Copilot and Cursor figures compare directly. Duplicate coverage becomes visible, and you reach the meeting with the consolidation already made.
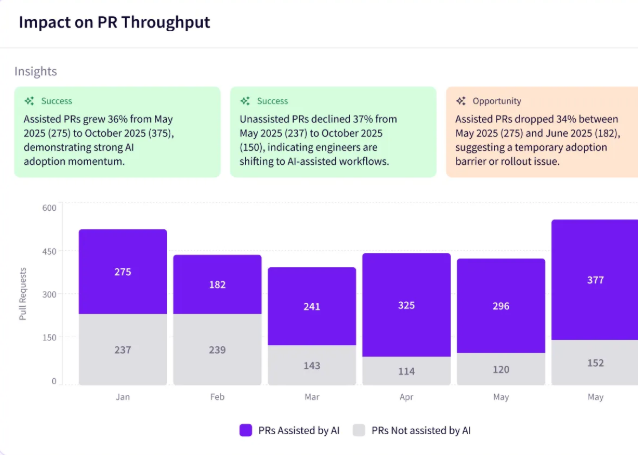
- Impact insights: Connects AI usage and spend to throughput, quality, and delivery speed, using signals your SDLC already produces. This bridges the productivity and outcome pillars and supplies the correlation your case rests on.
- AI token spend dashboard: Breaks spend and token usage out by tool, team, or initiative. Token consumption moves fastest and predicts worst of anything in your AI budget, so this is the line finance asks about first.
- Auto report builder: Produces executive-ready reports on what worked, what did not, and where to invest next. This replaces the manual assembly described above.
Your renewal meeting will happen whether or not the data is ready. The difference between a defended budget and a deferred one comes down to what you bring, and the evidence already exists across systems your organization runs today.
Book an AI Impact demo and see what your own Git and planning data already shows.
FAQs
FAQs
How does an AI measurement framework fit into standard software engineering metrics like DORA or the SPACE framework?
AI metrics feed those frameworks. DORA and SPACE measure delivery performance and developer experience, and both predate AI coding tools without losing relevance.
What changes is that AI adoption becomes a variable you test them against. Report your DORA metrics cut by AI usage level, and then compare heavy adopters against light adopters across the same period.
That comparison controls for the hiring, reorganization, and process changes that affected everyone, which makes it the strongest evidence available for a budget review. SPACE plays a similar role, with the efficiency and satisfaction dimensions absorbing your AI data directly.
How do we prove that AI-driven time savings aren’t negatively impacting our code quality?
Plot both on one timeline. Run your AI-assisted PR share against change failure rate and escaped defects, month by month across the contract period.
Flat quality under rising AI adoption is your evidence. Climbing defects means the speed costs you something, and finding that yourself beats hearing it from your CFO.
Which costs belong in an AI coding tool ROI calculation?
Three, and most engineering budgets only track one. Per-seat subscription fees show up cleanly on the invoice, so a 300-seat GitHub Copilot Business contract is easy to account for.
Consumption charges on agentic tools are harder, since they move every month. The one people forget is the time your platform engineering team spent on rollout and enablement, which is money that never appears on a vendor bill.
Add all three, divide by merged output, and compare that against your adoption rate. Paying full price on seats at 40% engagement is the clearest waste in your renewal case, and your return on investment looks very different once the setup cost goes in.
Should security vulnerabilities factor into the renewal case?
Yes, and you want the number before your CFO asks. AI code assistants generate from patterns in their training data, and LLMs reproduce insecure patterns as easily as secure ones, so any speed claim invites a question about what the speed introduced.
Pull vulnerability counts from your existing scanners and plot them against your AI-assisted PR share. Add mean time to recovery, because a rising MTTR under heavy adoption suggests code your teams find harder to debug. A flat security line is strong evidence. A climbing one at least gives you a problem you can name and a fix you can describe.
About the author

Lauren is Senior Product Marketing Director at Jellyfish where she works closely with the product team to bring software engineering intelligence solutions to market. Prior to Jellyfish, Lauren served as Director of Product Marketing at Pluralsight.