In this article
Distributed systems have changed the nature of production issues. A single transaction can move through dozens of services, queues, and APIs before it reaches the user.
When something goes wrong, monitoring systems point to the symptoms, but engineers still need to follow the path across the stack to find the root cause.
This is what observability is built for. It gives DevOps teams the telemetry and context to answer the questions that come up in every incident:
- Which service is the source of the slowdown, and which ones are downstream of it?
- How did the failure propagate across dependencies?
- What changed in the last hour that could explain the behavior?
In New Relic’s 2025 Observability Forecast, 75% of businesses reported positive ROI on observability, and 18% reported returns of 3x to 10x.
In this guide, we’ll cover what observability means in a DevOps context, how it differs from traditional monitoring, the three pillars you keep hearing about, and how engineering teams use it to keep production reliable.
What is DevOps Observability?
What is DevOps Observability?
DevOps observability is the practice of collecting and analyzing telemetry data from a software system so that engineering teams can understand how it behaves in production.
It covers everything from a single API call’s latency to the health of an entire distributed environment, and it gives DevOps teams the visibility they need to investigate, debug, and improve their systems.
In a working DevOps environment, observability is what lets the team move from “something is wrong” to “here’s exactly what’s happening and why.”
With the right data and tooling in place, engineers can:
- Trace a single transaction across every service, queue, and database it touches
- Correlate a spike in errors with a recent deploy, config change, or infrastructure event
- Investigate failure modes the team has never seen before, without shipping new instrumentation first
- Answer ad hoc questions about system behavior instead of relying only on preconfigured dashboards
- Share a common view of production across developers, SREs, and platform teams
And telemetry data is the raw material that makes observability possible. It’s everything a system emits about its own behavior, collected continuously from every part of the stack and stored where engineers can query it later.
Example → A retailer’s checkout latency spikes on a Friday evening. The on-call engineer opens a trace for a slow transaction and follows it from the web frontend, through the cart service, into a third-party fraud check API that’s responding in 8 seconds instead of 200 milliseconds. The team falls back to a cached response, latency drops, and the post-incident review has the full timeline ready to go.
Observability vs. Traditional Monitoring: What’s the Difference?
Observability vs. Traditional Monitoring: What’s the Difference?
Plenty of teams use “observability” and “monitoring” interchangeably, and plenty of vendors are happy to let them. The two practices are related, but they aren’t the same thing.
They solve different problems, they answer different questions, and most engineering teams running modern systems rely on both.
Monitoring is built around a fixed set of known conditions. The team decides in advance what to measure (CPU usage, error rates, response times, queue depth) and sets thresholds that trigger an alert when something crosses the line. It works well for failure modes the team has already encountered and can plan for.
Observability picks up where monitoring stops. It collects broad, high-detail telemetry across the system and gives engineers the tooling to query it directly. When something breaks in a way the team didn’t anticipate, observability is what makes the investigation possible without first writing new alerts or shipping new instrumentation.
Here’s how the two compare across dimensions:
| Dimension | Monitoring | Observability |
| Primary question | “Is the system working as expected?” | “Why is the system behaving this way?” |
| Failure modes | Known and predefined | Known and unknown |
| Data model | Predefined metrics, dashboards, and alerts | High-cardinality telemetry that engineers can query freely |
| Typical workflow | Alert fires, team follows a runbook | Alert fires, team investigates with logs, metrics, and traces |
| Best fit | Stable, predictable systems and SLAs | Distributed, fast-changing systems |
| Output | Status indicators and threshold-based alerts | Answers to ad hoc questions about production |
The split makes more sense once you look at how software has changed. Monolithic applications had a finite set of well-understood failure modes, so monitoring covered most of what a team needed.
Distributed systems broke that assumption. The number of possible failure modes outgrew anything a team could reasonably alert on, and observability filled the gap.
| When to use each → Both have a place in a working DevOps practice:
➢ Monitoring is best for tracking known signals (CPU, memory, error rate, SLA compliance) where the team already knows what to watch for. ➢ Observability is best for investigating unknown signals, distributed system behavior, and incidents that don’t match anything the team has seen before. Most mature DevOps practices run both, with monitoring covering the knowns and observability handling the unknowns. |
Key Pillars of DevOps Observability
Key Pillars of DevOps Observability
Most observability practices are built on three pillars. Each one shows a different side of system behavior, and each is suited to a different kind of question.
The value of an observability setup grows when all three are collected, stored, and queryable in the same place.
Logs
Logs are timestamped records of events inside a system. Any service can write a log line whenever something noteworthy happens, from a transaction processing cleanly to an unhandled exception bringing down a call.
Logs hold the most detail of the three pillars, which makes them the right tool when an investigation narrows down to specifics.
When a team needs to know exactly what happened during a single transaction, what input a service received, or what error a downstream dependency returned, logs almost always have the answer.
A typical log entry might include:
- The exact moment a payment service received a transaction and the response it returned
- The full stack trace of an unhandled exception, including file and line number
- A configuration change applied during a deploy, with the old and new values
- A database query that exceeded its timeout, with the query text and parameters
The trade-off → Cost and scale. Logs are detailed but expensive to store and slow to query in large volumes, which is why mature teams invest in structured formats and clear retention policies instead of logging everything indefinitely.
Example → A user reports that their order failed but the dashboard shows nothing unusual. The engineer pulls the logs for that user’s session, finds a serialization error in the cart service, and identifies the bad input that triggered it within minutes.
Metrics
Metrics are numerical measurements taken at regular intervals. A service might record one every second, every ten seconds, or every minute, for values like request count, response time, error rate, CPU usage, or queue depth.
Metrics are the most lightweight of the three pillars, which makes them the natural fit for continuous monitoring. When a team needs to track performance over time, compare behavior across services, or alert on threshold breaches, metrics get the job done.
A typical metric might track:
- The number of transactions a payment service processed per minute over the last 24 hours
- The p95 response time of an API endpoint, broken down by region
- CPU and memory usage across every host in a cluster, sampled every 15 seconds
- The depth of a job queue, with alerts that fire when it crosses a defined threshold
The trade-off → Limited context. Metrics show the team what is happening, but they don’t explain why, which is why most investigations start with a metric and finish in logs or traces.
Example → CPU usage on a database host crosses 85% for the third time in a week. The metric alert fires, the team checks the dashboard, and the trend shows a steady climb over the last 14 days. That’s the signal they need to plan a capacity upgrade before the issue becomes user-facing.
Traces
Traces follow a single transaction as it moves through a distributed system. Each step the transaction takes becomes a span, and the spans together build a connected timeline of where the work happened and how long each step took.
Traces are the most useful pillar for understanding behavior across service boundaries. They show which service caused a slow user experience, how a transaction moved through its dependencies, and where time was spent in a distributed call path.
A typical trace might show:
- A checkout transaction passing through the frontend, cart service, payment service, and fraud check API
- The exact span where latency exceeded the rest of the chain by a wide margin
- A failed call to a third-party dependency, with the error propagated back to the user
- The path of a transaction that crossed regions and the time spent in each one
The trade-off → Implementation cost. Traces require every service in the path to be instrumented consistently, and a missing span anywhere in the chain leaves a blind spot the team has to work around.
Example → A retailer’s checkout latency jumps from 400ms to 4 seconds during a promotion. The team opens a trace for one of the slow transactions, follows it from the frontend through the cart service, and finds a third-party fraud check API responding in 3.5 seconds. They fall back to a cached response and latency drops back to normal.
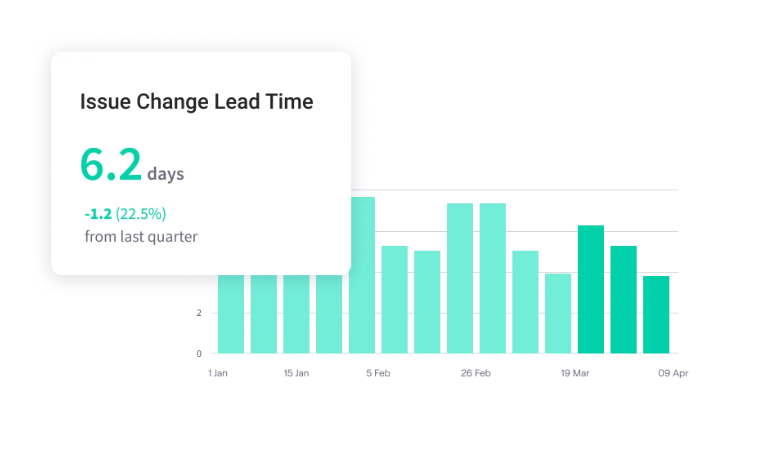
PRO TIP 💡: Logs, metrics, and traces are operational tools for DevOps teams during incidents. They also carry long-term signal for engineering leaders tracking MTTR, deploy frequency, and reliability trends across teams. Jellyfish pulls from your observability and incident tools and produces the engineering performance views leaders use for planning and budget conversations.
Key Benefits of Observability in DevOps
Key Benefits of Observability in DevOps
The case for observability gets stronger every year as systems grow more distributed and engineering teams take on more responsibility for production.
The benefits below cover both technical wins and business outcomes, and most mature teams see all of them to some degree:
- Fewer false-positive alerts: False alarms are one of the biggest time sinks on a DevOps team. A Forrester study from IBM found that pairing AIOps with observability lowered the time engineers spent chasing them by 80%. The team gets back hours every week and stops burning out on pages that lead nowhere.
- Lighter incident load: Mature observability speeds up resolution and reduces how often incidents happen in the first place. The same Forrester study found that combining AIOps with observability lowered the number of incidents experienced by 50%. Observability shows the team small anomalies early, well before they turn into full outages.
- Faster incident resolution: Observability shortens the time between when an alert fires and when an engineer understands the cause. Teams with full-stack observability are 18% more likely to resolve high-business-impact outages in under 30 minutes, according to New Relic’s Observability Forecast. When the team can pull logs, metrics, and traces from the same place, the path from alert to fix gets a lot shorter.
- Cloud cost control: The telemetry observability collects also exposes where infrastructure is overprovisioned and where workloads run inefficiently. 36% of organizations now use observability specifically to manage cloud costs. The data needed to identify waste is the same data the team is already collecting for performance and reliability.
- Less tool sprawl: Most teams running modern systems wrestle with too many observability tools. Arctiq’s 2025 survey of IT and DevOps leaders found that nearly one-third of organizations use five or more observability tools to monitor cloud applications, which leads to context switching, slow investigations, and gaps between tools. A unified observability practice replaces that fragmentation with a single queryable view of production.
- Proactive issue detection: Without observability, many performanceissues only come to light when customers or employees report them. NetScout’s research found that more than 60% of IT executives say overnight problems go undiscovered until employees notice them in the morning. With proper telemetry and anomaly detection, the team picks up the issue the moment it happens, hours before the help desk receives the first ticket.
| Where most teams start → The fastest payback usually comes from MTTR reduction and alert quality improvements, since both directly affect on-call quality and incident response time. Cost optimization and security integration tend to come later, once the team has clean instrumentation and a unified data model in place. Tying observability to business outcomes is the practice that takes the longest but delivers the most strategic value. |
The Core Phases of the Observability Lifecycle
The Core Phases of the Observability Lifecycle
Observability runs as a continuous pipeline that moves real-time data from the system being observed all the way through to the engineer responding to an issue.
The four phases below describe how that pipeline works in practice, from the moment a service starts emitting telemetry to the moment a team takes action on what the observability data shows:
Instrumentation
Instrumentation is the work that makes a system produce telemetry in the first place. It contains the code, agents, and configuration that make a service produce logs, metrics, and traces as it runs.
Without instrumentation, there’s nothing for the rest of the pipeline to collect. That’s why this phase quietly determines the ceiling on what a team can observe later.
Typical instrumentation work includes:
- Writing structured log statements in application code
- Configuring metrics libraries such as Prometheus client or OpenTelemetry
- Adding distributed tracing so context travels with each request across services
- Deploying agents on hosts, containers, and orchestration platforms to collect infrastructure-level signals
Common pitfall → Patchy coverage across services. If some parts of the stack are well instrumented and others aren’t, traces and logs cut off at the worst possible moment.
Collection and Storage
Once services start emitting telemetry, the team needs a pipeline to move that data somewhere useful. Collectors gather it from each host, processors filter and shape it along the way, and storage backends hold it for engineers to query later.
This phase carries the weight of the cost decisions in an observability practice, since the volume of telemetry can climb fast.
Most data collection and storage work covers:
- Running collectors or agents (OpenTelemetry Collector, Fluentd, Vector) to gather data from services and forward it to a backend
- Choosing a storage backend for each data type, such as a time-series database for metrics and an indexed store for logs and traces
- Setting up sampling, filtering, and aggregation so the team keeps the signal without paying for every byte
- Defining retention policies that match how long each data type stays useful for an investigation
Common pitfall → Storing everything by default. Telemetry volume grows much faster than most teams plan for, and without filtering and retention policies, the cost forces visibility trade-offs at the worst possible time.
Analysis and Visualization
Analysis and visualization is the phase where engineers interact with telemetry data directly. Dashboards, query interfaces, and trace explorers take stored logs, metrics, and traces and present them in a form the team can work with. Most of the day-to-day interaction with an observability stack happens here.
What this phase typically includes:
- Building dashboards that bring logs, metrics, and traces together for a single service or workflow
- Running ad hoc queries to look into specific transactions, time windows, or errors
- Connecting signals across pillars, like moving from a metric spike to the traces and logs behind it
- Setting up service-level views that track SLIs, error budgets, and key system performance indicators
Common pitfall → Stale dashboards. A dashboard built early in the year often doesn’t match the system by the end of it, and the team reaches for ad hoc queries during incidents because the dashboard no longer matches what’s running in production.
Alerting and Response
This phase handles notifications and the response workflow that follows. Alerts fire when telemetry data crosses defined conditions. From there, the team moves through routing, incident management, runbook execution, and post-incident review. The work here ties observability into the broader operational toolchain a team uses on call.
Most alerting and response work covers:
- Defining alerts on metrics and traces that fire when behavior crosses a threshold or breaks a pattern
- Routing alerts to the right team or service owner through tools like PagerDuty, Opsgenie, or Slack
- Linking alerts to runbooks or playbooks so the on-call engineer has a starting point
- Feeding incident data back into post-incident review and longer-term improvements to the observability stack
Common pitfall → Alert fatigue. Too many alerts, or alerts without clear ownership and context, train engineers to ignore the entire stream, which means the high-priority ones often go unanswered.
Common Challenges of Implementing Observability
Common Challenges of Implementing Observability
A working observability practice takes time to build. Most engineering teams run into a familiar set of challenges along the way, some technical and some organizational.
The list below covers the ones that show up most often across the industry:
- Cost overruns from telemetry data growth: The price of running an observability stack often grows faster than the value the team gets from it. A Wakefield Research survey commissioned by Edge Delta found that 98% of companies experience cost overages or unexpected spikes at least a few times a year, and 51% see them every month. As systems generate more data, the line between useful telemetry and expensive storage gets harder to draw.
- Data volume that outpaces what teams can manage manually. The amount of telemetry modern systems produce has outgrown what any team can read directly. Dynatrace’s State of Observability research found that 86% of technology leaders say cloud-native stacks produce a vast amount of data beyond humans’ ability to manage. That’s why AI-powered correlation and pattern detection have moved from a nice-to-have to a near-requirement at scale.
- Skills and expertise gaps within engineering teams: Many teams don’t have the in-house expertise to design or operate a strong observability practice. Logz’s 2024 Observability Pulse survey found that 48% of respondents cite lack of knowledge on the team as the top challenge, up from 30% the year before. The gap forces a choice between slower in-house ramp-up and external hires that aren’t always available.
- Compliance and security obligations around telemetry data: Observability collects detailed records of how a system behaves, which means it also collects data that compliance teams need to control. The same Logz study ranked data security as the second-most-cited challenge in the space, at 43% of respondents. Personally identifiable information, retention requirements, and access controls all bring operational overhead that most teams underestimate going in.
- Inconsistent or incomplete instrumentation across services: Observability only works when every part of the system contributes telemetry. Research from Neurones IT Asia found that only 9% of enterprise software applications today are fully observable end-to-end, which means most teams are working with meaningful blind spots whether they realize it or not.
| The pattern across these challenges → Most observability problems come down to three things. The data volume grew faster than the team planned for, the toolset expanded without a unified data model, and the team hasn’t had the time to build the expertise the practice asks for. Solving any one of these tends to make the others easier. |
Best Practices for Building an Observability Strategy
Best Practices for Building an Observability Strategy
Observability rewards teams that invest in standards, automation, and discipline around how the data is collected and used.
The five practices below are where that investment pays back the fastest:
1. Standardize Instrumentation Across Services
The depth and consistency of instrumentation determine how much the team can observe in production. Well-instrumented services give engineers detailed data during investigations. Services with thin instrumentation produce blind spots that slow the entire workflow.
A consistent instrumentation standard usually involves:
- Picking a default framework, with OpenTelemetry as the most common choice in 2026
- Defining a minimum set of telemetry every service has to emit before it ships to production
- Including instrumentation in code reviews so coverage holds up as the codebase grows
- Aligning on names and attributes for logs, metrics, and traces so engineers can query across services without extra work
What happens without it → The team can only investigate as deeply as the worst-instrumented service in the call path, which is usually the one closest to the bug.
2. Build Alerting Around User Impact
Strong alerting strategies start from what the user experiences and work backward. When alerts fire on customer-facing symptoms (slow checkout, failed logins, missed payments), each page points to an issue worth waking someone up for.
When alerts fire on infrastructure components, many of them have no visible effect on customers, even if the engineering details are technically interesting.
Practices that support this approach:
- Defining alerts against SLIs that track user-facing performance and reliability
- Setting thresholds informed by error budgets and customer expectations
- Routing component-level signals into dashboards for trend analysis, away from the paging channel
- Reviewing alerting rules regularly so they evolve with how the system fails
What happens without it → The team gets paged for problems that don’t reach the customer, and the alerting system loses the trust it needs to work during a high-severity incident.
3. Treat Dashboards and Runbooks as Code
Dashboards and runbooks are part of the operational stack, and the same engineering practices that apply to application code apply to them as well. Version control, code review, and clear ownership help keep these artifacts current as services and architectures evolve.
The approach is sometimes called dashboards-as-code or runbooks-as-code, and most modern observability platforms support it natively.
In practice, the approach typically includes:
- Source control for dashboard definitions and runbook documents
- Pull request review for updates
- Defined ownership at the team or service level
- Scheduled audits to remove outdated or unused artifacts
What happens without it → Dashboards and runbooks accumulate faster than the team can maintain them, and the ones engineers need during an incident are often out of date.
4. Plan Cost Controls Before Scale Forces Them
Observability costs grow with telemetry volume, and telemetry volume grows with system complexity. Without deliberate controls, the line item climbs to a point where the team has to react quickly, often by removing visibility the team relied on. Setting cost controls early avoids that scenario and keeps the practice aligned with the budget over time.
Common cost controls include:
- Sampling for traces and high-volume logs to keep ingestion manageable
- Retention rules that match the operational value of each data type
- Tiered storage so older data costs less to keep around
- Periodic review of telemetry sources to find what is no longer providing value
What happens without it → Cost growth catches the team off guard, and the response is usually to remove data sources quickly without time to evaluate what each one was worth.
5. Connect Observability to Business Metrics
The most mature observability practices connect technical signals to business performance. Latency, error rate, and uptime have operational value on their own, and that value grows when the team can show how each one affects revenue and user experience. The connection also makes observability easier to fund and defend during budget cycles.
Common ways to make the connection:
- Defining SLIs that track user experience for the most important workflows
- Setting SLOs informed by customer expectations and contractual commitments
- Tracking error budgets that align engineering and product priorities
- Reporting reliability and performance in terms the business already uses
What happens without it → Observability stays a purely technical concern, and the team has limited evidence to point to when leadership questions the cost of the practice.
PRO TIP 💡: Tying observability to business outcomes is easier when the metrics show up in the same views leadership already uses. Jellyfish pulls operational data from your observability and incident tools and presents it as DORA trends, allocation breakdowns, and benchmarks alongside the rest of the engineering picture.
From Observability to Engineering Intelligence
From Observability to Engineering Intelligence
Observability tools give engineering teams a clear view into application and infrastructure health. Engineering leaders, on the other hand, often have the opposite problem.
They can see how the systems are running, but they can’t see as easily how their engineering org is running, where bottlenecks are slowing things down, and how engineering hours are being spent against company priorities.
Jellyfish is built for that side of the problem. It’s an engineering management platform that pulls data from your observability and incident tools and lines it up with signals from Git, Jira, CI/CD, HR, and finance. The output is a single view of how the engineering team is performing across delivery, quality, allocation, and AI impact.
For DevOps teams investing in observability, Jellyfish translates the work into engineering performance in a few specific ways:
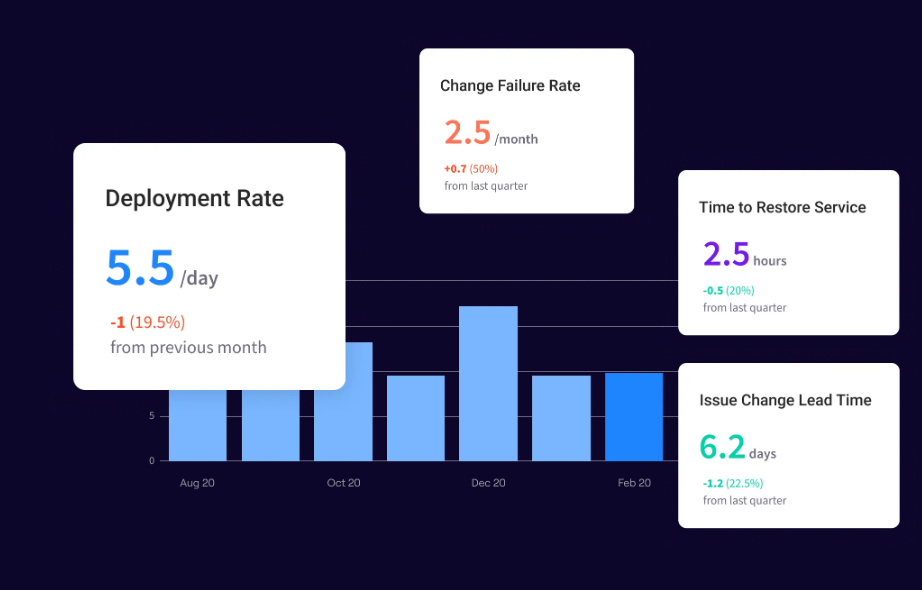
- DORA metrics tracking: Jellyfish pulls lead time, deployment frequency, MTTR, and change failure rate directly from your CI/CD and incident tools. The numbers update continuously, so engineering leaders have a current view of delivery performance any time they need it.
- A unified engineering data model: Most engineering data is split across observability, incident management, and delivery tools, each with its own format. Jellyfish brings those signals together in a single model, which removes the need for custom dashboards or manual reconciliation when leaders want a complete view.
- Allocation visibility for on-call and unplanned work: Jellyfish breaks down where engineering time goes across roadmap work, infrastructure, support, and incident response. As observability work pays off, the allocation report tracks how much developer time moves from reactive to planned work, in a format leadership can read.
- Industry benchmarking on operational metrics: Built-in benchmarks against DORA performance levels (elite, high, medium, low) show where your team stands relative to peers. The comparison gives leaders a defensible reference point for budget decisions and roadmap conversations.
- AI impact measurement: As AI coding tools and AI-driven incident response become standard, Jellyfish tracks how they affect delivery, quality, and on-call workload. For DevOps teams using AI inside their observability stack, this is what quantifies whether the investment is paying off.
- Wide integration coverage across the SDLC: Jellyfish integrates with the observability, monitoring, and incident management platforms most DevOps teams already run, plus the rest of the engineering stack across Git, Jira, HR, and finance. Teams keep their existing observability setup and get a single view of how it ties into the broader engineering picture.
- Developer experience insights: The platform brings DevEx survey responses together with system signals from your tools so engineering leaders can see how alert fatigue, on-call burden, and workflow friction affect the team. Problems that don’t show up in raw system metrics tend to come through clearly once developer sentiment is part of the picture.
Jellyfish is built for that handoff between operational data and engineering performance reporting. The tools you have stay in place, and the reporting gets a lot easier.
Book a demo to see it run on your stack.
FAQs
FAQs
What are the three pillars of observability?
The three pillars of observability are logs, metrics, and traces.
- Logs record discrete events with timestamps, such as errors, transactions, or system changes.
- Metrics are numerical values measured over time, including things like latency, error rate, and resource utilization.
- Traces follow a transaction as it moves through a distributed system, mapping each step from start to finish.
Together, they give engineering teams the data they need to understand both what is happening in production and why.
How does APM relate to observability?
Application Performance Monitoring (APM) is one part of a broader observability practice. APM focuses on tracking the performance and availability of applications, including response times, throughput, and error rates.
Observability takes the same ground and expands the scope, combining logs, metrics, and traces across the entire stack to investigate behavior the team didn’t anticipate.
Most modern APM tools have evolved into observability platforms, and the two terms are often used interchangeably. The practical difference is that APM tells you how an application is performing, while observability tells you why it’s performing that way.
Why is distributed tracing important for microservices?
In a microservices environment, a user transaction can move through dozens of services before it completes. If one of them fails or slows down, finding the source quickly is hard without a connected view.
Distributed tracing gives engineers that view. Each step in the transaction becomes a span, the spans link together into a trace, and the team can see exactly where time was spent and where the transaction broke.
What observability tools do DevOps teams use most often?
The observability landscape covers a mix of open source projects and commercial platforms. Grafana is widely used for dashboards and visualization, Jaeger for distributed tracing, and Prometheus for metrics collection. Many teams pair these monitoring tools with cloud-native services from AWS, Azure, or GCP for multi-cloud environments running on Kubernetes.
The choice usually comes down to whether a team wants to run its own stack or pay a vendor for managed infrastructure. Most modern teams run a mix of both, with open source tools handling specific pillars and commercial platforms tying everything together.
How does observability fit into the software development lifecycle?
Observability shows up at multiple stages of the software development lifecycle, well beyond production support. Teams that bake instrumentation into their continuous integration pipelines catch performance regressions before code reaches customers, and the same telemetry helps developers with troubleshooting during local development.
When observability data stays siloed inside the operations team, the rest of engineering loses access to information that would speed up decision-making earlier in the build process. Teams that treat telemetry as a shared resource see faster feedback loops across development, QA, and production support.
Can observability prevent system downtime?
Observability cannot prevent every outage, but it makes downtime less likely and shorter when it happens. Engineers can detect issues earlier through anomaly detection, see how problems propagate across services, and resolve incidents faster because the data they need is queryable in one place.
Mature observability practices typically reduce both incident frequency and mean time to recovery, which directly improves uptime.
About the author

Lauren is Senior Product Marketing Director at Jellyfish where she works closely with the product team to bring software engineering intelligence solutions to market. Prior to Jellyfish, Lauren served as Director of Product Marketing at Pluralsight.