In this article
Somewhere between the rollout announcement and the quarterly business review, most engineering organizations lose track of what their AI coding tools are doing.
Developers have GitHub Copilot, Cursor, and Claude Code available to them, and leadership has almost no visibility into how often those tools get used or what happens to the code that comes out of them.
Jellyfish platform data across more than 1,000 companies shows how large that blind spot can grow. Median AI adoption has reached 74% while median AI-assisted code stands at 27%, so the tools have far more users than they have influence.
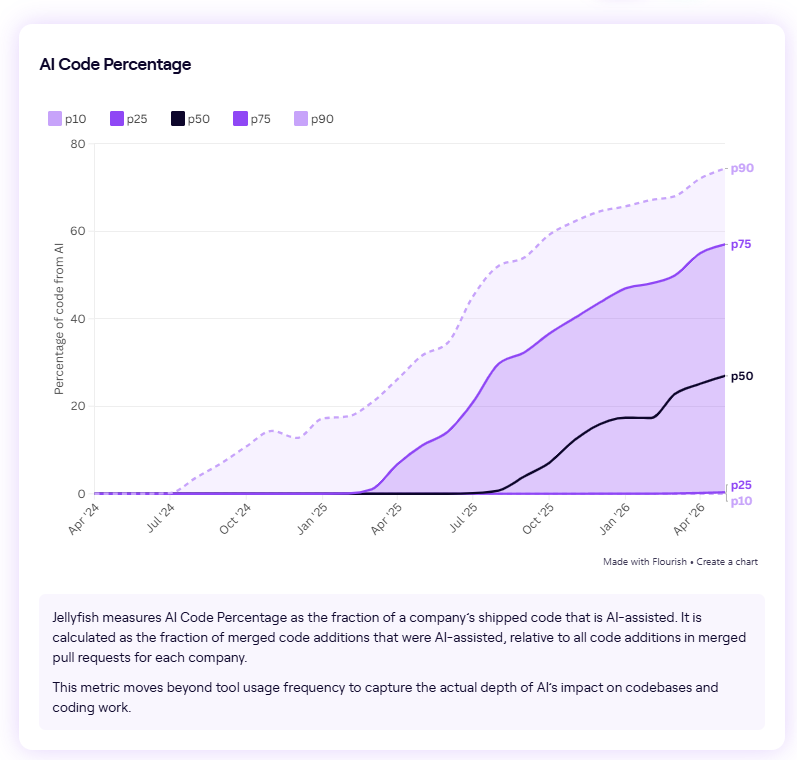
The metrics below cover what your admin console leaves out, from license coverage through usage frequency to the share of code that ships with AI assistance.
Why AI Coding Tool Adoption Metrics Matter
Why AI Coding Tool Adoption Metrics Matter
Adoption is the first stage of AI impact, and it gates everything measured after it. Cycle time, code quality, and delivery outcomes stay flat while developers open an AI tool a few times a month.
Here is what makes adoption metrics worth the instrumentation effort:
- Adoption explains flat results: When throughput and cycle time refuse to move after an AI rollout, two explanations compete. Either the tools deliver nothing for your codebase, or your developers rarely use them. That 74/27 split between adoption and AI-assisted code puts most organizations in the second category. Adoption data tells you which one applies before you write off the investment.
- Licenses overstate adoption: A license count confirms procurement worked and confirms nothing else. Jellyfish tracks Access Percentage and Frequent AI Users Percentage as separate metrics for exactly this reason, defining a frequent user as an engineer working with AI coding tools three or more days a week. The distance between those two numbers is where most AI budgets go to waste.
- Developer sentiment misstates adoption in the other direction: Google’s 2025 DORA report found that more than 80% of technology professionals believe AI improved their productivity, while the same research showed AI adoption carrying a negative relationship with software delivery stability. Around 30% of those respondents also reported little or no trust in AI-generated code. Survey answers describe how a rollout feels, and adoption metrics describe what it produced.
- Adoption predicts outcomes, which makes it a leading indicator: Engineering leaders can manage adoption months before impact appears in delivery data. Jellyfish benchmark data shows companies in the lowest adoption tier merging roughly 1.57 PRs per engineer per week against 2.81 for the highest tier, a difference of about 79%. Moving a team up one tier is a concrete lever, and it has a measurable payoff at the far end.
- Adoption data tells enablement where to go: Training budgets, internal champions, and prompt libraries produce results when aimed at the teams that stalled, and produce very little when spread evenly. Jellyfish research found that only 10% of the 636 engineering leaders surveyed for the 2026 State of Engineering Management Report reported both strong enablement and high adoption, which leaves most organizations investing without a target. Segmented adoption data supplies the target.
Core AI coding tool adoption metrics
Core AI coding tool adoption metrics
The engineering metrics below cover the full arc of an AI rollout, from the day licenses go out to the day agents open pull requests without a human author. Not every organization needs all of them, and the early ones matter most in the first two quarters:
| Metric | What it measures | What a low number tells you |
| Access percentage | The fraction of engineers who hold a license to an AI coding tool | Provisioning has gaps, or the rollout never reached some teams |
| Daily active users | How many engineers work with AI tools consistently, with three or more days a week marking real habit | Developers have the tools and treat them as occasional help |
| Adoption rate by team or cohort | Where usage spread and where it stalled, segmented by team, role, or rollout phase | Enablement reached some groups and skipped others |
| Time to first AI-assisted commit | The gap between license provisioning and an engineer’s first merged AI-assisted change | Onboarding failed, and the license went out with no path to use it |
| AI-assisted PRs or commits | The share of merged engineering work that AI influenced | Engineers use AI to explore and write production code by hand |
| Repository coverage | The share of active repositories that receive AI-assisted commits | AI reaches greenfield work and leaves your legacy codebase untouched |
| Adoption concentration | The share of AI-assisted code produced by your top decile of engineers | A handful of enthusiasts carry your entire adoption number |
| Agent merge rate | The share of agent-created PRs that reach main | Agent output creates review overhead and delivers little |
| Adoption momentum | Whether usage grows, plateaus, or declines across the rollout | The pilot peaked and interest faded afterward |
No metric here survives alone. Access percentage peaks on the day licenses go out, and daily active users counts the developer who opened Cursor once and closed it.
Break every number down by team, tenure, and repository, since a company-wide average buries the groups that need attention.
PRO TIP 💡: Collecting this data is the hard part, because vendor consoles hold access and your Git history holds actual usage. Jellyfish AI Impact reads both from system signals, which means access, active users, and frequency arrive together instead of across three separate exports. Teams that give up on these metrics usually give up on the reconciliation, and this removes it.
Metrics That Connect Adoption to Engineering Impact
Metrics That Connect Adoption to Engineering Impact
Adoption metrics confirm developers use AI. They say nothing about whether the organization builds software any faster. Walking the delivery pipeline in order, one metric per stage, shows you where the gains from AI-assisted code flow through and where they stop.
Each metric below covers one stage of that pipeline:
- PR throughput: The number of pull requests each engineer merges per week. Throughput responds to AI adoption before any other metric, and it responds most, which makes it a poor standalone measure of progress. A team can double its PR count and deliver the same value to customers.
- Cycle time: How long a change takes from first commit to merge. Coding accounts for a smaller share of that window than most leaders assume, which is why AI adoption can lift PR counts without touching cycle time. When both numbers diverge, the delay happens somewhere after the code gets written.
- Review burden: How much work reaches reviewers and how long they spend on it. Track time in review, PR size, comment counts, and rework rate as one group. Jellyfish research puts AI-assisted pull requests at roughly 18% larger than their human-written counterparts, which means reviewers absorb both more changes and bigger ones.
- Deployment frequency: How many times per week or per day your team deploys. This number connects everything upstream to customer value. When throughput climbs and deployment frequency holds steady, the additional code waits somewhere between merge and release.
- Change failure rate and revert rate: Two views of the same question, which is whether the code holds up. Change failure rate counts deployments that break something. Revert rate counts merged work that gets pulled back. Both increase slightly as AI adoption deepens, and the increase becomes a problem when it outpaces the throughput gain that caused it.
- Developer experience: Trust in AI-generated code, tool satisfaction, and time spent on rework, collected through surveys. Sentiment cannot tell you whether AI improved delivery, and it predicts whether adoption holds. Google’s 2025 DORA research found around 30% of technology professionals reporting little or no trust in AI-generated code.
- Time to merge: How long a pull request waits between “ready for review” and “merged.” AI shortens the work before this window and does nothing to the window itself, so it widens as more and larger PRs reach a review team of fixed size. Rising time to merge with rising throughput is the clearest sign that review became your constraint.
- Bugs per pull request: The defect count tied to each merged PR, measured through linked issues or post-merge fixes. Jellyfish found that AI adoption left bugs per PR roughly flat even as PR volume rose, which means the total defect load grows with output while the rate holds. Watch the trend, since a rate that starts climbing signals review no longer scales with the work.
Advice on where to start → Most teams cannot instrument all nine at once, and they do not need to. Start with PR throughput, cycle time, and change failure rate, the three DORA-adjacent metrics your tooling most likely already tracks. Bring in time to merge the moment throughput climbs, since that is when review pressure shows up. Hold developer experience surveys until you have a full quarter of delivery data, so you can test what developers report against what shipped.
Example → A platform team rolls out Cursor and watches PR throughput climb 30% in a quarter. Cycle time barely moves, so they plot time to merge and find it grew from two days to four. The extra code cleared the coding stage faster and waited longer in review, which told them to add reviewers rather than buy more licenses.
Hidden AI Adoption Signals Beyond Code Generation
Every metric so far reads AI through code, which means commits, PRs, and merges. None of them register when a developer uses AI for work that produces no code, and a large share of the value belongs to that work.
For example, an engineer who understands a strange service in twenty minutes instead of two hours moved faster than any commit will ever show. These signals stay hidden from source control, though most leave a trace somewhere:
- Debugging and root cause analysis: When something breaks, developers now ask AI to read the logs and point at the cause. The work is the diagnosis, not the code, so a two-line fix can represent an hour of saved effort. That effort shows up in AI tool logs and nowhere in source control.
- Codebase comprehension: Engineers use AI to make sense of unfamiliar services, dependencies, and data flows before they touch anything. This helps new hires and cross-team work most, and it produces no artifact at all. Chat and ask-mode session counts are the only place it appears.
- Requirements analysis: Before code exists, engineers use AI to sharpen a loose requirement into something buildable. The clearer the spec, the smoother the work that follows, and none of that clarity leaves a trace in source control. You learn about it by asking developers directly.
- Test creation: AI scaffolds tests, finds edge cases, and lifts coverage. Unlike the signals above, this one reaches the repository as commits to test files, so you can measure it by tracking AI-assisted changes to test directories rather than production code.
- Documentation: Developers use AI to write the documentation they would otherwise postpone, from change summaries to internal guides. Some of it reaches the repository as markdown and comments, so a partial signal exists. The larger benefit, the time readers save later, stays invisible.
- Code review support: Before a reviewer comments, AI can walk them through a PR, point at the risky parts, and propose fixes. Better feedback comes faster, and none of that improvement leaves a mark on the pull request itself. Only the reviewer knows it happened.
The trap is easy to fall into. Lines of code and accepted suggestions are simple to count, so teams report those and treat everything else as background.
That rewards the one kind of AI use a dashboard can see and ignores the six above, which pushes developers toward visible work over valuable work. Count what you can, and ask about the rest.
PRO TIP 💡: Most of the signals in this section never reach your Git history, which is exactly why code-based dashboards miss them. Jellyfish AI Impact reads usage from system signals across the tools your engineers use, so debugging sessions, chat activity, and agent work show up even when the resulting change is small. That gives you a fuller adoption picture than commit counts alone can produce.
Measure Adoption, Then Connect It to Impact with Jellyfish
Measure Adoption, Then Connect It to Impact with Jellyfish
Every section above measured AI from a different system. Adoption counts come from vendor consoles, delivery metrics come from source control, and the hidden signals come from surveys and tool logs. No one system holds all three, so the complete view exists only after someone stitches it together, and the stitching starts to date the day it ends.
Jellyfish AI Impact does the assembly for you. It reads adoption, spend, and delivery signals directly from the tools your engineers already use, then connects usage to throughput, quality, and cost across every AI product in your stack.
The platform organizes around the same progression this article followed, from whether developers adopt AI coding assistants to whether that adoption changed what you ship:
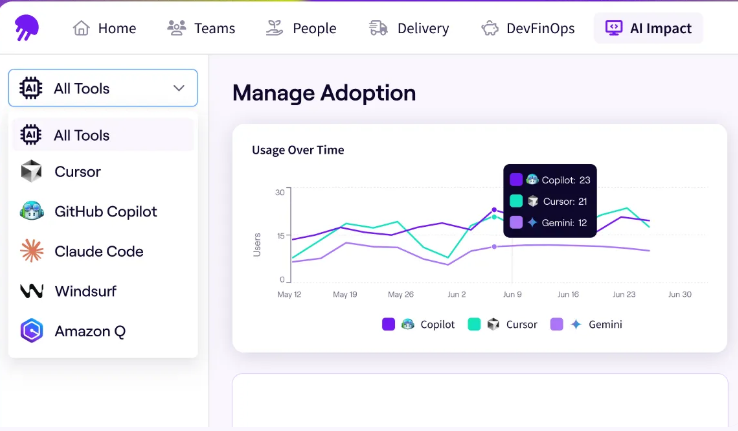
- Adoption insights: The platform reads adoption straight from the tools your engineers already use, so you see who works with AI, how often, and with which product, without asking anyone to self-report. Copilot, Cursor, Claude Code, and agentic tools all show up in a single view you can break down by team and repository.
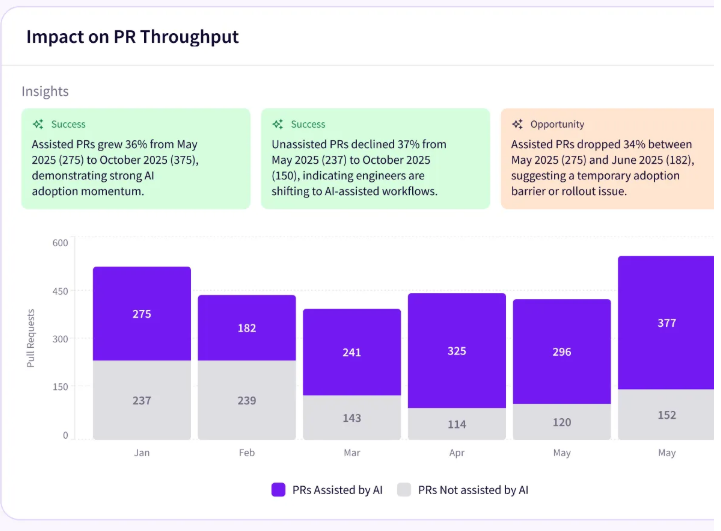
- Impact insights: Jellyfish connects how much your teams use AI to what ships, tracking throughput, cycle time, and quality against actual delivery data. That tells you whether higher adoption reached production or piled up in review, which is the exact question a seat count leaves open.
- Vendor comparison: Nearly half of engineering teams use two or more AI tools, and every vendor reports its own product in its own way. Jellyfish measures them all on one neutral model, which lets you compare Copilot against Cursor against Claude Code on the same terms.
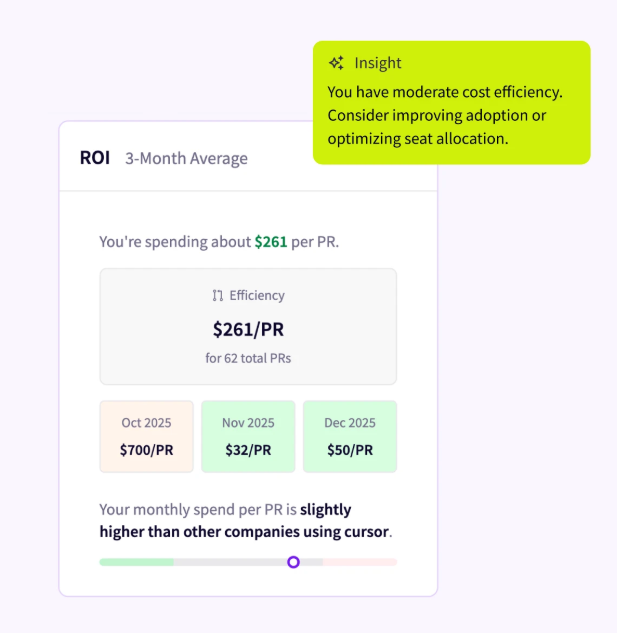
- Token and spend management: A seat license is only part of the bill now, because agentic tools bill by tokens and that number grows with adoption. The spend dashboard shows usage and cost by tool, team, and initiative, which connects every dollar to the work it supported.
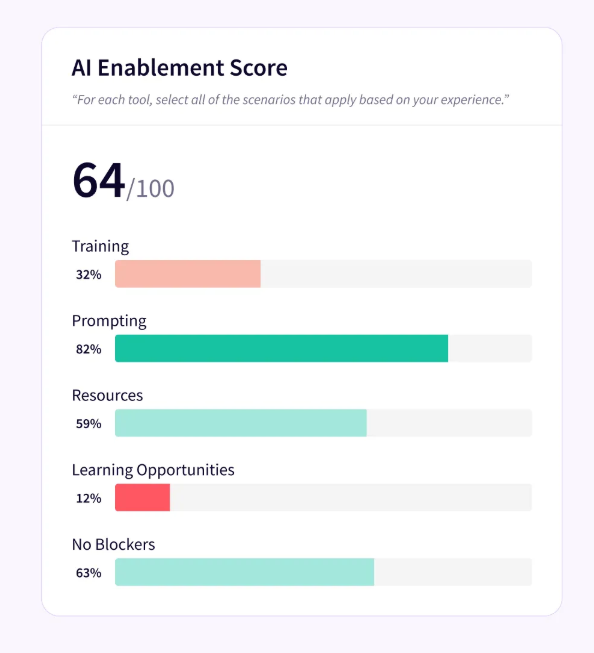
- Enablement insights: The platform points you to the engineers already getting the most from AI agents and the teams that never got going, then suggests where enablement will pay off. That solves the averages problem this article raised more than once, because a strong company-wide number always buries the teams furthest behind.
- Executive reporting: Jellyfish generates executive reports that combine usage, spend, and delivery metrics for a given team or time period. The reports connect AI activity to delivery outcomes, which supports ROI and budget discussions with sourced data rather than seat counts.
Adoption tells you AI reached your developers, and delivery data tells you whether it changed the work. Jellyfish AI Impact measures both from the tools your teams already use, without new tagging or manual setup.
Get an AI Impact demo to see where your organization stands.
FAQs
FAQs
What is the difference between AI adoption metrics and developer productivity?
AI adoption metrics count how many engineers use the tools and how often they reach for them.
Developer productivity covers what that usage produces once the code hits your pipeline.
A team can post a high suggestion acceptance rate and show no productivity improvement in delivery data, because acceptance measures interest and delivery measures output.
How do AI adoption metrics connect to DORA metrics?
DORA metrics measure delivery health through lead time for changes, deployment frequency, change failure rate, and incident rates.
Adoption comes earlier in the SDLC, so it moves first and the delivery numbers follow once the code clears review and release.
Watch both, because tight feedback loops between adoption and DORA data tell you whether AI-assisted code reached production or stalled in review.
How do you calculate return on investment for AI-assisted software development?
Start with a simple AI measurement framework that weighs cost against delivery. On the cost side, add up seat licenses and token spend.
On the value side, track throughput, cycle time, and quality signals like code churn and technical debt that show whether the extra output holds up.
About the author

Lauren is Senior Product Marketing Director at Jellyfish where she works closely with the product team to bring software engineering intelligence solutions to market. Prior to Jellyfish, Lauren served as Director of Product Marketing at Pluralsight.