In this article
Uplevel approaches engineering effectiveness from a different angle than most platforms in the space. Instead of pure delivery metrics, it examines how meetings, time allocation, and collaboration dynamics influence the way teams ship.
But while it’s a useful lens, the trade-offs can be hard to ignore. Limited integrations, a bare-bones API, and shallow capacity planning tools leave gaps that many teams simply can’t overlook.
If you’re weighing your options, this list breaks down 8 Uplevel alternatives, compared across features, pricing, and user reviews, so you can find the right fit for your team.
Why Look for an Alternative to Uplevel?
Why Look for an Alternative to Uplevel?
Uplevel has its strengths, but feedback on G2 and Reddit points to some common complaints that push teams to look elsewhere:
- Limited integration coverage: Uplevel supports a limited set of integrations, which leaves holes in your data if your team uses tools outside that list. If your team relies on niche or less common platforms, those blind spots add up fast. [Read Full G2 Review]
- Weak API support: The API is bare-bones, so if you want to export metrics or build automations around your engineering data, your options are limited. Teams that prefer to customize their reporting pipelines will hit a wall pretty quickly. [Read Full G2 Review]
- Shallow resource allocation features: Uplevel’s resource allocation tools lack the depth most engineering leaders need to plan ahead. You can see where people are right now, but there’s no way to model what happens next week or next sprint. [Read Full G2 Review]
- Invasive data access requirements: Uplevel needs broad access to your tools and data, which can feel intrusive, especially to individual contributors who worry about surveillance. The platform handles data securely, but the optics alone can slow down adoption. [Read Full G2 Review]
- Limited proactive reporting: You won’t get a weekly email that tells you how things are trending or what to focus on next. A simple automated summary each week would make the data far more actionable. [Read Full G2 Review]
Key Features and Functionalities to Look For in an Uplevel Alternative
Key Features and Functionalities to Look For in an Uplevel Alternative
The right alternative depends on where Uplevel falls short for your team. These are the features and capabilities worth weighing as you narrow down your list:
Integrations That Cover Your Full Engineering Stack
Most engineering teams run on a mix of tools – Jira, GitHub, CI/CD pipelines, Slack, calendars, and more. If your platform can’t pull data from all of them, the insights it gives you will be incomplete.
Uplevel’s integration coverage has gaps that users consistently mention on G2, so make sure any alternative you consider can connect across your full stack.
Resource Allocation with Forecasting and Scenario Planning
An alternative should let you model different allocation scenarios, forecast capacity constraints, and map engineering effort to business priorities before problems show up.
Uplevel’s allocation features are too shallow for the kind of forward-looking planning most engineering leaders need. Tools like Jellyfish offer scenario planners that let you stress-test your roadmap against actual capacity data.
A Flexible API for Custom Reporting and Automation
Uplevel’s API is limited, which makes it hard to export metrics or build workflows around your engineering data. A good alternative should offer a well-documented API that lets you pull any metric you need and push it wherever it needs to go.
This is especially important for larger orgs that don’t want to be locked into a single reporting interface.
AI Coding Tool Impact Measurement
AI coding tools are a major line item for most engineering orgs now, and you need data to back up that investment. That means tracking adoption across teams, measuring the impact on delivery and quality metrics, and comparing how different tools perform against each other.
Uplevel covers some of this ground, but Jellyfish goes much deeper with dedicated AI impact tracking that ties tool usage directly to outcomes.
Built-In DORA Metrics without Workarounds
If your team measures delivery performance through DORA metrics, your platform needs to handle them natively – deployment frequency, lead time, change failure rate, and MTTR, with the ability to slice by team, project, or sprint.
Uplevel handles the basics, but users say the implementation feels thin for teams that rely on these as core engineering KPIs. A strong alternative should treat DORA as a foundational feature, with enough depth to benchmark trends and spot regressions early.
Financial Reporting and R&D Cost Tracking
Not every engineering analytics platform covers the financial side, but for orgs that need to report on software capitalization or justify R&D investment, this is a make-or-break feature.
Uplevel doesn’t offer financial reporting tools, which means you’d need a separate system to handle audit-ready cost data.
Platforms with built-in DevFinOps capabilities can automate R&D cost tracking and tie engineering spend directly to business outcomes. That saves finance and engineering leaders hours of manual reconciliation every quarter.
Portfolio-Level Visibility Into Business Alignment
Uplevel tracks how development teams collaborate, but doesn’t connect that work to what the business is trying to achieve.
An alternative should let you see how engineering effort maps to roadmap priorities, track project delivery against timelines and budgets, and report on outcomes at the portfolio level.
Top Alternatives to Uplevel on the Market Right Now
Top Alternatives to Uplevel on the Market Right Now
To build this list, we researched each platform’s product pages and documentation, reviewed user feedback on G2, and compared pricing models across different tiers.
Here are the tools that stand out as the best Uplevel alternatives right now:
- Jellyfish
- LinearB
- Swarmia
- Sleuth
- Code Climate Velocity
- Allstacks
- Haystack
| Solution | Platform Type & Focus | Best For |
| Jellyfish | All-in-one software engineering intelligence platform covering resource allocation, capacity planning, delivery tracking, AI coding tool impact measurement, DevFinOps, and developer experience | Engineering leaders who are tired of stitching together point solutions and need one platform to plan, measure, and report on everything from staffing trade-offs to R&D cost capitalization |
| LinearB | AI-powered engineering productivity platform with PR workflow automation, AI code review, and delivery metrics | Teams that want to reduce cycle time through automated PR workflows |
| Swarmia | Developer productivity platform combining engineering metrics (DORA, SPACE) with investment tracking and developer experience surveys | Orgs that want to balance quantitative delivery data with qualitative developer feedback and team-level working agreements |
| Sleuth | Deploy-centric engineering platform with real-time release health monitoring | Teams with mature CI/CD pipelines who want DORA metrics anchored to actual deployment events |
| Code Climate Velocity | Software engineering intelligence platform with delivery metrics, AI-trained insights, and industry benchmarking | Engineering orgs that want to benchmark cycle time and deployment frequency against data from peer organizations |
| Allstacks | Enterprise engineering analytics platform with ML-powered predictive delivery forecasting | Leaders who need probability-based delivery timelines, automated risk detection, and engineering investment tracking across the full SDLC |
| Haystack | Lightweight, Y Combinator-backed DORA-first delivery analytics platform | Smaller teams that want a fast Git-native setup, automated sprint summaries, and PR bottleneck alerts without heavy configuration |
1. Jellyfish
Jellyfish is an all-in-one software engineering intelligence solution used by companies like DraftKings, Keller Williams, and Blue Yonder to understand how their engineering organizations build and deliver software.
The platform connects to your existing stack and covers the full scope of engineering intelligence – resource allocation, delivery tracking, capacity planning, AI coding tool impact, developer experience, and R&D cost reporting.
Where Uplevel focuses on team health signals like deep work time and meeting overload, Jellyfish takes a broader approach. And that makes it a stronger fit for engineering leaders who need to communicate impact to the C-suite and tie engineering investment directly to business results.
Key Features
- Patented resource allocation model: The platform’s patented allocation model shows where engineering time goes across priorities like product work, tech debt, and support. It does this by analyzing signals from your existing tools, so nobody has to fill out timesheets or tag tickets manually.
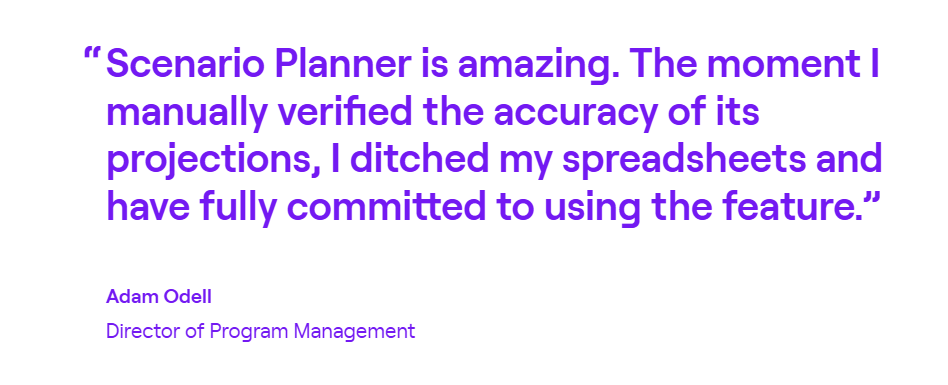
- Scenario Planner and Capacity Planner: Scenario Planner models different resourcing options side by side, while Capacity Planner surfaces how much bandwidth your teams have based on how they’ve performed in the past.
- AI Impact measurement: Jellyfish supports vendor-neutral AI impact tracking across the most widely used coding tools – Copilot, Cursor, Claude Code, Amazon Q, Windsurf, CodeRabbit, and more. You can see which tools your teams are using, how they affect throughput and quality, and whether the investment is paying off.
- DevFinOps and software capitalization: The platform handles software capitalization and R&D tax credit reporting by pulling data directly from engineering workflows. Finance gets the numbers they need without adding process burden to the engineering team.
- Developer experience surveys: The platform includes built-in developer experience surveys that bring qualitative feedback with quantitative delivery metrics. If your team reports friction with a specific tool or business process, you can cross-reference that with cycle time and throughput data to validate the issue.
Why Do Companies Choose Jellyfish Over Uplevel?
Uplevel gives you a useful read on how engineers spend their time – meeting load, deep work patterns, and collaboration habits. But teams that need more than behavioral insights tend to hit their limits fast.
Here’s where Jellyfish fills the gaps:
- Broader and deeper integration coverage: Uplevel supports a limited set of integrations, which leaves blind spots when your team uses tools outside that list. Jellyfish connects across the full SDLC, including Jira, GitHub, GitLab, CI/CD, plus HR and finance systems. [Read Full G2 Review]
- Forward-looking capacity planning: Uplevel shows current allocation, but can’t model what happens next. Jellyfish’s Scenario Planner and Capacity Planner let you test staffing trade-offs and forecast against real historical data before committing to a plan. [Read Full G2 Review]
- AI coding tool impact measurement: Uplevel covers some ground here, but Jellyfish offers dedicated, vendor-neutral AI impact tracking across tools like GitHub Copilot, Cursor, Claude Code, and Amazon Q. You can compare tools head-to-head, track adoption by team, and tie AI spend directly to delivery and quality outcomes. [Read Full G2 Review]
- Proactive alerts and reporting: One of the most common Uplevel complaints on G2 is the lack of proactive reporting. Jellyfish already does this with daily digests, Slack alerts on blocked tickets, and team pulse updates that reach stakeholders without anyone needing to open the platform. [Read Full G2 Review]
What Real Customers Are Saying about Jellyfish
Buildium suspected their engineers were spending too much time on low-priority work, but had no data to back it up. Jellyfish confirmed the problem and revealed that work was being miscategorized, skewing every metric they’d been reporting. Within three months, the team shifted 24% more resources to roadmap work, without hiring anyone new.
CHG Healthcare had 20 people spending four hours every week manually pulling data from Jira and GitHub just to track delivery progress. Jellyfish replaced that workflow entirely. The Scenario Planner caught a delivery risk two weeks into a sprint instead of a month in, saving $130,000 in overrun costs on a single project.
Salsify needed to automate R&D cost capitalization and get better data on how engineering time was being spent. Jellyfish handled both.
The capitalization output passed two external audits, and engineering directors now use allocation data to track how much each team spends on roadmap work versus bugs and maintenance, which directly informs headcount and investment decisions.
2. LinearB
LinearB is a delivery-focused engineering management platform that tracks how code flows from commit to production, with built-in automation to speed up PR workflows and reduce cycle time.
What makes LinearB popular is the combination of measurement and automation. You get the delivery metrics, but you also get PR automation, policy enforcement, and AI-powered code reviews to move the needle on those metrics.
LinearB is a more delivery-centric alternative to Uplevel. It trades the team health and collaboration lens for deeper coverage of cycle time, PR workflows, and deployment metrics.
Key Features
- Native DORA metrics with benchmarking: LinearB tracks all four DORA metrics out of the box and lets you benchmark your teams against industry data pulled from millions of pull requests. You can drill down by team, project, or time range to spot trends and regressions early.
- AI-powered PR workflow automation: The platform automates repetitive parts of the code review process, such as auto-assigning reviewers, labeling PRs, flagging AI-authored code for inspection, and applying merge policies.
- Developer coaching dashboard: The platform provides a holistic view of individual developer workflows, including knowledge area tracking, coding language distribution, and developer experience metrics.
Advantages
- Workflow automation saves engineering time: LinearB’s built-in automation handles tedious manual tasks in the PR and code review process, which frees up engineering hours that would otherwise go to repetitive overhead. [Read Full G2 Review]
- Data-rich without being overwhelming: Users say that the platform brings deep engineering insights without burying you in dashboards and raw data dumps. [Read Full G2 Review]
- Gives engineering leaders a common language with the business: LinearB makes delivery performance visible in a way that supports informed conversations, whether you’re talking to your direct reports about bottlenecks or presenting engineering health to the C-suite. [Read Full G2 Review]
Limitations
- Metric calculations can be opaque: It’s not always clear how LinearB arrives at certain numbers, which can slow you down during setup and make it harder to trust the data until you’ve invested time digging into the methodology. [Read Full G2 Review]
- Integrations could go deeper: The platform connects with the major tools, but some of those integrations feel surface-level when it comes to supporting end-to-end improvement workflows. [Read Full G2 Review]
- Limited business-level alignment out of the box: LinearB is strong on engineering delivery metrics, but tying those metrics back to broader company objectives and business outcomes takes extra work. [Read Full G2 Review]
Pricing
LinearB has two published pricing tiers:
- Essentials starts at $29/contributor/month and includes 1,000 automation credits
- Enterprise runs $59/contributor/month, bumps the credits to 1,500, and adds project forecasting, R&D cost capitalization, and resource allocation capabilities
Custom plans are available for bigger organizations, but you’ll need to contact sales to get a direct quote.
Learn more → 8 Best LinearB Alternatives Heading Into 2026
3. Swarmia
Swarmia is a developer productivity platform that combines engineering metrics (DORA, SPACE, and more) with investment tracking and developer experience surveys to give orgs a full picture of how they build and ship software.
Both platforms care about developer experience, but they approach it differently. Uplevel analyzes behavioral signals like deep work time and always-on patterns, while Swarmia combines quantitative delivery metrics with structured developer surveys.
Key Features
- Investment balance tracking: The platform shows where engineering time goes across planned work, bugs, technical debt, and unplanned tasks. This gives leaders a clear view of whether teams are spending their time on what the business prioritizes.
- DORA and SPACE metrics with working agreements: Swarmia tracks core engineering metrics like deployment frequency, cycle time, and change failure rate out of the box. It also goes a step further by letting teams set and optimize working agreements.
- Built-in developer experience surveys: You can collect developer feedback directly in the platform and correlate it with your engineering metrics. That way, you can see whether a dip in cycle time lines up with frustration about tooling, process changes, or workload.
Advantages
- Clear, actionable dashboards: The dashboards are built around trends, not spreadsheets of raw data. That makes it easy to have productive conversations about performance without anyone feeling like they’re being monitored at the individual level. [Read Full G2 Review]
- Weekly presets that keep developers aligned: Swarmia ships with a strong set of default goals and working agreements, so teams don’t have to spend weeks figuring out what to track. Developers get a clear sense of what to aim for each week. [Read Full G2 Review]
- Clean, user-friendly UI that gets out of your way: You don’t need a training session to get value out of Swarmia. The interface shows you what matters up front, and everything is laid out clearly enough that most teams can start using it productively within days. [Read Full G2 Review]
Limitations
- Limited customization for deployment tracking: Swarmia’s deployment tracking works well for standard setups, but falls short if your team relies on custom GitHub Actions to streamline deploys. [Read Full G2 Review]
- Notification controls lack granularity: There’s no way to set up notifications for individual contributors outside your own team. If you’re coaching someone on a different squad and want to know when they open a PR, Swarmia doesn’t support that kind of cross-team visibility yet. [Read Full G2 Review]
- No root cause visibility for slow PRs: The platform surfaces slow pull requests, but stops short of explaining why they’re slow. Without context on whether the bottleneck is review capacity, scope, or unclear specs, the insight only gets you halfway. [Read Full G2 Review]
Pricing
Small teams can get started for free with up to 9 developers. Paid plans start at €28/dev/month for one module of your choice, or €49/dev/month for the full platform that covers business outcomes, developer productivity, and developer experience.
Larger organizations can negotiate custom Enterprise pricing that includes on-prem deployment and volume discounts.
Learn more → 14 Best Swarmia Alternatives & Competitors on the Market Today
4. Sleuth
Sleuth is a delivery-focused engineering platform that tracks deployments across your DevOps toolchain and uses that data to measure DORA metrics, monitor release health, and automate deployment workflows.
Where Uplevel looks at how engineers spend their time and how collaboration habits affect output, Sleuth zeroes in on the deployment pipeline itself.
Key Features
- Real-time deployment tracking and health scores: Every deployment gets a health score based on data from your APM, error tracking, and incident management tools. You can see at a glance whether a release is healthy, ailing, or has caused an incident.
- Deploy-centric DORA metrics: Sleuth tracks all four DORA metrics by anchoring them to actual deployment events, not Git merges or ticket transitions.
- AI-powered review templates and metric summaries: Sleuth uses AI to generate summaries of your metrics, point out outliers, and score your team’s current status automatically.
Advantages
- Fast setup with immediately useful automations: Getting started takes minimal effort, and the built-in automations give developers fast feedback on how their workflows impact delivery metrics. [Read Full G2 Review]
- Slack-native reporting that drives daily action: Automated Slack reports drop before your standup with highlights like stale PRs and review bottlenecks, so the right topics come up without manual data pulls. [Read Full G2 Review]
- Intuitive concepts that match how teams work: Everything in Sleuth is organized in a way that clicks right away, and the team is hands-on when it comes to mapping the platform to how your org ships software. [Read Full G2 Review]
Limitations
- GitLab integration struggles with complex setups: Sleuth’s GitLab integration works fine for straightforward pipelines, but teams with more involved CI/CD configurations have reported issues getting it to work reliably. [Read Full G2 Review]
- Pricing can be a tough sell for smaller teams: The cost can be a barrier for smaller companies. If the budget is a constraint, Sleuth may be difficult to justify compared to cheaper alternatives. [Read Full G2 Review]
- Navigation and UX need polish: UX is Sleuth’s weak spot. It’s not always intuitive how to get to the view you need, and the interface changes often enough that you’re sometimes relearning the navigation. [Read Full G2 Review]
Pricing
Pricing starts at $35 per user per month on the Standard plan, which includes DORA metrics, automations, and integrations but limits you to 25 developers.
The Enterprise plan runs $45 per user per month and brings perks like SAML SSO, on-prem GitHub support, and a dedicated customer success manager.
5. Code Climate Velocity
Code Climate Velocity is an SEI platform that connects to your source control and issue tracking tools to measure delivery performance, benchmark teams against peers, and track how engineering investment maps to company priorities.
While both tools want to help engineering leaders make better decisions, they start from different places. Uplevel looks at how people work, while Velocity looks at what the work produces and how it maps to company priorities.
Key Features
- Delivery and capacity metrics with industry benchmarks: Velocity tracks core metrics like cycle time, PR throughput, and deployment frequency, and lets you benchmark your teams against data from thousands of engineering organizations.
- OKR and KPI tracking for engineering: You can set targeted objectives and key results tied to engineering performance, so teams can measure progress toward business goals and complex projects.
- AI-generated code tracking: Velocity tracks AI-generated code that reaches production and quantifies its impact on the development lifecycle.
Advantages
- Intuitive interface with minimal learning curve: The UI is clean and well-organized enough that most users can find what they need without reading documentation. [Read Full G2 Review]
- Transparent metrics that the whole team can see: Engineers can see their own stats alongside team-level data, which keeps productivity tracking That goes a long way toward building buy-in and avoiding the “Big Brother” perception. [Read Full G2 Review]
- Calendar-based coding activity view: The calendar view of coding activity makes it easy to spot patterns over time, such as periods of high output versus stretches where momentum drops. It’s a useful lens for managers looking to understand engagement trends without micromanaging. [Read Full G2 Review]
Limitations
- Integration stability can be hit or miss: Integrations don’t always hold up reliably, and when they break, you’re left with incomplete data until the issue gets resolved. [Read Full G2 Review]
- Assumes a standard Git workflow: The platform expects a fairly conventional PR workflow, so teams that handle Git differently may see skewed metrics. If your process doesn’t match Velocity’s assumptions, the numbers won’t always tell the full story. [Read Full G2 Review]
- Alert customization is too rigid: Custom alerts rely on global settings that are hard to fine-tune at a granular level. If you want targeted alerts for specific teams or scenarios, the current setup makes that more frustrating than it should be. [Read Full G2 Review]
Pricing
Pricing isn’t listed on the website, so you’ll have to go through sales to get a number. That said, there is a free tier available for teams of up to 20 developers, which lets you test the platform before committing.
6. Allstacks
Allstacks is an enterprise-focused engineering analytics platform that pulls data from across the SDLC (Git, Jira, CI/CD, and more) to forecast project timelines, track investments, and measure delivery performance.
Uplevel leans into the human side with burnout signals, meeting overload, and deep work patterns. Allstacks is more about engineering economics and delivery predictability, built for leaders who need to report upward on timelines and ROI.
Key Features
- Predictive delivery forecasting: The platform’s machine learning algorithm forecasts delivery dates based on how your team has performed in the past. You get probability-based timelines for everything from epics to individual stories.
- DORA and SPACE metrics with scorecards: Allstacks tracks DORA metrics alongside SPACE framework indicators and lets you build scorecards to measure team performance over time
- Engineering investment and allocation tracking: You get a clear breakdown of how engineering time splits across new features, maintenance, bug fixes, and unplanned work.
Advantages
- The predictive risk detection keeps projects on track: Users appreciate that the built-in risk detection points out potential project delays early, so you’re not finding out about problems after it’s too late. [Read Full G2 Review]
- Flexible, clear data presentation: The platform is highly customizable, and you can tailor what you see and how you see it. You pick the parameters, choose the visualization, and get a clean view that’s ready to share without extra formatting. [Read Full G2 Review]
- Replaces manual metric gathering with automated tracking: If your team has been stitching together engineering metrics manually across multiple tools, Allstacks replaces that entire workflow. It pulls and calculates the same numbers automatically, with less room for error. [Read Full G2 Review]
Limitations
- User management can be tedious: Onboarding new users and keeping team associations up to date requires more manual work than you’d expect. For companies with frequent team changes, this becomes a recurring admin headache. [Read Full G2 Review]
- Data syncs daily, not in real-time: Data refreshes happen on a daily cycle, which means there’s always some lag between what’s happening and what the platform shows. It’s fine for weekly reviews, but not ideal if you need up-to-the-minute accuracy. [Read Full G2 Review]
- No native sprint-level view: If your team plans around sprints, you’ll notice the lack of a built-in sprint view. You can get there by changing date ranges, but it’s an extra step that should be a default option. [Read Full G2 Review]
Pricing
There’s a free trial with no credit card connection required. Three paid tiers are available, all billed annually per contributor:
- Premium ($400/contributor/year): Up to 500 contributors, multitenant hosting, SSO, and onboarding assistance.
- Enterprise ($600/contributor/year): Single-tenant hosting, data export API, unlimited data retention, and a dedicated CSM.
- R&D Cap ($200/contributor/year): Automated software capitalization and audit-ready reports, nothing more.
7. Haystack
Haystack is a Y Combinator-backed delivery analytics platform that connects to Git and Jira to monitor DORA metrics, PR workflows, cycle time, and project progress.
Because of the lightweight design, the platform is particularly popular with teams that want a no-frills, DORA-first analytics tool they can deploy in days.c
Haystack is a leaner alternative to Uplevel. It skips the team health and collaboration analytics in favor of straightforward delivery metrics and bottleneck detection that you can act on immediately.
Key Features
- DORA metrics with trend visualization: Haystack tracks all four DORA metrics and presents them as visual trends over time, so it’s easier to spot regressions and measure the impact of process changes.
- Delivery Pulse automated reporting: The platform auto-generates release notes from commits and tickets, celebrates milestone achievements, and sends weekly sprint summaries.
- Bottleneck and risk detection: Haystack proactively outlines issues like stale pull requests, WIP overload, and long-lived branches before they cause delays. These alerts show up in Slack or email.
Advantages
- Smooth onboarding with hands-on guidance: Teams can use the platform with confidence from day one. Getting started is straightforward thanks to a precise, well-structured onboarding process. [Read Full G2 Review]
- Risk alerts that are easy to read and act on: The risk alerts are clear and to the point. You can understand what’s wrong and what needs attention in seconds. [Read Full G2 Review]
- Activity heatmap ties meetings and deployments to productivity: Haystack’s heatmap shows how meetings and deployment schedules overlap with productive coding time, making it easy to spot when your team’s calendar is working against them. [Read Full G2 Review]
Limitations
- Occasional bugs and performance issues: Users have run into functional bugs and performance hiccups, though the team has been responsive about fixing them. [Read Full G2 Review]
- Interface feels dated and can be slow: The interface feels a step behind more modern tools in the space. It works, but the experience could be smoother. [Read Full G2 Review]
- No Slack integration for notifications: Haystack doesn’t send notifications to Slack, which is a miss for teams that want alerts where they already work. You’ll need to rely on email or check the platform directly. [Read Full G2 Review]
Pricing
There’s a 14-day free trial to start. Paid pricing breaks down like this:
- Growth runs $20 per member per month for teams up to 100 engineers. You get unlimited alerts, a year of data history, and customer support via email, Slack, or an account specialist.
- Enterprise is custom-priced for larger orgs (100+) and includes everything in Growth plus on-prem options, custom integrations, dedicated support, and quarterly performance reviews.
How to Select the Right Uplevel Alternative for Your Needs
Each platform on this list has a different sweet spot, so here’s how to match your priorities to the right tool:
- If you need end-to-end engineering intelligence tied to business outcomes, Jellyfish is the most complete option on the list. It covers resource allocation, financial reporting, AI tool measurement, and portfolio-level visibility in one platform.
- If you want to combine hard delivery metrics with developer sentiment data, Swarmia is worth a close look. The built-in surveys and working agreements give you a more complete picture of team health.
- If delivery speed and PR workflow efficiency are your main concerns, LinearB gives you DORA metrics plus built-in automation to reduce cycle time.
- If deployment monitoring and release health drive your decisions, Sleuth anchors everything to actual deploy events. It’s a strong fit for teams with mature CI/CD pipelines, though it stays narrow — Jellyfish offers broader deployment visibility as part of a wider engineering intelligence platform.
- If you want to see how your teams compare to the industry, Code Climate Velocity benchmarks your metrics against thousands of engineering organizations. Jellyfish offers its own benchmarking capabilities while going deeper into investment tracking and resource planning.
- If predictive project timelines are what you’re after, Allstacks forecasts delivery dates using historical team data. The forecasting is solid, but Jellyfish offers comparable planning capabilities alongside financial reporting, AI tool tracking, and portfolio-level visibility.
- If simplicity and speed are what matter most, Haystack is the lightest tool on this list. It gets you DORA metrics and bottleneck alerts fast, though Jellyfish covers those same fundamentals with significantly more depth for teams that need it.
There’s no shortage of alternatives to Uplevel, but most of them only cover a slice of what engineering leaders need.
On the other hand, Jellyfish brings engineering metrics, business alignment, financial reporting, and capacity planning under one roof.
If you’re looking for a single platform to replace Uplevel without trading one set of gaps for another, it’s the safest starting point.
Jellyfish – The Ideal Uplevel Alternative
Jellyfish – The Ideal Uplevel Alternative
Jellyfish is the broadest alternative to Uplevel because it spans delivery, planning, AI measurement, financial reporting, and developer experience without needing a second tool to fill the gaps.
Hundreds of engineering organizations rely on it today, from mid-market teams to enterprises like DraftKings and Blue Yonder.
Here’s a quick recap of what the platform covers:
- A patented allocation model that maps engineering activities to business priorities without any manual time tracking
- Scenario Planner and Capacity Planner that let you model staffing trade-offs and forecast against historical data
- Vendor-neutral AI impact tracking across Copilot, Cursor, Claude Code, Amazon Q, Windsurf, and more
- Developer experience surveys that pair engineer sentiment with system-level performance data
- Automated R&D cost reporting and software capitalization with audit-ready output
The right Uplevel alternative should close gaps, not open new ones. Jellyfish covers more ground than any other platform in the space, and the fastest way to see how it fits your team is to book a demo.
FAQs
FAQs
Can engineering intelligence platforms replace project management tools like Trello or Excel?
Not exactly. Platforms like Jellyfish, LinearB, and Swarmia are built to measure engineering performance, not manage individual tasks. They sit on top of your project management stack and pull data from tools like Jira, GitHub, and CI/CD pipelines.
If your team uses Trello for sprint planning or Excel for manual reporting, an engineering intelligence platform can automate the metric-gathering side, but it won’t replace the day-to-day task tracking those tools handle.
Do any Uplevel alternatives integrate with ecommerce, CRM, or social media tools?
Engineering intelligence platforms are purpose-built for the software development lifecycle, so direct integrations with ecommerce platforms, customer relationship management systems, or social media tools aren’t standard.
About the author
Jellyfish is the leading Software Engineering Intelligence Platform, helping more than 700 companies including DraftKings, Keller Williams and Blue Yonder, leverage AI to transform how they build software. By turning fragmented data into context-rich guidance, Jellyfish enables better decision-making across AI adoption, planning, developer experience and delivery so R&D teams can deliver stronger business outcomes.