In this article
The gap between DevOps adoption and DevOps results usually comes down to how organizations approach implementation.
And many treat it as a software purchase. They buy Jenkins, Docker, and Git, automate a few steps, and assume the transformation will follow.
But without changes to the underlying development process, these tools produce small pockets of automation with little impact on delivery speed or system reliability.
The Atlassian DevOps Trends Survey found that 85% of organizations run into obstacles during DevOps implementation. Skill gaps (37%) and cultural resistance (35%) come up most often.
A successful DevOps implementation is a strategic and cultural overhaul. It replaces manual workflows with end-to-end automation, aligns dev and ops around shared goals, and rebuilds the delivery pipeline. The payoff is faster releases, leaner operations, and a scalable production environment.
This guide breaks down the main DevOps implementation challenges and the steps engineering leaders take to overcome them.
Benefits of DevOps Implementation
Benefits of DevOps Implementation
The benefits of DevOps implementation reach far past engineering. The data points below cover what mature DevOps programs return on speed, cost, reliability, retention, and revenue:
- Lower operational costs: The same Atlassian survey from above also shows that DevOps teams spend 60% less time handling support cases and 33% more time on infrastructure improvements. Automation takes the manual work off the team’s plate, so engineering hours go toward higher-value projects.
- Stronger business performance: DORA’s 2019 Accelerate State of DevOps Report found that elite DevOps teams are twice as likely as low performers to meet or exceed their organizational performance goals across profitability, market share, productivity, and customer satisfaction. Software delivery performance and business performance move together.
- Faster time to market: Organizations using mature DevOps practices report a 200% rise in deployment frequency and a 50% fall in time-to-market, according to the Continuous Delivery Foundation’s State of CI/CD Report. Faster releases mean faster responses to customer demand and competitive moves.
- Fewer production failures: Per the 2024 DORA Accelerate State of DevOps Report, elite DevOps teams maintain a 5% change failure rate, compared to 40% for low performers. Stable releases mean less revenue lost to outages and fewer customer-impacting bugs in production.
- Better engineer retention: Organizations with a strong DevOps culture see a 60% higher rate of employee satisfaction compared to those without. Engineers stay longer in modern, automated environments, which keeps recruitment and ramp-up costs down.
Common Challenges When Implementing DevOps
Common Challenges When Implementing DevOps
The first and deepest challenge is cultural. Development and IT operations teams have spent years measuring against different goals, and those goals pull in opposite directions. Dev teams ship features and chase velocity, while ops teams keep systems stable and chase uptime.
When you put both groups on the same delivery pipeline without changing the incentives underneath, the tension shows up fast. And cultural resistance doesn’t even look like resistance. It looks like business as usual.
The signs are usually in the operational habits:
- KPIs that reward dev and ops for different outcomes
- Blame patterns when production breaks
- On-call rotations that ops owns alone
- Standups and retros where one side of the team is missing
The tooling problem is usually a downstream effect of the cultural one. Teams that operate in silos tend to buy in silos, and the result is a stack that no single group owns from end to end. Development standardizes on GitHub and Jira, operations builds its workflow around Datadog and PagerDuty, and security runs its own scanners on top of both.
Each decision makes sense at the team level, but the average DevOps toolchain ends up with 10.3 different tools, and integration becomes a constant operational headache.
Legacy architecture is the challenge most outside of leadership’s direct control. The constraints are built into the code itself, which makes them harder to handle than cultural patterns or tooling decisions.
CI/CD pipelines assume small, independent changes, while monolithic systems force large, tightly coupled ones, and DevOps process changes alone cannot close the distance between the two. CNCF data shows legacy architecture as a top barrier for 29% of organizations, with the number climbing higher in regulated industries.
Most rollouts run into all three of these challenges within the first year, and most struggle because they treat each one as a separate workstream. They are the same problem in different forms, and they have to be addressed together.
Quick self-check → Most stalled DevOps rollouts share the same warning signs. If three or more of the following are true at your org, the implementation is at risk:
|
How to Implement DevOps Successfully: Key Steps
How to Implement DevOps Successfully: Key Steps
The three challenges from the previous section all have counterparts in the work that follows. The step-by-step plan below covers each of these, in the order that works in practice:
Define Business Goals and Baseline Your Delivery Performance
Before any tooling or process work begins, engineering leaders need a clear set of business outcomes the rollout is meant to drive, along with a current-state measurement of how the team is delivering software today. The baseline anchors every improvement claim that follows.
What to measure at the start →
- The four DORA metrics (deployment frequency, lead time for changes, change failure rate, and failed deployment recovery time)
- Business KPIs the rollout is tied to, such as time-to-market for new features or customer-impacting incidents per quarter.
- Current toolchain inventory and ownership across development teams
- The team-to-team handoffs that cause the most delays, based on direct conversations with the people who run them
How to put it in motion → Assign a senior engineering manager to run a two-week assessment. They interview team leads, pull metrics from existing systems, and produce a one-page summary that becomes the reference point for every later decision. Leadership reviews and approves it before tooling work starts.
Example → An engineering team begins a rollout with a baseline showing 14-day lead times and 28% change failure rate. By month six, lead time drops to four days and failure rate to 12%. Without the baseline, the same numbers would have looked impressive but unmeasurable.
Build Shared Ownership Across Dev and Ops
Shared ownership has to be operational to mean anything. Dev and ops have to be measured against the same outcomes, paged for the same incidents, and rewarded for the same business results. Anything short of that recreates the silos under a new name.
What to measure at the start →
- Joint on-call rotations where developers respond to production incidents in code they own
- Shared delivery metrics across dev and ops, with the DORA four keys as the common baseline
- Blameless post-incident reviews with concrete action items attached to each one
- Cross-functional teams organized around services, with engineers from dev, ops, and security on each team
- Regular forums where dev and ops review the same dashboards together
How to put it in motion → Start with one team and a 90-day pilot. Move developers onto an existing ops on-call rotation, give the team shared OKRs tied to delivery and reliability metrics, and run weekly retrospectives that the whole team attends. Use the pilot’s results to make the case for broader rollout to leadership.
Example → An engineering org moves a payments team to a joint on-call after six months of high incident rates. Within a quarter, the developers who wrote the code are the ones taking the pages. Mean time to recovery drops from 4 hours to 35 minutes, and the team starts to address the root causes behind the recurring 3 a.m. pages.
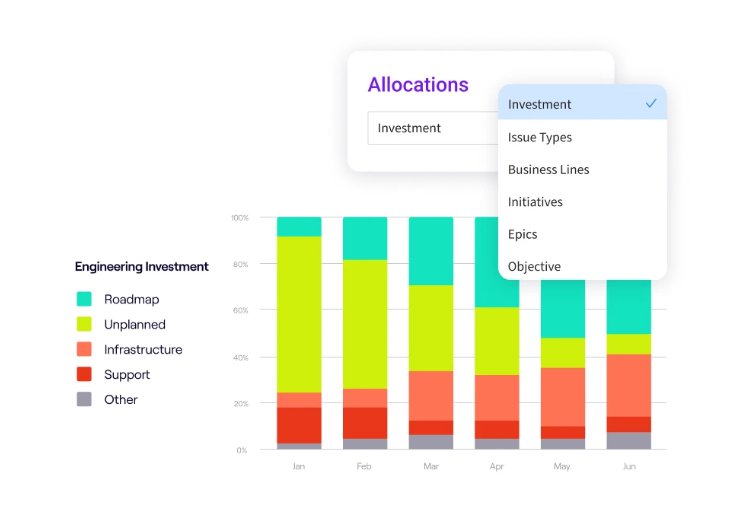
PRO TIP 💡: Resource Allocations shows whether shared ownership is holding up. Most engineering orgs claim the dev-ops divide is closed, but the time data often disagrees. The view splits team hours across DevOps work, product delivery, and operational support, so leaders see which parts of the change have stuck and which parts are still pending.
Automate the CI/CD Pipeline in the Right Order
A CI/CD pipeline is a series of automated checks that decide whether a code change is safe to release. The strength of the pipeline depends entirely on the strength of those checks, not on how fast it runs or how many tools are involved.
The work of building a pipeline is mostly the work of deciding what those checks should verify and how strict each one needs to be.
The right sequence to automate →
- Source control standards, including trunk-based software development processes, short-lived branches, and consistent commit conventions across teams.
- Continuous integration, where every commit triggers a build and runs against the test suite, with broken builds blocking the merge.
- Automated testing, covering unit tests for fast feedback, integration tests for confidence at the boundaries, and selective end-to-end tests for key user paths.
- Deployment automation, with scripted, repeatable software releases to staging and production, and rollback available as a one-command operation.
- Pipeline observability, tracking build times, test pass rates, and deployment frequency as first-class metrics.
How to put it in motion → Audit each stage of the pipeline for one service and find the weakest part. If test coverage is thin, deployment automation will not help. If source control is chaotic, no amount of pipeline tooling will compensate. Fix the foundation before moving up the stack, and use one service to model the full pipeline before the pattern scales across the org.
Example → A team that already runs Jenkins for CI tries to add automated deployment to production and ships three rollback-worthy releases in the first month. The team pauses the automation work, invests six weeks in expanding integration test coverage, then resumes the deployment work with a 4% failure rate instead of the original 22%.
| Quick note → Pick the second-most-important service for the pilot, not the first. Engineering leaders often choose either the highest-stakes service (too risky for early pipeline experiments) or the easiest one (the lessons do not generalize). The second-most-important service usually offers the right mix of production pressure and acceptable risk, which means the patterns built around it will scale to the rest of the stack. |
Standardize Infrastructure with IaC and Containerization
The point of IaC and containerization is making infrastructure as predictable, reviewable, and reversible as application code.
Once an environment can be torn down and recreated from a definition file, most of the operational problems engineering teams have worked around for years.
Where standardization matters most →
- Infrastructure as Code, with Terraform, Pulumi, or CloudFormation defining every environment so the same configuration produces the same result every time.
- Containerization, using Docker to package applications with their dependencies so they run identically across local, staging, and production environments.
- Orchestration, with Kubernetes or a managed equivalent handling deployment, scaling, and recovery without manual intervention.
- Environment parity, where staging mirrors production closely enough that bugs caught in staging would have shown up in production.
- Immutable deployments, replacing in-place updates with full environment rebuilds, so configuration drift becomes impossible.
How to put it in motion → Start by writing IaC for one environment and one service, then use that as the template for everything that follows. Containerize the same service in parallel, run it through the existing CI/CD pipeline, and confirm the deployment behaves the same in every environment. Once the pattern works for one service, expand to the rest of the stack and retire any manually-configured infrastructure on a defined timeline.
Example → A team running 40 microservices spends an average of three hours per incident tracking down environment differences between staging and production. After standardizing on Terraform and Docker across all services, the same incidents resolve in under 30 minutes because every environment is now reproducible from version-controlled definitions.
Integrate Security into the Pipeline from Day One
Security reviews are the most common bottleneck in release cycles at engineering orgs of any size. The work piles up because security teams cannot scale linearly with engineering headcount, and the obvious response is to fix the staffing ratio.
But the better response is to push the routine checking into the pipeline itself, which frees the security team to spend their time on work no scanner can do.
What integrated security looks like in practice →
- Static analysis in the CI pipeline, scanning code for common vulnerability patterns on every commit, and blocking merges when critical issues are found.
- Dependency scanning across all package managers in use, flagging vulnerable libraries and outdated versions before they reach production.
- Secrets detection as a pre-commit and CI check, preventing API keys, tokens, and credentials from being committed to source control.
- Container image scanning as part of the build process, catching vulnerabilities in base images and installed packages before deployment.
- Security as a shared responsibility, with engineers from the security team embedded in product teams rather than operating as a separate review function.
How to put it in motion → Pick one product team and embed a security engineer with them for 60 days. The engineer rolls out SAST, dependency scanning, and secrets detection in the pipeline, then writes the playbook that other teams will use to copy the setup.
Example → A fintech engineering org embeds a security engineer with one of its payments teams for 60 days. The pipeline finds dozens of previously unknown vulnerabilities in the first month, including several secrets accidentally committed to source control. Within a quarter, every product team is running the same setup.
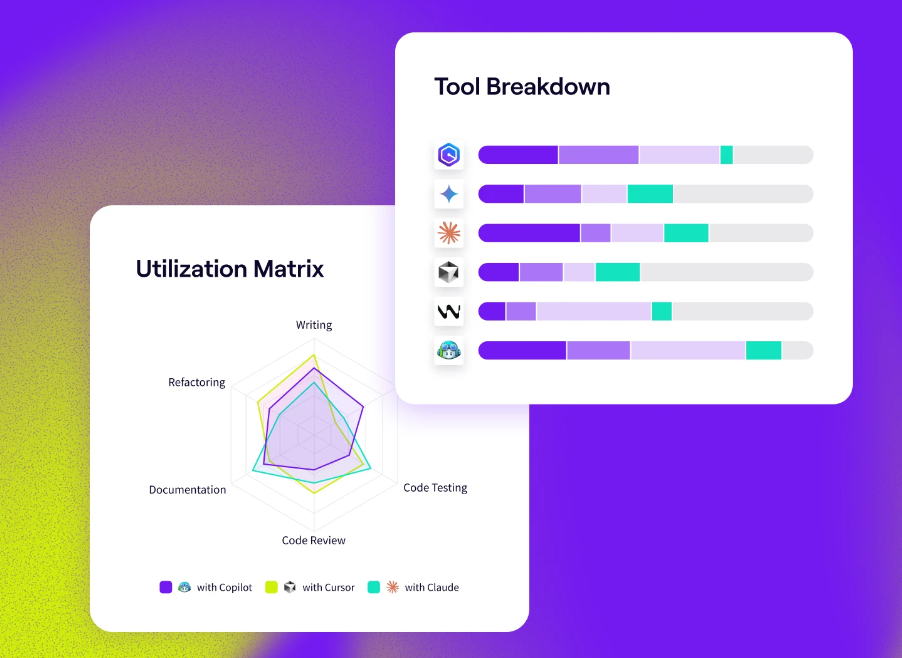
PRO TIP 💡: AI Impact gives leaders a clear read on whether AI coding tools are creating new risks. AI-generated code often pulls in unfamiliar dependencies and bypasses the review process that engineers use for their own work. AI Impact maps which tools are in use, how each one is performing, and where the output is affecting quality, so security and engineering teams catch problems before they hit production.
Measure, Monitor, and Review Against the DORA Metrics
The last step is setting up the measurement and review process. The DORA metrics give engineering leaders a clear way to see how delivery performance is trending, and a regular review of those numbers points to where the next round of work should go.
Without this step, the work from the earlier phases gradually loses ground without anyone noticing in time to respond.
What the feedback loop measures →
- The four DORA metrics, reviewed monthly by engineering leadership so deployment frequency, lead time, change failure rate, and recovery time stay top of mind.
- Observability across the stack, with metrics, logs, and traces giving teams enough information to debug issues and understand how systems behave in production.
- Pipeline health, including build times, test pass rates, and how often tests go flaky, so the delivery system itself gets the same attention as the code it runs.
- Business outcomes from step one, reviewed next to the engineering metrics so leadership can see both the technical and business sides of the rollout.
- Post-incident reviews, run as blameless retros with clear action items, so the same problems stop coming back.
How to put it in motion → Set up a monthly engineering performance review that covers the DORA metrics, business KPIs, and continuous improvement work in the same meeting. The job of the review is to decide what the engineering org takes on next, based on what the numbers point to. Run it as a decision-making meeting, not a status update, and walk out with one or two clear priorities each time.
Example → An engineering leadership team reviews DORA metrics monthly and notices lead time has crept up 30% over the past quarter. The review traces the cause to a flaky integration test suite that engineers have started bypassing, and the next month’s improvement work goes to stabilizing the tests. Lead time recovers within six weeks.
How to Measure the Success of Your Implementation Plan
How to Measure the Success of Your Implementation Plan
A DevOps implementation involves new tools, new processes, and changes that ripple across the engineering org. The leaders running it need to see how the work is going while it is still happening, so course corrections are still possible. Real-time data on the right metrics is what makes that possible.
Jellyfish gives engineering leaders that kind of view automatically. It connects to the tools your teams already use, including CI/CD systems, source control, and issue trackers, and shows a clear picture of how a DevOps strategy is progressing across the org.
Inside the platform, that visibility comes from a few core capabilities:
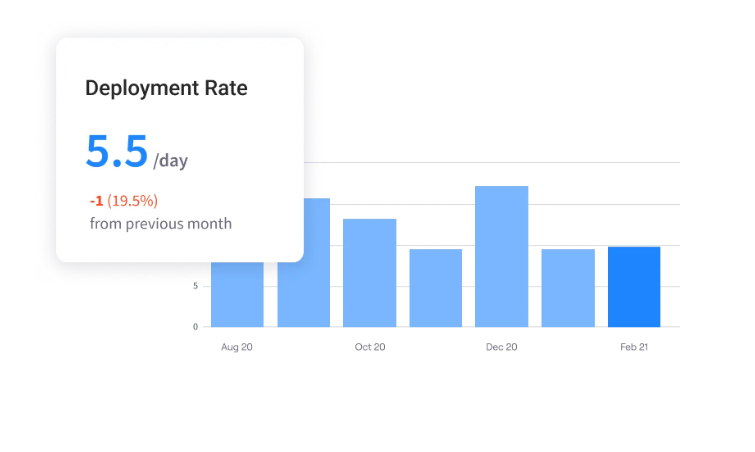
- DORA metrics dashboard: Jellyfish pulls deployment frequency, lead time, change failure rate, and recovery time directly from your CI/CD and incident management tools into one dashboard. The numbers update on their own, so engineering leaders see how delivery is trending without manual reports from developers.
- Cycle time reports: Detailed breakdowns show where code spends time across the development life cycle, from issue creation to production deploy. The team spots slow review stages, stuck handoffs, and outlier issues in one place, then optimizes them before delays pile up.
- AI Impact tracking: Usage and outcomes from AI coding tools like Copilot, Cursor, and Claude Code show up in a single view. The data answers whether AI investments are improving delivery or creating new bottlenecks that the team has to work around.
- Industry benchmark comparisons: Delivery performance gets compared against peers in the same industry. The comparison gives the team a reference point for whether the implementation is keeping pace with the market, which helps when the rollout needs to be defended to leadership.
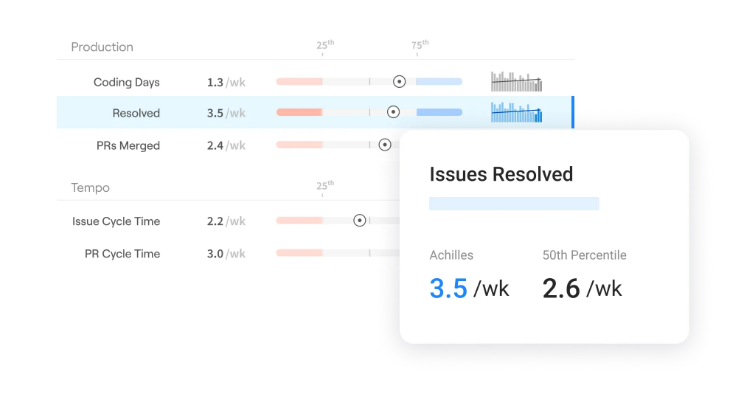
- Engineering allocation view: A clear breakdown shows how engineering time splits between the DevOps roadmap, feature work, and unplanned support. Managers can see exactly how much of the team’s capacity is going to the transformation, and where to rebalance when priorities shift.
When Jobber’s engineering team doubled in about a year, the company needed a way to keep tabs on DevOps performance as the organization grew. Jellyfish gave the team automated DORA metrics, clear allocation data, and a way to see where work was getting stuck.
One of those problems pointed to a deeper issue, and Jobber used the data to plan a major re-platforming project for their mobile app, which paid off in faster delivery and a better product experience.
Whether your DevOps implementation is just starting or already in motion, Jellyfish gives engineering leaders the data to keep it moving in the right direction.
Book a demo to see how the platform fits your team.
DevOps Implementation FAQs
DevOps Implementation FAQs
What is DevOps, and what are its core principles?
DevOps is a software delivery methodology that joins development and operations under one set of practices, tools, and goals. The DevOps approach replaces sequential handoffs with a single delivery pipeline that runs from commit to production.
The core DevOps principles are:
- Automation across build, test, and release, so code moves through the pipeline without manual gates.
- Version control as the single source of truth for application code, infrastructure definitions, and pipeline configurations.
- Continuous monitoring of production systems, so the team catches issues before customers do.
- Iterative release cycles, with small changes shipped often and reviewed against delivery metrics.
- Shared ownership of delivery speed and system reliability across dev and ops.
What are the first steps in a DevOps implementation plan?
The first steps in a DevOps implementation plan are:
- Define the business outcomes the rollout is meant to drive, such as faster time-to-market, fewer production incidents, or reduced unplanned work.
- Baseline your current delivery performance against the four DORA metrics (deployment frequency, lead time, change failure rate, recovery time).
- Map your current toolchain and ownership across CI/CD, source control, monitoring, and incident management.
- Point out the highest-friction handoffs between dev, ops, and security teams through conversations with the engineers who run them.
These four steps usually take two to three weeks and produce the baseline document and the rest of the implementation references.
Which tools are commonly used in a DevOps toolchain?
A standard DevOps toolchain covers source control, CI/CD, infrastructure, monitoring, and security, with one or two tools per layer:
- Source control: GitHub or GitLab for code, branches, and pull requests.
- CI/CD: Jenkins, CircleCI, GitHub Actions, or GitLab CI for build and release automation.
- Cloud and infrastructure: AWS, Microsoft Azure, or Google Cloud as the host environment, with Terraform, Pulumi, or Ansible for provisioning and configuration management.
- Containers and orchestration: Docker to package applications and Kubernetes to handle runtime, which together streamline deployments and improve scalability.
- Monitoring and observability: Prometheus for metrics, Grafana for dashboards, and Datadog or New Relic for full-stack monitoring.
- Security: Snyk, GitGuardian, and similar tools that run continuous monitoring across dependencies and secrets.
Most teams stick to one tool per layer. Integration overhead grows with every addition, and a smaller stack is easier to maintain.
How long does a successful DevOps implementation take?
A successful DevOps implementation usually takes 12 to 18 months in a mid-sized engineering team.
Larger teams with a lot of legacy architecture should plan for 24 months or more, because the architectural work takes longer than the cultural and tooling changes. After the first rollout is done, the team keeps refining things over time.
Why do DevOps implementations fail?
Most DevOps implementations fail for a few common reasons:
- Treating it as a tool purchase: Buying Jenkins, Docker, and Git without changing the software development lifecycle only automates parts of the work, and the bigger transformation never happens.
- Ignoring the cultural work: Dev and ops still answer to different KPIs, share no on-call burden, and rebuild the old silos within a quarter.
- Skipping measurement after launch: The rollout finishes, the team stops reviewing the metrics, and small regressions compound until everything slides back to where it started.
When implementations fail, it is usually a combination of two or three of these, not a single root cause.
What are the best metrics to track DevOps success?
The four DORA metrics are the most widely used way to measure DevOps success:
- Deployment frequency, or how often the team ships code to production.
- Lead time for changes, or how long a code change takes to go from commit to production.
- Change failure rate, or the percentage of deployments that cause an incident or rollback.
- Failed deployment recovery time, or how long the team takes to restore service after a failure.
Alongside DORA, the most useful supporting metrics are pipeline health (build times, test pass rates, and flaky test counts), engineering allocation (how time splits between the DevOps roadmap and other work), and the business KPIs the rollout is supposed to move.
About the author

Lauren is Senior Product Marketing Director at Jellyfish where she works closely with the product team to bring software engineering intelligence solutions to market. Prior to Jellyfish, Lauren served as Director of Product Marketing at Pluralsight.