In this article
Waydev markets itself as an AI-native engineering intelligence platform. You get DORA metrics, sprint analytics, DevEx surveys, investment tracking, and a conversational AI interface that launched in late 2025.
On paper, that’s a broad enough toolkit to compete with any software engineering intelligence platform. But breadth and depth aren’t the same thing, and users on G2 have mentioned some clear weak spots.
The onboarding process is more involved than most expect, and the AI capabilities that Waydev promotes haven’t fully matched their marketing for many users. The DevEx module is there, but it’s too thin to rely on, and if you need to look back more than a few months, the data history runs out fast.
Whether you’re moving off Waydev or still deciding if it’s the right pick, the alternatives in this guide are worth knowing about.
The alternative options below range from lightweight metrics tools to full-scale engineering intelligence platforms, and we compared each on features, pricing, and user feedback.
Why Look for an Alternative to Waydev?
Why Look for an Alternative to Waydev?
If you’re considering Waydev, these are the common pain points across G2 worth knowing about before you commit:
- DevEx module still feels raw: There’s a built-in survey tool for measuring developer experience, but users say it doesn’t go deep enough. You can’t customize the surveys to match your team’s context, and the results don’t give you much to act on. [Read Full G2 Review]
- Onboarding takes more effort than expected: Setting up Waydev means manually configuring your Git provider, connecting Jira with access tokens, and wiring up CI/CD tools one by one. Even technical users say the process dragged on longer than they planned for. [Read Full G2 Review]
- Feature overload without clear guidance: There’s no shortage of things you can do in Waydev, but figuring out where to start is its own challenge. Multiple reviewers say the complexity slowed down adoption in the early months. [Read Full G2 Review]
- AI insights lag behind the branding: Waydev markets itself as an AI-native platform, but reviewers say the AI features feel more like a lightweight add-on. Summaries load slowly and don’t surface much that you wouldn’t find on your own. The conversational AI module launched in late 2025 could change this, but user sentiment hasn’t caught up yet. [Read Full G2 Review]
- Data history depends on your plan: Waydev’s Pro tier only stores 6 months of data. You need Premium for 36 months or Enterprise for unlimited history. Reviewers who care about long-term trend analysis say the lower tiers don’t give them enough to work with. [Read Full G2 Review]
- No way to check metrics on the go: Waydev doesn’t offer a mobile app, and the platform isn’t optimized for mobile browsers either. If you need to glance at team performance outside of your desk, you’re waiting until you’re back at your computer. [Read Full G2 Review]
Key Features to Look For in a Waydev Alternative
Key Features to Look For in a Waydev Alternative
Based on where Waydev falls short and what G2 users say they wish they had, these are the capabilities worth paying attention to as you evaluate your options:
More Meaningful Developer Sentiment Data
Waydev’s DevEx surveys lack the depth and flexibility users expect, and the results don’t connect back to delivery or productivity metrics in a meaningful way.
The better approach is a platform where survey data and system data exist side by side, so you can see whether what engineers report feeling shows up in the numbers.
Data History That Doesn’t Depend on Your Plan Tier
Waydev’s Pro plan caps historical data at six months, and you need to upgrade to Premium for 36 months or Enterprise for unlimited retention. That’s a problem if your team tracks trends across quarters or compares performance year over year.
An alternative should give you enough historical depth to support long-term analysis without making it a paid upgrade.
Engineering-to-Business Alignment
Waydev tells you what your engineers are working on, but it doesn’t do much to connect that work to business outcomes. If leadership asks where engineering time is going and whether it’s aligned with company priorities, you’re left putting that story together yourself.
The alternative worth choosing is one with a resource allocation model that does that mapping for you automatically, and at a level of detail you can present to non-technical stakeholders.
Fast Setup and Historical Data Access
One of the most common complaints about Waydev is how long it takes to get everything connected. Between Git providers, Jira, and CI/CD tools, the setup process is hands-on and manual.
A good alternative should get you to usable insights relatively fast – ideally by backfilling months of historical data as soon as your tools are connected, so your team isn’t waiting weeks before the platform starts earning its keep.
Delivery Forecasting and What-If Modeling
If your team needs to model what happens when you shift headcount between projects, or forecast whether a delivery date is realistic given current capacity, that functionality doesn’t exist in the platform.
Scenario planning and capacity forecasting are features worth prioritizing, especially if you’re managing multiple deliverables at once and need to make resourcing decisions with real-time data behind them.
R&D Capitalization Without Manual Timesheets
Waydev includes basic project cost tracking, but it doesn’t get close to automated software capitalization reporting.
If your finance team needs audit-ready R&D cost data, and your engineers are currently filling out manual timesheets to make that happen, this is a feature category that can save both sides a lot of pain.
Look for platforms that pull engineering effort data directly from your tools and generate capitalization reports automatically.
Top Alternatives to Waydev on the Market Right Now
Top Alternatives to Waydev on the Market Right Now
Some of these tools overlap with Waydev on core SEI, others go deeper on planning, financial reporting, or code quality. A few take a completely different approach to engineering intelligence altogether.
For each one, we covered where it’s good at, the trade-offs, and the pricing so you can weigh them side by side:
- Jellyfish
- LinearB
- Haystack
- Logilica
- Swarmia
- Allstacks
- Appfire Flow
- DX (Atlassian)
- Code Climate Velocity
- Uplevel
- Typo
- Faros AI
- Axify
- Oobeya
| Solution | Key Differentiator | Best For | Pricing | Free Trial |
| Jellyfish | Only platform covering delivery, planning, DevEx, AI measurement, and DevFinOps together | Engineering orgs that need full coverage without combining multiple tools | Custom pricing | Demo available |
| LinearB | PR workflow automation with gitStream and AI-powered code review | Teams focused on fixing bottlenecks in the review and merge process | From $29/contributor/mo | Yes |
| Haystack | Modified DORA framework that swaps MTTR for bug resolution | Smaller teams that want clean delivery metrics with fast setup | From $20/member/mo | 14-day trial |
| Logilica | Full data warehouse access with custom queries and metrics | Teams that want to define their own KPIs and not rely on prebuilt dashboards | Contact sales | 14-day trial |
| Swarmia | Working agreements that let teams set and enforce their own process standards | Teams that want self-managed standards with Slack automation | Free under 10 devs, from €28/dev/mo | Yes |
| Allstacks | ML-based delivery forecasting with 35+ risk categories | Leaders who need early warning on delivery risks | From $400/contributor/yr | 30-day trial |
| Appfire Flow | Proprietary commit-level metrics like churn, risk, and efficiency scores | Teams that need granular code-level contributor visibility | From $38/user/mo | Demo available |
| DX | Largest DevEx benchmark dataset with 500+ company comparisons | Teams that prioritize developer sentiment over delivery metrics | Contact sales | Demo available |
| Code Climate Velocity | Built-in OKR and goal tracking tied to 60+ engineering metrics | Teams that align engineering performance to individual targets | Contact sales | Demo available |
| Uplevel | Deep work and burnout detection using calendar and chat signals | Orgs tracking meeting load and after-hours work alongside output | Contact sales | Demo available |
| Typo | AI-powered code review with AI-origin detection on PRs | Teams focused on code quality and static analysis | Free up to 5 devs, from $25/dev/mo | Yes |
| Faros AI | 100+ integrations with open-source connectors for custom toolchains | Large teams with fragmented or homegrown tool setups | From $29/contributor | Demo available |
| Axify | Daily morale tracking through Slack with value stream mapping | Process-driven teams that want flow data paired with sentiment | Free plan available, from $19/contributor/mo | Yes |
| Oobeya | On-prem and private cloud deployment with automated anti-pattern detection | Regulated industries that need compliance-ready hosting | Contact sales | Demo available |
1. Jellyfish
Jellyfish is a leading software engineering intelligence platform built to answer the full range of questions engineering leaders face – from delivery timelines and team health to resource allocation, AI tool ROI, and R&D cost reporting.
It has built one of the largest customer bases in the engineering intelligence space, with companies like Mastercard, Priceline, DraftKings, and Hootsuite on the roster.
The platform also holds the strongest engineering benchmarking dataset in the category, so the metrics you’re tracking are compared against industry data from hundreds of engineering organizations.
Compared to Waydev, Jellyfish is a more mature platform with a broader footprint, and that shows in both the depth of the product and the size of the benchmarking dataset behind it.
Key Features
- Patented work allocation model: At the core of Jellyfish is a patented allocation model that figures out who worked on what, and for how long, without asking engineers to tag anything manually. That’s what powers the platform’s resource allocation, cost tracking, and strategic alignment features.
- AI impact tracking: The platform tracks adoption, spend, and productivity impact across tools like Copilot, Cursor, Claude Code, and Amazon Q in a single vendor-neutral view. You can compare tools side by side and see which ones are making a measurable difference in delivery speed and code quality.
- Scenario Planner and Capacity Forecasting: You can model what happens if you shift headcount between projects, test different staffing scenarios, and forecast whether a delivery date is realistic given current capacity.
- DevFinOps and R&D cost reporting: Jellyfish pulls effort data directly from your engineering tools and generates audit-ready software capitalization reports. It’s SOC 1 Type II compliant, which makes it usable for finance teams who need numbers they can defend during an audit.
- Developer experience surveys: Jellyfish correlates survey responses with metrics like cycle time, deployment frequency, and sprint throughput. You can separate real friction from perceived friction and react accordingly.
Why Do Companies Choose Jellyfish Over Waydev?
Waydev is a capable metrics platform with a responsive support team. But when the job grows past metrics and reporting, Jellyfish has a few clear advantages:
- Planning forward vs. reporting backward: Waydev is primarily a reporting tool that tells you what happened. Jellyfish includes scenario planning and capacity forecasting, so you can model tradeoffs before committing to a roadmap and find delivery risks before they surprise your team. [Read Full G2 Review]
- Business alignment vs. activity tracking: Activity metrics are useful, but they don’t answer the questions that come up in leadership meetings. Waydev stays at the engineering layer, while Jellyfish connects that data to business outcomes through its allocation model. [Read Full G2 Review]
- Onboarding and time to value: Getting value from Waydev takes time – the integrations are manual, the onboarding is hands-on, and data needs to accumulate before the dashboards tell you much. Jellyfish shortens that ramp significantly by backfilling months of historical data as soon as your tools are connected. [Read Full G2 Review]
- Stronger AI tool measurement. Waydev tracks AI adoption at the surface level, but reviewers say the experience doesn’t live up to the AI-native branding. Jellyfish supports Copilot, Cursor, Claude Code, and others, then maps that data to delivery outcomes so leaders can measure ROI. [Read Full G2 Review]
- Designed for the whole engineering leadership stack: Waydev covers metrics and reporting well, but it doesn’t go much further. Jellyfish adds capacity planning, scenario modeling, investment allocation, and DevFinOps, so directors, VPs, and finance teams all get value from the same tool. [Read Full G2 Review]
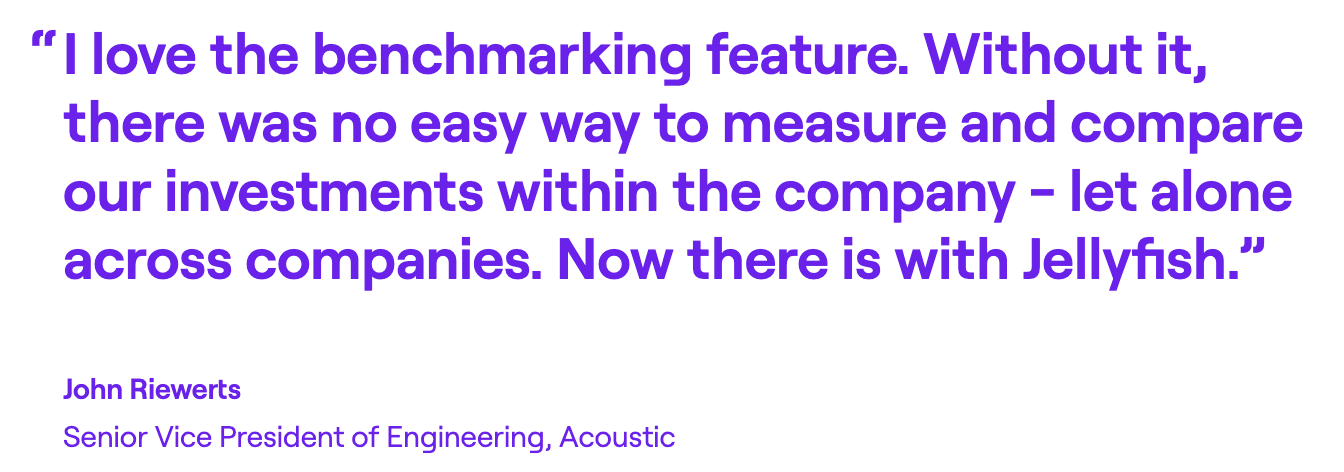
What Real Customers Are Saying about Jellyfish
Acoustic used Jellyfish benchmarks to find that support work was eating into roadmap delivery well above the industry average. They restructured around that data, brought in targeted contractors, and saw a 35% jump in delivery predictability and $80K in contractor savings.
Clari had no visibility into where engineering time was going, and delivery timelines were slipping. Jellyfish showed that maintenance work was pulling resources off the roadmap. On-time delivery rose from 67% to 79%, and software capitalization became 50% more efficient.
Five9 consolidated DevOps, Engineering, and Operations into a single org of 400+ engineers, but had no way to measure performance at that scale. Jellyfish let them break down sprint predictability, team by team, and put targeted improvement plans in place.
2. LinearB
LinearB is a delivery optimization platform for engineering teams that tracks DORA metrics, cycle time, and sprint health by pulling data from your Git repos, project management tools, and CI/CD systems.
Both platforms cover DORA metrics and delivery insights, but LinearB puts more emphasis on closing the loop between finding bottlenecks and then fixing them automatically. Waydev is more focused on reporting and smart dashboards.
Key Features
- gitStream PR automation: An open-source engine that auto-assigns reviewers, labels PRs, and sets up team-specific merge policies through YAML configurations across GitHub, GitLab, and Bitbucket.
- AI-powered code review: Scans PRs for security risks, bugs, and spec mismatches before human review. It also auto-generates PR descriptions to keep documentation consistent.
- DORA metrics with drill-down: Tracks deployment frequency, lead time, change failure rate, and MTTR, with drill-down from org-level trends to individual teams and PRs.
Advantages
- Granular, detailed metrics: The platform lets you drill into statistics at a level of detail that most SEI tools don’t offer. [Read Full G2 Review]
- Dedicated success management: LinearB pairs each customer with a success manager who learns your workflow and helps you get the most from the platform. [Read Full G2 Review]
- Consistent product development lifecycle: New features come out often enough that the platform feels like it’s actively improving. If you spot a gap during your trial, there’s a decent chance the team will address it in an upcoming release. [Read Full G2 Review]
Limitations
- No alerts for PRs missing test coverage: The platform doesn’t flag or automate around pull requests that ship without tests. If test coverage is part of your review process, you’ll need to handle that outside of LinearB. [Read Full G2 Review]
- Executive reporting needs work: The metrics go deep, but rolling that detail up into something a VP or CTO can digest quickly isn’t easy. A scorecard-style summary with built-in benchmarks would go a long way for engineering managers who need to report upward regularly. [Read Full G2 Review]
- Limited industry benchmarks across metrics: LinearB publishes strong benchmark data overall, but not every metric comes with an industry comparison. If benchmarking against external standards matters across your full reporting stack, you’ll find some gaps. [Read Full G2 Review]
Pricing
LinearB’s Essentials tier costs $29/month per contributor and covers AI impact measurement, code reviews, programmable workflows, and developer surveys, with 1,000 monthly credits included.
Enterprise comes in at $59/month per contributor and adds project forecasting, resource allocation, and R&D cost capitalization, with 1,500 credits per month.
Custom pricing is available for large-scale deployments.
Learn more → 8 Best LinearB Alternatives Heading Into 2026 – Jellyfish
3. Haystack
Haystack is a lightweight engineering analytics platform that pulls data from Git and Jira to give teams a focused view of delivery health through DORA metrics, cycle time breakdowns, and real-time alerts for bottlenecks and burnout risk.
Where Waydev tries to be a full SEI suite, Haystack focuses exclusively on DORA and delivery pipeline analytics with a leaner setup and a smaller learning curve.
Key Features
- Proactive Slack alerts: Haystack sends real-time notifications for stuck PRs, PRs merged without review, after-hours coding spikes, and rising cycle times, so managers catch problems before they compound.
- Automated delivery reporting: The Delivery Pulse feature auto-generates release notes, sprint summaries, and milestone progress reports.
- Actionable DORA metrics: Haystack offers its own take on DORA metrics by swapping change failure rate and MTTR for bug resolution, since most feature teams don’t own deployment infrastructure but do own how quickly they fix bugs.
Advantages
- Smooth onboarding with clear guidance: Users say the onboarding process walks you through every detail of the platform, so you understand what each metric means and how to use it. [Read Full G2 Review]
- Risk alerts that are easy to act on: The alerting system points out issues like stalled PRs or rising cycle times in a format that’s quick to read and doesn’t require going through dashboards to understand what went wrong. [Read Full G2 Review]
- Strong historical trend tracking: You can track how changed over time, whether you’re comparing the last sprint to the one before it or looking at a six-month trend to measure the business impact of a process change. [Read Full G2 Review]
Limitations
- Interface can slow down during key moments: Users report that the web interface slows down at times, which can be annoying when you’re trying to check metrics quickly between meetings or during standups. [Read Full G2 Review]
- Occasional bugs and performance issues: Some teams mention functional bugs and performance lag that pop up often enough to notice. [Read Full G2 Review]
- Not all metrics feel actionable: The platform tracks a lot, but some of the stats don’t come with enough context to help managers figure out what to do with them or how to translate them into team-level improvements. [Read Full G2 Review]
Pricing
Haystack’s Growth plan is priced at $20 per team member per month with an annual commitment and works for software engineering teams under 100 members.
Enterprise pricing is custom and has on-premise integrations, a dedicated performance specialist, and team training.
Both plans come with a 14-day free trial, no credit card required.
4. Logilica
Logilica is an AI-powered engineering productivity platform that automatically mines data from your Git repos, project boards, and build pipelines to give leaders a real-time view of delivery speed, team workload, review coverage, and process risks.
You start with standard velocity and flow metrics, but the platform scales into a fully customizable engineering data warehouse for teams that want to own their reporting.
Compared to Waydev, Logilica is built for development teams that want more control. It has the same key metrics around velocity, cycle time, and DORA, but comes with more flexibility to define custom KPIs and bring in external data.
Key Features
- Flow analytics with cycle time decomposition: Logilica breaks delivery flow into velocity, throughput, and risk pillars, and lets you drill from a high-level metric all the way down to the specific PR, deployment, or Jira ticket behind it.
- Burnout and overload detection: The platform flags after-hours coding patterns, uneven workload distribution, and developers carrying too many concurrent tasks, so managers can intervene before productivity drops and prevent burnout.
- DataStudio for custom metrics and dashboards: Enterprise users get a full embedded analytics environment where they can write custom queries, define new use cases, and build company-specific dashboards without relying on Logilica’s prebuilt views.
Advantages
- Deep customization: Unlike most tools in this category, Logilica gives you access to the underlying data warehouse, custom queries, and the ability to define your own metrics and dashboards.
- Open data platform: Logilica supports bring-your-own-data integrations through open APIs, which means you’re not locked into only the data sources the vendor decides to support.
- Enterprise-grade flexibility: It offers dedicated cloud instances, private infrastructure deployment, and full data access, which makes it viable for larger organizations with strict compliance or data residency needs.
Limitations
- Smaller community and ecosystem: Compared to more established platforms in this space, Logilica has a smaller customer base and less public documentation. That can mean fewer integrations, slower feature development, and less high-quality community knowledge to draw from.
- Might feel overwhelming at first: The platform offers deep customization and a full analytics layer, which is powerful for teams that need it. But for smaller teams just looking for standard engineering metrics out of the box, the breadth of options can bring unnecessary complexity.
- No AI coding tool tracking: Logilica doesn’t offer specialized tracking for tools like Copilot, Cursor, or other AI coding assistants. If measuring AI adoption and ROI is part of your evaluation criteria, that’s a gap.
Pricing
Logilica doesn’t list prices publicly, so you’ll need to talk to their sales team.
The Scale-Up plan covers growing teams with up to 50 repos and 3 years of data retention, and comes with a 14-day free trial. Enterprise has unlimited repos, on-prem connectors, and dedicated cloud instances.
5. Swarmia
Swarmia is an engineering intelligence platform that tracks DORA and SPACE metrics, monitors where engineering hours go, runs recurring developer experience surveys, and measures AI tool productivity impact.
Waydev and Swarmia both track engineering metrics, but Swarmia takes a more team-driven approach. Its working agreements let teams define their own standards, while Waydev relies on manager-facing dashboards.
Swarmia also comes with investment tracking, software capitalization, and AI coding tool measurement, which are areas where Waydev’s coverage is thinner or missing entirely.
Key Features
- Investment balance and initiative tracking: Swarmia categorizes engineering work into investment types like software development, technical debt, and maintenance.
- Working agreements: Teams set their own process standards like max PR review time or WIP limits, so Swarmia can monitor compliance automatically and send Slack nudges when agreements are broken.
- AI coding tool tracking: The platform detects which PRs were built with Copilot, Cursor, or Claude Code, then maps adoption trends, unused licenses, and the effect on cycle time and code quality across teams.
Advantages
- Quick and simple onboarding process: The trial experience gives you a clear sense of what the platform delivers before you commit to it, and users reported that the setup was quick and easy. [Read Full G2 Review]
- Clear, non-invasive dashboards: The UI keeps the focus on trajectory and team-level patterns. You see what’s improving and what’s stuck without converting it into a scorecard. [Read Full G2 Review]
- Built-in Slack automation: PR reviews, stale requests, and CI failures show up in Slack with enough context to act on them immediately. [Read Full G2 Review]
Limitations
- No incident-level recovery tracking: Swarmia tracks DORA metrics, but recovery time doesn’t connect to incidents. If your team needs that link, you’ll need a dedicated incident tool alongside it. [Read Full G2 Review]
- Performance lags with large datasets: The platform handles typical workloads fine, but larger teams report slowdowns when the data volume scales up. [Read Full G2 Review]
- Occasional data gaps in sprint views: Some features don’t always pull in everything they should. It’s not a constant issue, but it happens enough that you’ll want to sanity-check reports. [Read Full G2 Review]
Pricing
Teams under 10 developers can use Swarmia for free.
Paid plans start at €28 per developer per month for a single module, or €49 per developer per month for the full package covering business outcomes, productivity, and developer experience.
Enterprise pricing is negotiated separately and includes on-prem deployment.
Learn more → 14 Best Swarmia Alternatives (Updated for 2026)
6. Allstacks
Allstacks is an engineering intelligence platform built around predictive forecasting. It pulls data from your Git repos, issue trackers, and CI/CD tools, then uses ML models to project delivery date and track how development activities map to business priorities.
Waydev is built around activity tracking and developer productivity metrics, while Allstacks leans harder into forecasting and risk. Its ML-based forecasting estimates delivery dates and flags risks at the initiative level, which is a capability Waydev doesn’t have.
Key Features
- Proactive risk alerts: The platform categorizes delivery risks across 35+ types and sends real-time alerts when something threatens a timeline.
- Software capitalization reporting: The platform helps streamline R&D capitalization with accounting-ready reports pulled directly from developer tools.
- Intelligence Engine: An AI-native layer built on Allstacks’ proprietary semantic data fabric that runs exhaustive analysis across your engineering data and points out insights that would take teams weeks to compile.
Advantages
- Flexible custom dashboards: You can build dashboards around your team’s specific needs and tracking priorities. The platform doesn’t lock you into preset views or force a one-size-fits-all layout. [Read Full G2 Review]
- Responsive, hands-on support team: Several users mentioned that the support team is fast and helpful, both during onboarding and after. [Read Full G2 Review]
- Predictive risk detection: The platform’s forecasting flags what’s likely to go wrong next, so you can course-correct before timelines break. [Read Full G2 Review]
Limitations
- Data refreshes once per day: Updates happen on a daily cycle. That’s fine for weekly planning, but if you need to make informed decisions mid-sprint or react to something that changed this morning, you’re working off stale numbers. [Read Full G2 Review]
- Limited report and alert customization: The dashboards cover a lot of ground, but users report wanting more flexibility in how reports are structured and how alerts are configured. [Read Full G2 Review]
- Team-level filtering takes manual setup: Out of the box, Allstacks gives you a global view of your data. Setting up filtered views so each product team only sees their own area needs configuration work upfront. It doesn’t happen automatically based on your org structure. [Read Full G2 Review]
Pricing
Allstacks offers three plans, all billed annually per contributor.
- Premium at $400/year per contributor for up to 500 contributors, multitenant hosting, SSO/SAML, and limited CSM access.
- Enterprise at $600/year per contributor for 101+ contributors, single-tenant hosting, dedicated data ingestion IPs, VPN option, unlimited data retention, and a dedicated CSM.
- R&D Cap at $200/year per contributor as a standalone or bundled add-on for automated software capitalization reporting with SOC 1 certification.
There’s also a 30-day free trial available.
7. Appfire Flow
Appfire Flow (previously Pluralsight Flow) is a Git-native SEI platform that connects commit, PR, and ticket data to outline code-level productivity insights, DORA performance metrics, investment profiles, and workflow diagnostics.
Flow and Waydev overlap on DORA and cycle time reporting, but Flow is more focused on code-level metrics, while Waydev provides a broader coverage with DevEx surveys, AI copilot tracking, and custom dashboards.
Key Features
- Proprietary code-level metrics: Tracks churn, commit risk, impact scores, new work versus refactoring ratios, and efficiency ratings at the individual commit level.
- DORA metrics with business context: The platform monitors the core DORA metrics and pairs them with sprint movement, retrospective, and investment data so the numbers tell a more complete story.
- Cycle time decomposition: You can split cycle time into queue time, backflow, and rework to see exactly where delays come up in your development process.
Advantages
- Low friction for occasional users: You don’t need to use the platform daily to stay oriented. Users say they can find what they need fast, even if they only check in occasionally. [Read Full G2 Review]
- All-in-one developer profile pages: The player card gives managers one page with all relevant metrics for a developer, with date range controls that make it easy to zoom in on any period. [Read Full G2 Review]
- Surfaces under-the-radar contributions: Good at spotting contributors who do heavy lifting behind the scenes and finding performance dips that managers might otherwise miss. [Read Full G2 Review]
Limitations
- Limited report customization and export: Users can’t filter or customize reports the way they need to, and there’s no clean way to extract data for use outside the platform. [Read Full G2 Review]
- Occasional reliability issues: The platform can lag or behave inconsistently at times. It’s not a dealbreaker for teams that don’t need real-time data, but at this price point, users expect more stability. [Read Full G2 Review]
- Newer metrics feel underdeveloped: Features like Jitter and backflow come with useful concepts, but the current implementation and UI design don’t make them easy to interpret or act on. [Read Full G2 Review]
Pricing
Flow offers two plans, both billed annually per user. Core at $38/user/month covers unlimited repos, up to 36 months of data import.
Plus at $50/user/month adds team health insights, retrospective and sprint movement reports, investment profiling, check-in reports, and API access.
8. DX (Atlassian)
DX is a survey-first developer intelligence platform that connects qualitative developer feedback with software delivery data to measure team productivity through its proprietary Core 4 framework.
While Waydev covers more ground operationally, DX owns the developer experience measurement space with research-backed frameworks and benchmark data.
Key Features
- Developer Experience Index (DXI): Composite score built from 14 standardized survey items that’s benchmarkable against 500+ companies.
- Industry and peer benchmarking: Offers 80+ standardized measurements with segments by industry, role, and company size. APAC-adjusted variants account for regional differences in survey response patterns.
- Survey-to-system data bridging: The tool pairs developer feedback with delivery data from Git and Jira. When numbers change, leaders have the qualitative context to understand what happened.
Advantages
- Data-backed prioritization: Makes it easy to confirm whether process changes are helping or not, so dev teams can double down on what works and drop what doesn’t. [Read Full G2 Review]
- Ongoing visibility into team health: Running surveys on a regular cadence gives the leadership a running view of satisfaction, delivery health, and operational performance across cycles. [Read Full G2 Review]
- Lightweight, actionable insight loops: The snapshot format is fast for developers to fill out and gives managers useful, timely input they can act on right away. [Read Full G2 Review]
Limitations
- It’s not a replacement for direct observation: It takes time for teams to trust what the data represents, and leaders still need 1:1s, retros, and direct observation to get the full picture. [Read Full G2 Review]
- Light on follow-through recommendations: The platform flags pain points clearly, but doesn’t always show you what to do next. Users want more practical examples tied to the issues it points out. [Read Full G2 Review]
- Connector access tied to plan tiers: You’ll need to upgrade to a more expensive package if you want certain integrations, even if you’re only looking for one specific connector. [Read Full G2 Review]
Pricing
There’s no pricing information on its website. The platform uses modular, enterprise-focused pricing based on developer count and the features you need, so you’ll need to go through a demo to get a quote.
Learn more → 12 Best GetDX Alternatives for Engineering Teams Heading Into 2026
9. Code Climate Velocity
Code Climate Velocity is an engineering intelligence platform that measures delivery performance, code quality patterns, and team productivity across 60+ metrics.
Waydev and Code Climate Velocity overlap on core metrics like DORA and cycle time, but Velocity leans harder into granular code-level analytics like PR size, review cycles, collaboration patterns, and code churn.
Where Waydev tries to be broader (surveys, AI agents, planning tools), Velocity focuses on giving engineering managers a deep, detailed view of how code moves through the pipeline.
Key Features
- 60+ engineering metrics and custom reporting: The Analytics module lets you explore relationships between metrics, build custom reports, and track team performance on cycle time, throughput, code quality, and more.
- Targets and goal tracking: Managers can set OKRs and KPIs based on core Velocity metrics, then visualize how teams progress over time.
- Team360 and Developer360 profiles: Team360 shows sprint-level activity, risk, and throughput. Developer360 gives managers individual contributor views with performance trends and skills breakdowns for coaching conversations.
Advantages
- Cross-repo application views: You can link multiple repositories that belong to the same application together to get a complete picture of activity. [Read Full G2 Review]
- Easy drill-downs into productivity data: The interface is straightforward to navigate and makes it simple to go from high-level metrics to granular detail without a learning curve. [Read Full G2 Review]
- Transparent metrics for the whole team: All engineers can see the same stats managers use to evaluate productivity, which builds trust and keeps performance conversations grounded. [Read Full G2 Review]
Limitations
- Slow and inconsistent support: Users report delayed responses and support reps that don’t always understand the issue that’s being raised. [Read Full G2 Review]
- One outlier can mess up your data: A single PR that deviates from the standard process can throw off results, and there’s limited ability to clean up data after the fact. [Read Full G2 Review]
- API returns incomplete data: Users have run into gaps when pulling data through the API. In one specific case, a team endpoint came back with only 90% of the expected records. [Read Full G2 Review]
Pricing
Code Climate Velocity doesn’t publish pricing on its website, after moving to an enterprise-only model in 2024. So you’ll need to go through a demo to get a quote.
Third-party sources list paid plans starting around $449/year per contributor, but those figures may not be accurate anymore.
10. Uplevel
Uplevel is an engineering management platform that measures developer productivity and team health by combining delivery metrics with signals from calendars and chat tools.
By pulling data from calendars and Slack alongside Git and Jira, Uplevel finds things like meeting overload, chat interruptions, and after-hours work patterns that Waydev doesn’t measure.
The tradeoff is a narrower platform – Uplevel’s DORA coverage is partial, and it doesn’t offer code quality tracking or the breadth of delivery metrics Waydev provides.
Key Features
- Deep work measurement: ML models analyze calendar, chat, and Git data to estimate how much uninterrupted focus time developers get. Slack and Teams interruptions are detected and deducted from the total automatically.
- Burnout and “Always On” detection: Categorizes after-hours work into risk tiers so managers can spot who’s regularly working evenings and weekends. It acts as an early warning system before developers potentially burn out.
- AI tool adoption and impact tracking: Tracks which AI tools each team prefers, how much they rely on them, and whether that usage shows up in delivery and quality improvements.
Advantages
- Support that acts like an extension of your team: Users report a partnership-style experience where the team helps with onboarding, metric interpretation, and change management. [Read Full G2 Review]
- Engaged and flexible product team: Uplevel is responsive to feedback and willing to make changes when users ask for them. [Read Full G2 Review]
- Reliable data pipeline: It sounds basic, but a lot of platforms stumble here. Teams report that Uplevel’s data is consistently available and up to date when they need it. [Read Full G2 Review]
Limitations
- Limited integration coverage: Some tools that teams rely on daily aren’t supported. That can leave blind spots in the data, especially for companies with less common toolchains. [Read Full G2 Review]
- Meeting data can be misleading: Calendar entries don’t always reflect reality. Meetings that are mandatory but routinely skipped or attended passively still show up as collaboration time, which can mess up the stats. [Read Full G2 Review]
- Hard to turn metrics into action: Users say the platform collects useful data but doesn’t always present it in a way that leads to clear insights or concrete next steps. [Read Full G2 Review]
Pricing
Uplevel doesn’t publish pricing on its website. The platform is enterprise-focused, and you’ll need to schedule a demo to get a quote.
11. Typo
Typo is an engineering intelligence platform that pairs SDLC analytics with AI-powered code review. It tracks DORA metrics, cycle time, and investment distribution, then brings automated PR reviews that outline risky patterns and recommend fixes.
Compared to Waydev, Typo gives you a built-in code review engine and AI-origin detection, but doesn’t match Waydev’s depth in custom dashboards or resource planning.
Typo is also priced more aggressively (free tier for up to 10 devs, paid plans from $16/dev/mo), so it’s more accessible for smaller teams. Waydev targets larger organizations with broader feature coverage.
Key Features
- AI-powered code review (CodeIQ): Typo can review PRs on its own, using a combination of static analysis and LLM-based review. It also keeps tabs on how much of your codebase comes from AI coding tools and how often that code needs rework after review.
- Developer experience and burnout detection: Teams can find potential burnout zones based on activity signals. It also includes DevEx surveys to combine quantitative data with direct feedback from engineers.
- AI coding tool adoption tracking: Measures how tools like Copilot and Cursor are being used across teams and what effect they have on velocity and quality.
Advantages
- Intuitive with solid analytics depth: The interface is easy to pick up, and reviewers say the range of available analyses keeps it useful well past onboarding. [Read Full G2 Review]
- Automated reviews with real signal: Users report that Typo’s AI points out meaningful issues during PR review, and that the fix suggestions are specific enough to act on. [Read Full G2 Review]
- Shared Slack channel with the support team: Typo sets up a direct Slack channel with each customer for real-time help. It’s closer to working with a partner than filing tickets into a queue. [Read Full G2 Review]
Limitations
- Repo scanning is slow: Initial scans take longer than expected, and the wait for clearance can hold up onboarding for larger codebases. [Read Full G2 Review]
- Work log needs more from Jira: Users want the work log to pull richer data from Jira boards so they can cross-reference task details against actual commits. Right now, the connection is too shallow. [Read Full G2 Review]
- Enabled repositories don’t always connect: Enabled repositories sometimes stop syncing without warning, and there’s no clear indicator that data has stopped flowing. [Read Full G2 Review]
Pricing
Typo has 4 pricing tiers available, and you can save 20% if you opt for annual billing:
- Free: Up to 5 contributors with DORA metrics, PR insights, and 3 months of data history.
- Starter: $25/dev/month. Adds sprint insights, investment distribution, DevEx/burnout signals, and unlimited repos.
- Pro: $35/dev/month. Adds automated PR reviews, AI code fixes, code health analysis, and unlimited data history.
- Enterprise: Custom pricing. Includes on-prem support, multi-org Git setups, and a dedicated success manager.
12. Faros AI
Faros AI is a data-first engineering intelligence platform that links 100+ engineering tools into a unified data model and has an AI module on top for insights, root cause analysis, and team-level recommendations.
Where Waydev works with a fixed set of supported integrations, Faros connects to 100+ tools and uses open-source connectors that let teams plug in homegrown systems.
That makes it stronger for large, complex organizations with fragmented toolchains. The compromise is a steeper learning curve and a much heavier setup.
Key Features
- Modular intelligence packages: Instead of buying the whole platform upfront, you can pick the modules you need at first, and then add more over time.
- Centralized data model across 100+ integrations: Faros pulls data from your Git repos, issue trackers, incident tools, calendars, chat apps, and HR systems, and then links it all into one model. Teams don’t need to standardize their workflows first, and open-source connectors let you plug in homegrown tools that other platforms don’t support natively.
- Custom metrics, dashboards, and reporting: Teams can define their own metrics, build custom dashboards, and set up reports for recurring planning cadences or one-off deep dives.
Advantages
- Handles the hard parts for you: The platform takes care of the data integration and correlation logic that would take most orgs months to build on their own. Reviewers say this alone removes a major barrier to getting started. [Read Full G2 Review]
- Strong visualization and alerting options: Dashboards, filters, and alert workflows are all customizable. Once you build a query, you can automate the reporting around it so you’re not repeating the same steps every week. [Read Full G2 Review]
- Great support when you need it: The platform isn’t the simplest to pick up, and the support team knows that. Users say they’re quick to respond and proactive about helping you get past the early friction. [Read Full G2 Review]
Limitations
- Initial setup is not easy: Setting up the platform takes time, especially when you’re mapping your company structure across multiple levels. [Read Full G2 Review]
- Not fully self-serve yet: Users who wanted to build dashboards and reports without help found the platform needed more guidance than expected. [Read Full G2 Review]
- Slow dashboard loads on bigger datasets: Performance is fine most of the time, but teams mention occasional lag when dashboards pull in heavier data. [Read Full G2 Review]
Pricing
Faros AI doesn’t publish detailed pricing on its website. Plans start at $29 per contributor and scale across three tiers, but you’ll need to go through a demo to get specific numbers for your business.
Learn more → 8 Faros AI Competitors & Alternatives for 2026
13. Axify
Axify is a software engineering intelligence platform built around value stream mapping, DORA metrics, and delivery forecasting. It pulls data from your existing dev tools to show where work flows smoothly and where it stalls.
The platform takes a narrower, more process-oriented approach than Waydev. Its value stream mapping shows work moving through each SDLC phase, and its well-being tracker measures team health across resilience, motivation, inclusion, safety, and alignment.
Key Features
- End-to-end value stream mapping: Axify visualizes your full delivery process from idea to production, with a clear view of where work stalls and how long each stage takes.
- Daily team morale tracking: Sends short questions to developers through Slack every day and builds a rolling picture of sentiment over time. The first report takes two weeks to generate, so there’s enough data to protect anonymity and give an accurate read.
- OKR tracking and goals: Teams can set objectives tied to engineering metrics and track progress over time. It connects improvement goals to the data Axify already collects, so you’re measuring against real output instead of self-reported updates.
Advantages
- Hands-on support during setup: The support team is responsive and involved from the start, especially when it comes to getting integrations connected and dashboards configured. [Read Full G2 Review]
- Up and running without the ramp-up: Axify is one of the easier platforms to get off the ground. There’s no lengthy configuration phase before you start seeing useful data. [Read Full G2 Review]
- Ideal for process-driven teams: The platform works well for teams that follow Agile or Scrum closely. The value stream and sprint-level views give you data that maps directly to how those teams operate. [Read Full G2 Review]
Limitations
- Metric calculations aren’t always clear: Some users find it hard to tell exactly how certain results are calculated. Without that transparency, it’s tough to know whether you’re reading the data correctly. [Read Full G2 Review]
- UI polish lags behind the functionality: Axify delivers on the data side, but the interface itself has room to grow. There are small usability issues that don’t block workflows but create friction when you’re in the platform daily. [Read Full G2 Review]
- Steeper curve past the basics: The core metrics and dashboards are easy to pick up, but the deeper functionality (such as value stream mapping and custom configurations) takes effort before teams feel confident using it. [Read Full G2 Review]
Pricing
Axify has a free plan for one team and one project, which includes all features from both modules. Paid plans are billed per contributor per month.
- Free: One team, one project, full access to both the Accelerate and AI Impact modules.
- Accelerate ($19/contributor/month): Unlimited teams, up to 10 projects, value stream mapping, DORA metrics, sprint tracking, and AI insights.
- AI Impact ($19/contributor/month): Unlimited teams, up to 10 projects, AI adoption and usage metrics, and delivery and quality comparisons between AI and non-AI workflows.
- Bundle ($32/contributor/month): Both modules at a discounted rate. Enterprise pricing is custom.
14. Oobeya
Oobeya is an SEI platform built around proactive detection. It connects to 20+ dev tools, tracks 50+ metrics across delivery, quality, and agile performance, and runs a Symptoms module that automatically points out anti-patterns like high cognitive load and burnout risk.
The platform takes a more proactive approach with its Symptoms module, which monitors your workflows and finds early warning signs automatically. On the flip side, Waydev has a broader market presence and more features around DevEx surveys and AI tool tracking.
Key Features
- Automated Symptoms detection: The Symptoms module scans your delivery data for recurring anti-patterns. Each detected symptom comes with a root cause breakdown and a recommended action, so you’re not left interpreting the data on your own.
- Cross-platform DORA tracking: Oobeya traces commits from the software development process to production across your VCS, CI/CD, and APM tools in a single pass. This gives you accurate DORA numbers even when your pipeline spans multiple platforms.
- On-prem and private cloud deployment: You can run Oobeya on-prem, in a private cloud, or through an EU-hosted SaaS instance, which is a big part of why it’s popular in banking and telecom.
Advantages
- Proactive issue detection: The platform finds problems like slow PR reviews and pipeline bottlenecks on its own, with enough context to act on them right away. [Read Full G2 Review]
- Quick to get up and running: There’s minimal friction between connecting your tools and seeing useful data. The onboarding process is structured well, and the team is available if you encounter any problems. [Read Full G2 Review]
- Clean surface that comes with deep analytics: The UI doesn’t bury you in complexity, but the insights are surprisingly thorough once you start exploring past the top-level views. [Read Full G2 Review]
Limitations
- Limited filtering across projects: Filtering within a project is solid, but working across multiple projects at the same time isn’t as smooth as it should be. [Read Full G2 Review]
- Not plug-and-play with custom Jira setups: If your team runs non-standard Jira workflows, expect to make some adjustments before the data displays correctly in Oobeya. [Read Full G2 Review]
- AI capabilities are still in progress: Oobeya is working on expanding its AI capabilities, but as of now, they’re limited compared to platforms that have already shipped AI functionality. [Read Full G2 Review]
Pricing
Oobeya has three plans that scale with team size and the number of repos you need covered. Pricing isn’t public, but all tiers include the Symptoms module, and on-prem is available on the higher plans.
How to Select the Right Waydev Alternative for Your Needs
How to Select the Right Waydev Alternative for Your Needs
Some of these tools go deep on one aspect, while others try to cover the full picture. Here’s how to match the right one to what you need:
- For full-stack engineering intelligence with no gaps to fill, Jellyfish is by far the strongest option. It covers delivery, planning, DevEx, AI measurement, and financial reporting in one platform, which is why it sits at the top of this list.
- For automated PR workflows and code quality, LinearB and Typo both focus on the review and merge process – LinearB through workflow automation, Typo through AI-powered code review and AI-origin detection. Jellyfish covers delivery metrics at the same level but comes with planning and financial reporting that neither touches.
- For lightweight metrics without enterprise overhead, Haystack, Swarmia, and Axify are all leaner options that get teams to useful data fast. Haystack focuses on DORA, Swarmia adds working agreements and Slack automation, and Axify brings value stream mapping and daily morale tracking.
- For deep developer experience measurement, DX owns the survey-first approach with research-backed frameworks and the largest DevEx benchmark dataset in the category. Jellyfish takes a different angle by correlating its own DevEx surveys with delivery data, so you get sentiment and system metrics in one view.
- For predictive forecasting and team health signals, Allstacks flags delivery risks through ML models, while Uplevel tracks burnout, deep work, and meeting load through calendar and chat data. Jellyfish offers scenario planning and capacity forecasting that solve similar problems from the resource allocation side.
- For complex or non-standard toolchains, Faros AI and Logilica both give you access to the underlying data layer with custom metrics and open integrations. The tradeoff is a heavier setup and steeper learning curve than most options here.
- For regulated industries that require on-prem deployment, Oobeya is built for banking, telecom, and other compliance-heavy environments. If on-prem isn’t a hard requirement, Jellyfish gives you a broader feature set through its cloud platform.
- For aligning engineering metrics to OKRs and individual goals, Code Climate Velocity offers 60+ metrics with built-in goal tracking. The platform is narrower than Jellyfish, but useful if performance targets and contributor-level coaching are your primary focus.
Jellyfish — The #1 Waydev Alternative
Most teams that evaluate this space end up comparing five or six tools before realizing no single one covers everything they need.
Jellyfish is the exception people land on when they’re done mixing and matching, because the platform already handles what would otherwise take multiple vendors to pull off.
Here’s what it brings for your team:
- Scenario planning and capacity forecasting model what happens when you move headcount between projects and test whether a delivery date is realistic
- AI impact tracking tracks which coding tools your teams are using, how much you’re spending on them, and whether they’re making a measurable difference in output
- Developer experience surveys tie back to delivery data, so you know whether a morale problem is showing up in the numbers or just in Slack
- DevFinOps and R&D cost reporting bring audit-ready capitalization data without manual timesheets
- The largest engineering benchmarking dataset in the category gives your metrics real-world context from hundreds of organizations
The best way to tell whether Jellyfish is the right move is to see it against your own data and workflows. Book a demo, and the team will set that up for you.
About the author
Jellyfish is the leading Software Engineering Intelligence Platform, helping more than 700 companies including DraftKings, Keller Williams and Blue Yonder, leverage AI to transform how they build software. By turning fragmented data into context-rich guidance, Jellyfish enables better decision-making across AI adoption, planning, developer experience and delivery so R&D teams can deliver stronger business outcomes.