In this article
You can’t escape the AI success stories. Every tech leader on LinkedIn is posting about miraculous productivity gains. “AI writes 73% of my code!” “We ship 2x faster with Copilot!”
The data seems compelling, too. When Google tested AI assistance with 96 software engineers, they found that the task completion time dropped by 21%.
But on Reddit, developers share a different perspective:
(Source: Reddit)
There are studies that back up this side of the story as well. When METR tested AI tools like Cursor with experienced developers on familiar codebases, productivity dropped 19%. Time spent reviewing and correcting AI suggestions outweighed any benefits.
But as usual, the truth is somewhere in the middle.
To measure the return on investment (ROI) of AI code assistants, we need to stop asking developers how they feel and start tracking what they do.
This guide shows you how to measure AI’s actual impact, grounded in our own original research that analyzed the day-to-day impact of tools like GitHub Copilot across multiple, real-world development teams.
Step 1: Measure AI Adoption and Utilization
Step 1: Measure AI Adoption and Utilization
Having GitHub Copilot licenses doesn’t mean your team is using them. Many organizations buy seats, run a training session, and then assume adoption will naturally follow.
Six months later, they find out that half their licenses sit idle while the active users barely scratch the surface of what’s possible.
According to Stack Overflow, 51% of developers now use AI tools every day. Half the market has already integrated AI into its workflow.
But that 51% average means nothing for your team specifically. Your organization might have 80% of developers actively benefiting from AI, or you might have 20% using it while everyone else gave up after day one.
The only way to know is to measure. And you can start with these basic metrics:
| Metric | What it tells you | Red flag threshold |
| License utilization rate | % of paid seats actively used | Below 40% after 3 months |
| Daily active users (DAU) | How many developers use AI each day | Under 30% of license holders |
| Suggestion acceptance rate | % of AI suggestions developers keep | Below 15% consistently |
| Review time ratio | Time reviewing AI code vs. writing from scratch | Over 1.5x longer |
| Retention rate | % still using after 30/60/90 days | Under 60% at 90 days |
| Completions per user | Average AI interactions per developer daily | Less than 10 per day |
| Code contribution share | % of committed code that originated from AI | Below 10% after 6 months |
| Feature coverage | Which languages/frameworks see AI usage | Only 1-2 languages adopted |
These metrics help you decide when to move from “AI-optional” to “AI-expected.”
When most of your team is using it successfully and the value is proven, you might choose to standardize around these tools.
Some companies have already made this leap. A developer on Reddit shared how their leadership made the switch:
A year ago, we had GitHub Copilot and an internal ChatGPT, but it was a plus for those who wanted it. Today, that’s completely changed. We have to use AI. In Frontend, Cursor with the latest AI models from GPT, Gemini, Claude, and DeepSeek.
In Backend, Claude’s code, as well as a bunch of MCPs and rules to allow these agents to navigate our multi-repo codebase, understand the specifics/”internal framework” we use, etc…
But pushing too hard too fast can backfire. Teams forced to adopt AI before they’re ready often show worse metrics than those who adopt organically.
Watch for these warning signs that your rollout needs adjustment:
- Acceptance rates keep dropping each week
- The same few developers generate almost all AI activity
- Developers try the tools once, then turn them off
- Reviewing AI suggestions takes longer than writing code manually
- Heavy AI users don’t commit code any faster than non-users
- Senior developers quit using the tools while juniors struggle
- More bugs come from AI-generated code than human-written code
If you’re seeing multiple red flags, you need to fix adoption before thinking about ROI. There’s no point in measuring returns when your team isn’t using the tools right.
PRO TIP 💡: Jellyfish breaks down AI adoption by team, programming language, and development environment. You might find senior developers use AI for documentation while juniors rely on it for everything. This breakdown helps you set realistic policies and support each group based on their actual needs.
Step 2: Measure AI's Impact on Engineering Work
Step 2: Measure AI’s Impact on Engineering Work
Okay, developers are using the tools. The next question is whether the tools make them more productive. There are three areas where you’ll see the impact:
Impact on Developer Productivity (The Inner Loop)
According to our 2025 State of Engineering Management report, 62% of teams see at least 25% productivity gains from AI tools. These are impressive numbers, no doubt, but productivity means different things to different teams.
The inner loop is the core development cycle — writing code, testing it, fixing what breaks, and pushing commits. This is where AI promises the biggest gains, but it’s also where measurement gets tricky.
Here’s what you should primarily look at:
- Time saved on repetitive tasks: AI tools love to report time saved, usually based on keystrokes or code generated. These numbers are rough estimates at best since typing speed is rarely what slows DevOps down.
- Code survival rate: Track the percentage of accepted AI suggestions that stay in the codebase. If developers keep deleting AI code after accepting it, you’re losing time, not saving it.
- Task completion velocity: Measure how long developers spend in active coding for similar tasks. Our research shows AI users spend 3-15% less time in their IDE per task. Small gains, but they compound across hundreds of tasks.
- Context switch reduction: Count how often developers leave their IDE to search Stack Overflow, read documentation, or check Slack. Good AI adoption shows 30-40% fewer context switches during coding sessions.
- Debug cycle time: Track how long it takes to find and fix bugs from discovery to deployment. AI might speed up bug identification, but slow things down if its code creates hard-to-find issues.
Metrics like lines of code become useless with AI tools. A developer might write 500 lines in an hour with Copilot, but if most need fixing, they’re worse off than someone who wrote 50 good lines manually.
Also, skip velocity and story point metrics entirely. They’re too easy to manipulate. As one engineering lead confessed on Reddit:
I’m a lead at my company, and I’ve been heavily pointing all story tickets since management wants to play the velocity game.
What matters are outcomes, not output. You want to know if developers deliver working software faster, not if they generate more lines of code.
PRO TIP 💡: Jellyfish visualizes productivity impact across multiple AI tools simultaneously. You can compare how Copilot affects cycle time versus how Cursor impacts bug rates for the same team. This head-to-head comparison shows which tool speeds up delivery versus which one just changes how work gets done.
Impact on Delivery (The Outer Loop)
Inner loop improvements should translate to faster delivery. If developers code faster but features don’t ship sooner, something’s broken in your process.
Our research confirms this connection. Teams using GitHub Copilot saw a 16% reduction in task size and an 8% decrease in cycle times. Teams shipped working software faster, and that’s what truly counts.
The best way to measure delivery impact is through DORA metrics. These four metrics have become the industry standard for good reason. Even Reddit’s typically skeptical developer community agrees:
I think that DORA metrics are a good way to measure the maturity of the development process of any given team, which, IMO, is the closest we can get to measuring output. Measuring the productivity of an individual is a futile effort.
Let’s break down what to expect from each one:
- Deployment frequency measures how often you ship to production. AI helps developers break work into smaller pieces and ship them faster, so teams often see 20-30% more deployments unless they’re already shipping multiple times daily.
- Lead time for changes tracks time from commit to production. AI speeds up coding and encourages smaller PRs that reviewers approve faster, so many teams can cut this metric by 15-25%.
- Change failure rate tracks the percentage of deployments that fail. Initially, this might go up while teams adapt to AI code quality, but it typically drops once developers know what to watch for.
- Mean time to recovery measures how fast you fix production breaks. AI speeds up debugging and patch creation, with teams typically fixing issues 10-20% faster than before.
Note: We’re still in the early days of measuring AI’s impact on DORA metrics. Consider them starting points for your own measurements, not definitive benchmarks.
The task size reduction we observed (16%) matters more than it might seem. Smaller tasks mean faster reviews, simpler testing, and less risk per deployment.
AI makes developers comfortable breaking work into smaller chunks because the overhead of context switching drops when AI helps maintain flow.
Don’t expect these improvements overnight. Most teams see a lag of 2-3 sprints before delivery metrics improve. Your developers are learning when to trust AI and how to review its code.
Impact on Developer Experience & Satisfaction
According to McKinsey research, AI tool users are twice as likely to feel happy, fulfilled, and in the flow at work. The impact on developer well-being is hard to ignore.
Simple happiness surveys don’t tell the whole story, though. You can track these three areas to get the full picture:
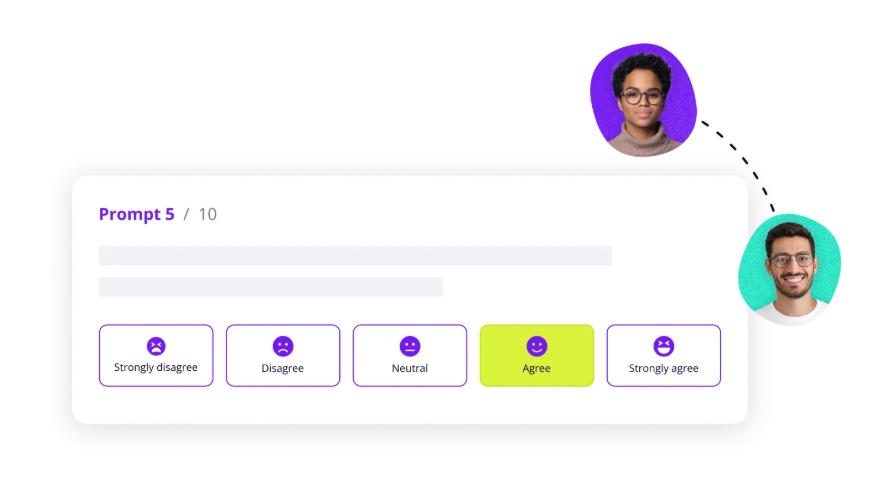
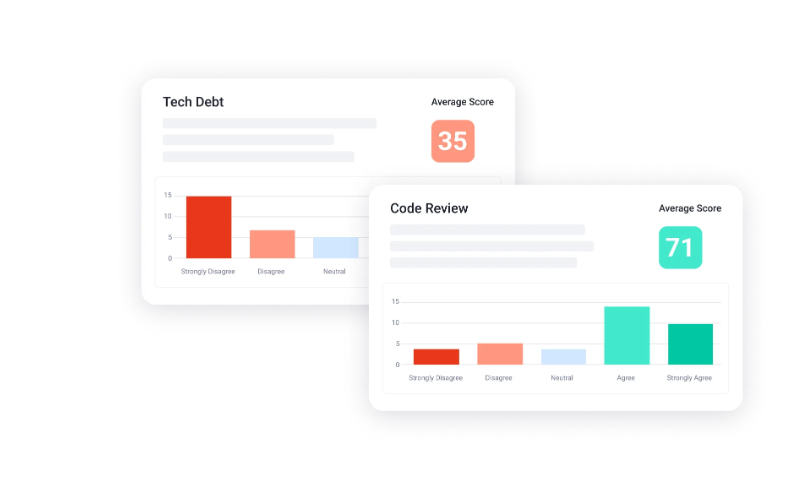
- Qualitative surveys: Track sentiment through regular surveys about AI tool satisfaction. Ask about stress levels, developer time saved, and the simple question: “Would you recommend these tools to a friend?”
- Developer feedback: One-on-ones and retrospectives can bring nuanced experiences that surveys miss. Ask developers what AI makes easier and what it makes harder to get honest answers about the tradeoffs.
- Behavioral changes: Take a look at where developers redirect their energy when AI handles routine coding. Our research found Copilot users wrote longer, more detailed PR comments, so they had more time for thoughtful collaboration.
- Code documentation quality: Developers with more time often write better documentation and clearer commit messages. Track the length and quality of technical docs, README files, and inline comments.
You also need to be careful not to let AI create new vulnerabilities. Unrealistic expectations and choice overload can quickly destroy the benefits. One developer’s experience on Reddit serves as a warning:
I think the biggest issue is with the expectations. We expect 10x developers now, and for challenging projects, it’s not nearly at that level. So, we still feel behind and overburdened.
The other problem I have personally is that AI-driven coding allows for a lot more experimentation. I was building a video processing pipeline and ended up with 5 fully formed prototypes leveraging different multiprocessor / async paradigms. It got so overwhelming, and I became lost in the options rather than just focusing on the one solution.
Keep an eye out for signs of AI fatigue:
- Developers spend more time fixing AI code than writing their own
- Declining survey scores after the initial honeymoon period
- Your senior engineers abandon the tools, but juniors can’t code without them
- Teams feel stressed about not using AI “enough”
- Analysis paralysis kicks in when AI offers too many options
If your developers are happier and more productive, you’re on the right track. If they’re stressed about being “AI-powered developers,” you need to adjust expectations.
PRO TIP 💡: Jellyfish DevEx surveys integrate with your engineering metrics to show the complete picture. You can correlate developer sentiment with actual productivity data to see if feeling productive matches being productive.
This helps you spot when developers feel busy but aren’t shipping more, or when they’re quietly burning out despite good metrics.
Step 3: Calculate the Total Cost of AI-Powered Coding Tools
Step 3: Calculate the Total Cost of AI-Powered Coding Tools
If you’re only budgeting for licenses, you’re in for a surprise. The true cost of AI adoption typically lands at 2-3x the subscription fees.
Here’s a breakdown of what you’re paying for:
| Cost type | What it includes | First-year cost | Ongoing annual |
| Direct costs | |||
| Licenses | GitHub Copilot, Cursor, etc. ($20-50/dev/month) | $12,000-30,000 | $12,000-30,000 |
| Usage fees | API calls, tokens, overages | $6,000-36,000 | $6,000-36,000 |
| Hidden costs | |||
| Training time | 4-8 hours per developer @ $75/hour | $15,000-30,000 | $3,000-6,000 |
| Productivity dip | 10-20% drop for 1-2 months during adoption | $30,000-120,000 | — |
| Infrastructure | CI/CD updates, security config (40-80 hours) | $6,000-12,000 | $2,000-4,000 |
| Ongoing costs | |||
| Tool management | License tracking, vendor management (10-20 hrs/month) | $9,000-18,000 | $9,000-18,000 |
| Tool sprawl | Multiple tools per developer, shadow IT | $5,000-15,000 | $10,000-30,000 |
| Compliance | Security reviews, audits (40-80 hrs/year) | $6,000-12,000 | $6,000-12,000 |
| Total | $89,000-273,000 | $48,000-136,000 |
Note: These are rough estimates based on typical mid-sized engineering teams. Your actual costs will vary based on team size, existing infrastructure, and implementation approach.
A 50-developer team typically spends $150,000-180,000 in the first year — roughly 3x the license cost alone. Year two drops to $70,000-90,000 as training and setup costs disappear.
The wide range depends on your approach. Teams that rush adoption, pick expensive tools, and lack governance hit the high end. Those that phase rollout, negotiate contracts, and control tool sprawl stay near the low end.
The numbers look scary, but AI tools can still deliver solid returns. Just go in with eyes open about the true costs.
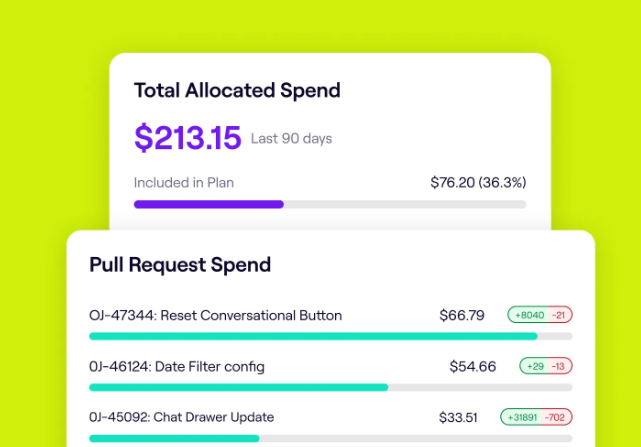
PRO TIP 💡: Jellyfish’s AI Impact now shows exactly how your AI spend translates to delivery value. View spend at the tool, individual, or initiative level to understand which AI investments lead to tangible project outcomes and which ones drain your budget without returns.
6 Best Practices for Measuring AI's Impact on Software Development
6 Best Practices for Measuring AI’s Impact on Software Development
If you want to measure AI’s real impact on your team, you need to approach it systematically.
These six practices provide a framework based on what we’ve seen work:
1. Prioritize Team-Level Insights, Not Individual Scores
Why this matters: When you measure individual AI usage, people game it immediately. They’ll accept bad suggestions to hit their numbers, or avoid using AI on hard problems where it might actually help.
Meanwhile, the team’s actual delivery speed stays the same. Here’s how this developer on Reddit explained it:
You cannot measure effectively and efficiently the productivity. There are so many things a developer does and so diverse that you cannot have a metric. Developing is just not closing tickets; it also means thinking, discussing, reviewing, reading articles, relaxing (in the right moment), etc.
If you set up a metric, people will stop doing all of this and start scoring in your KPIs, leading to a loss of productivity.
How to implement:
- Track your team’s cycle time for three months before and after AI adoption to see if work moves faster through your pipeline
- Measure how code reviews change by tracking review turnaround time and whether comments focus on substance or just formatting nitpicks
- Watch if senior developers spend their freed-up time mentoring juniors through pair programming and better PR feedback
- Monitor team-wide bug rates and fix times each sprint instead of trying to trace which bugs came from AI-generated code
- Compare delivery metrics between teams using AI and teams working traditionally to see who actually ships more features
Common mistakes to avoid:
- Keep AI usage completely out of performance reviews since it tells you nothing about actual work quality
- Don’t ask developers to justify why they didn’t use AI for certain tasks or functions
- Don’t make AI adoption part of quarterly OKRs with targets like “all developers must use Copilot daily”
- Never say things like “Sarah uses AI 60% of the time, why are you only at 20%” in team meetings
- Stop asking “Did you try using Copilot for this?” every time someone’s task takes longer than expected
Example: A company tracks individual AI metrics and watches their senior developers accept every suggestion to avoid looking outdated. Code quality drops, bugs increase, and reviews take forever. They only recovered when they switched to team-level metrics.
2. Combine Quantitative Data with Qualitative Feedback
Why this matters: Numbers tell you what happened, but not why it happened or how to fix it. Your metrics might show 30% faster cycle times while developers feel burned out from fixing AI’s mistakes. You need both data streams to understand if AI actually helps or just moves problems around.
How to implement:
- Run monthly surveys asking developers what AI makes easier and harder, then compare responses to your productivity metrics
- Schedule quarterly one-on-ones focused on AI experiences where developers can share frustrations they won’t put in writing
- Track sentiment scores alongside DORA metrics to catch when good numbers hide growing team frustration
- Create anonymous feedback channels for AI concerns, since developers might not criticize the tools management bought
Common mistakes to avoid:
- Don’t rely only on metrics and assume silence means developer satisfaction when they might just be resigned
- Stop sending generic “How satisfied are you with Copilot?” surveys that get the same responses every time
- Never dismiss developer complaints because “the metrics look fine” without investigating deeper
- Avoid leading questions like “How much do you love our AI tools?” that discourage honest feedback
Example: A team shows impressive metrics with 65% acceptance rates and 20% faster cycle times, but their retros tell a different story. Developers complain they spend hours untangling AI spaghetti code. The numbers say success while the team burns out fixing AI mistakes nobody tracks.
PRO TIP 💡: Jellyfish DevEx automatically runs repeatable surveys that you can schedule monthly or quarterly alongside your metrics collection. The platform correlates survey responses with engineering data from the same time period, so you can see if developers who report AI frustration also show declining productivity.
3. Use a Control Group for Accurate Analysis
Why this matters: Without a control group, you can’t tell if improvements come from AI or from other changes like better processes, new hires, or simpler projects.
This is the methodology we used in our own research on Copilot’s impact.
We compared 133 Copilot users to a control group of 750 non-users from the same companies, so we could confidently attribute changes in metrics like cycle time directly to the use of AI.
How to implement:
- Split similar teams where one adopts AI coding assistants while the other continues working traditionally for at least one quarter
- Match teams by project complexity, tech stack, and seniority levels so you can compare apples to apples
- Track the same metrics for both groups, including cycle time, bug rates, and deployment frequency, to spot real differences
- Rotate which teams get AI access after each measurement period so everyone gets a turn, and you validate results
- Keep control groups large enough to matter, at least 20-30 developers, or your data won’t mean much
- Document external factors that might affect results, like reorgs, layoffs, or major platform changes that hit both groups
Common mistakes to avoid:
- Don’t stack your AI group with senior developers, then act surprised when they outperform juniors
- Stop cherry-picking timeframes where AI teams happened to work on easier projects than control groups
- Never forget to account for the Hawthorne effect, where teams improve just because they know you’re watching
- Don’t contaminate your control group by letting them use AI “just a little bit” or for “special cases”
- Pay attention when non-AI teams deliver faster or write better code, even if it challenges your assumptions
Example: A company compares their backend team using Copilot to their frontend team without it and claims AI drives 40% improvements. They ignore that the backend team just finished a major refactor while the frontend team struggles with legacy code. Without proper controls, every comparison becomes meaningless.
4. Start with a Clear Governance Policy
Why this matters: Research shows 93% of organizations use AI, but only 8% have proper governance, with over half operating without any formal AI policies.
Developers don’t know what they can share with AI, security teams panic about data leaks, and legal discovers problems only after they happen. Setting policies upfront saves you from expensive mistakes and panicked scrambles later.
How to implement:
- Document what’s off-limits for AI tools, including customer data, credentials, and proprietary algorithms
- Create an approved tools list and block access to everything else until security vets it properly
- Mark high-risk code that always needs human review, like auth systems, financial calculations, and data migrations
- Make teams request new AI tools through IT instead of using random web apps with company code
Common mistakes to avoid:
- Don’t wait for someone to paste your database schema into ChatGPT before creating usage rules
- Skip the generic “use good judgment” policies that mean nothing when developers need real guidance
- Assume tired developers will paste anything to fix a bug unless policies explicitly forbid it
- Don’t create policies so restrictive that developers use personal accounts to bypass them
Example: A healthcare startup finds out that their developer used Claude to debug an API that included patient IDs and prescription data. They spend two months determining if this triggered HIPAA violations, pause their next release, and set up emergency training. A simple policy listing PHI as off-limits would have taken five minutes to write.
5. Set Realistic Expectations and Celebrate Incremental Wins
Why this matters: Managers often expect AI to revolutionize everything overnight, but developers know better. As one developer explained on Reddit:
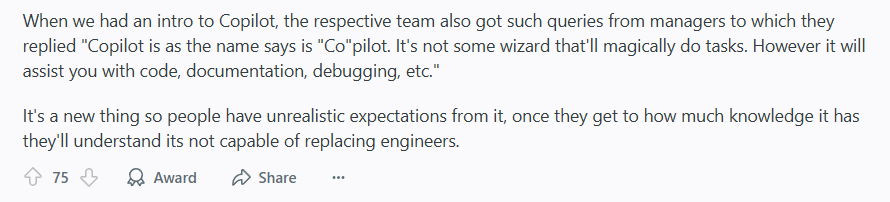
(Source: Reddit)
You need to stick with AI long enough to see benefits, not abandon it when it’s not perfect.
How to implement:
- Start with modest goals like “reduce PR review time by 20%” instead of “transform how we build software”
- Keep an open team channel where developers can post screenshots of AI solving actual problems
- Focus AI on grunt work first, like boilerplate code and unit tests, before tackling complex logic
- Make it safe to talk about when AI wastes time so others avoid the same mistakes
Common mistakes to avoid:
- Don’t promise 10x developers or 50% faster delivery when most teams see 10-25% improvements at best
- Stop comparing your results to vendor case studies that cherry-pick their absolute best outcomes
- Never set annual goals based on early adoption spikes that won’t sustain over time
- Don’t hide or dismiss small improvements because they seem unimpressive compared to the hype
- Stop chasing perfection when good enough improvements still make work better for everyone
Example: Management promises the board that AI will cut development costs by 40% this year. After three months of 12% improvements, they declared AI a waste and cut the program. Meanwhile, their competitor quietly celebrates 12% gains each quarter and pulls ahead.
6. Analyze Your Data by Cohorts
Why this matters: AI isn’t one-size-fits-all. Juniors might see 40% gains while seniors see 5%, or backend teams might benefit more than frontend teams. Different developers need different approaches, and you can’t optimize what you don’t segment.
How to implement:
- Split metrics by experience level to see if AI helps juniors learn faster or just makes seniors impatient
- Compare AI impact across tech stacks since Copilot might rock at Python, but struggle with your legacy Java
- Track adoption and benefits by team type because platform engineers and frontend developers have different needs
- Analyze by project type to learn if AI helps more with greenfield development or maintenance work
Common mistakes to avoid:
- Don’t report company-wide averages that make 50% gains for juniors and 0% for seniors look like 25% for everyone
- Stop rolling out universal AI policies when frontend and backend teams need different approaches
- Never copy what works for Team A and force it on Team B without checking if their work is similar
- Control for variables like codebase age and team stability before comparing cohort performance
Example: A company celebrates 30% average productivity gains until someone checks the details. Frontend developers improved 70% while backend developers got 15% slower, but nobody noticed because the average looked good.
PRO TIP 💡: Jellyfish segments AI impact data by seniority, team, tech stack, and project type automatically. You might discover senior engineers barely use AI while juniors rely on it heavily, or that your Python teams see 30% gains while Java teams see none.
See the True ROI of AI with Jellyfish
See the True ROI of AI with Jellyfish
Teams are spending thousands on AI tools without knowing if they work. GitHub says Copilot saves time, your developers have mixed feelings, and engineering leaders want proof of ROI. The problem is you’re measuring the wrong things with the wrong tools.
That’s where Jellyfish comes in.
Jellyfish is a software engineering intelligence platform that centralizes data from your development tools and AI assistants to show how engineering work connects to business outcomes and team performance.
Here’s what you’ll get with our AI Impact dashboard:
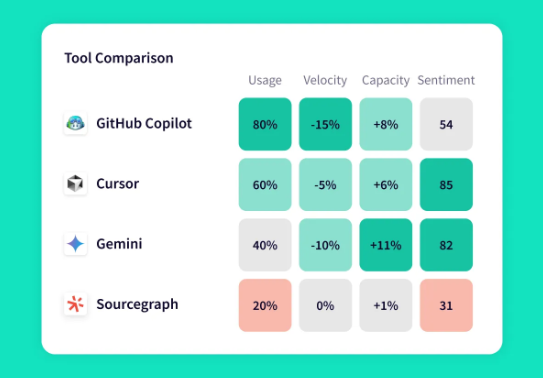
- Measure AI impact across your entire tool stack in one view: Track adoption, cost, and delivery impact for GitHub Copilot, Cursor, Claude, Gemini, and other AI tools through unified dashboards. Compare tool performance side by side to understand which tools deliver value for specific teams, languages, and use cases.
- Discover which AI tools work for which parts of your organization: Get detailed breakdowns showing tool performance by team, tech stack, and seniority. Stop forcing one-size-fits-all solutions when data shows different teams need different tools.
- Outline bottlenecks and optimize your development lifecycle with AI insights: Life cycle explorer shows where AI speeds up work and where it creates new blockers in your workflow. See if AI-generated code moves through review faster or gets stuck, and understand how AI changes your team’s capacity to deliver.
- Track AI agents and assistants together for complete pipeline visibility: Monitor everything from code generation to review automation in one platform. See if your AI ecosystem works as a system or just as disconnected point solutions.
- Prove AI ROI by connecting every dollar spent to project outcomes: Track costs and value at the tool, team, and initiative level to see what’s working. Show leadership exactly how AI investment translates to delivery improvements (or doesn’t).
Copilot says it saves time. Your developers say maybe. Your CFO says prove it.
Schedule an AI Impact demo and settle the debate.
FAQs
FAQs
Where in the development lifecycle should I expect to see the biggest business impact of AI?
AI helps most with initial code writing, test generation, and documentation. These repetitive tasks can go 20-40% faster with AI assistance.
Complex debugging and architecture decisions still need human judgment, so expect smaller gains there.
How can I set a proper benchmark to measure AI’s impact on code quality?
Start by measuring your current baseline – bug rates per sprint, time spent on bug fixes, and code review comments about quality issues.
After three months of AI adoption, compare these same metrics to see if AI-generated code creates more or fewer problems.
Track defect density and production incidents specifically tied to AI-assisted code versus human-written code to get the clearest picture.
Beyond today’s coding assistants, what’s the next big thing in AI development?
AI agents that handle entire development workflows already exist — tools that can take a Jira ticket, write the code, create tests, and submit a PR without human intervention.
The problem isn’t to build these agents but to trust them, since autonomous code generation at scale introduces new risks around security, quality, and maintainability.
Most teams will probably adopt hybrid approaches where agents handle simple tasks end-to-end while developers review and guide complex work.
What does a realistic ROI calculation for AI coding tools look like?
Most teams spend about $3,000 per developer per year when you add up licenses, training, and setup time. If a developer saves 3 hours a week and you’re paying them $100K annually, that’s roughly $7,500 in time saved per year.
The math works, but only if those saved hours turn into more shipped features rather than just shorter work weeks.
Learn More About AI in Software Development
Learn More About AI in Software Development
- What is the Impact of AI on Software Development?
- Benefits of AI in Software Development
- The Risks of Using AI in Software Development
- How to Use AI in Software Development: 7 Best Practices & Examples for Engineering Teams
- AI in Software Testing and Quality Assurance
- Will AI Replace Software Engineers? No and Here’s Why
- What’s The Future of Software Engineering with AI?
- What is the Responsibility of Developers Using Generative AI? Key Ethical Considerations & Best Practices
About the author

Ryan Kizielewicz is a Product Manager at Jellyfish.