In this article
Platform engineering initiatives often start with a burst of energy. Leaders identify the need to reduce cognitive load, teams build an Internal Developer Platform (IDP), and the initial technical hurdles are cleared.
But then comes the hard part: proving it works.
Too many platform teams fall into the zero-metric illusion. [*] They assume that because the platform is live and hasn’t crashed, it is successful. However, without concrete data, you are flying blind. You don’t know if developers are actually using your golden paths, if developer experience is improving, or if you are simply creating a new layer of technical debt.
Success isn’t just about shipping a platform; it’s about treating that platform as a product. And like any product, it needs a balanced scorecard to guide its roadmap and prove its ROI.
This guide outlines 15 essential platform engineering metrics—spanning adoption, developer satisfaction, delivery speed, and business value—to help you move beyond guesswork and measure the true impact of your platform strategy.
Adoption and Usage Metrics (Is Anyone Using It?)
Adoption and Usage Metrics (Is Anyone Using It?)
The most common failure mode for a platform engineering team is building a technically impressive ghost town. A platform is an internal product, and if your customers (developers) aren’t choosing to use it, it’s failing. Adoption metrics are your first signal of product-market fit.
1. Daily Active Users (DAU)
This is the most basic measure of engagement. It tracks the number of unique developers interacting with the platform each day. A high number indicates that the platform is integrated into daily workflows, while a low or declining number suggests it’s being bypassed.
Trap to avoid: Don’t just measure logins to the portal. Measure active usage of the underlying tools (e.g., CLI commands run, API calls made). A developer might not visit the portal UI every day, but they might use the platform’s CLI 50 times a day.
2. Percentage of Deployments via Platform
Are developers using your golden paths, or are they still running custom scripts? This metric tracks the percentage of deployments that go through the platform’s standardized pipelines versus those that use “off-road” methods. High usage here proves that your platform is the path of least resistance.
As one user noted on Reddit, the goal is to “Drive adoption: Be accountable for teams actually using your platform tools.” If usage is low, it’s a signal to improve the product, not blame the user.
3. Self-Service Rate
The goal of a platform is to eliminate ticket queues. This metric tracks the percentage of infrastructure requests (e.g., new database, new environment) that are completed via self-service versus those requiring a manual ticket to Ops.
4. Onboarding Time (Time to First Commit)
How long does it take a new engineer to go from “day one” to deploying code to production? A mature platform should make this a matter of hours, not weeks.
A Reddit user highlighted the importance of tracking metrics like Time to First Commit and Time to Production to quantify improvement, treating the onboarding experience as a key product feature.
Developer Experience & Satisfaction (Do They Like Using It?)
Developer Experience & Satisfaction (Do They Like Using It?)
High adoption doesn’t always mean high satisfaction—developers might be using your platform simply because they are forced to. To truly measure success, you need to understand the human experience of using the tools.
As one engineer argued, the center of platform engineering “should be developer experience… eliminating all friction and toil across the entire development lifecycle.”
5. Developer Net Promoter Score (NPS)
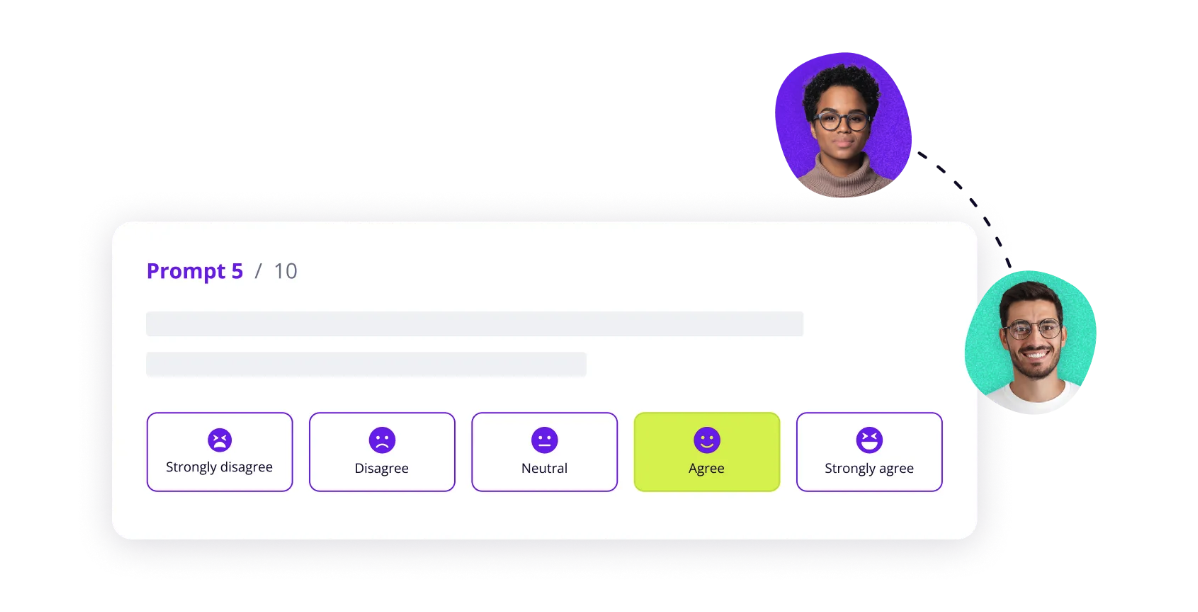
Treat your platform like an external product by asking the standard question: “How likely are you to recommend this platform to a colleague?” While simple, this metric provides a consistent baseline for sentiment over time.
Pro tip: Don’t just ask for a number. Always include an open text field in developer surveys to get additional insights. Qualitative comments in that field often reveal specific bugs or feature requests that are blocking your roadmap.
6. Perceived Developer Productivity
Sometimes the hard data (like build times) looks green, but developers still feel slow. Perceived productivity measures whether developers feel the platform is helping or hindering them.
One manager noted the danger of relying solely on hard numbers: “I was never able to get metrics I was happy with – they get thrown off by the smallest things and the numbers always seemed very noisy/random and didn’t seem to fit the lived experience of the team.”
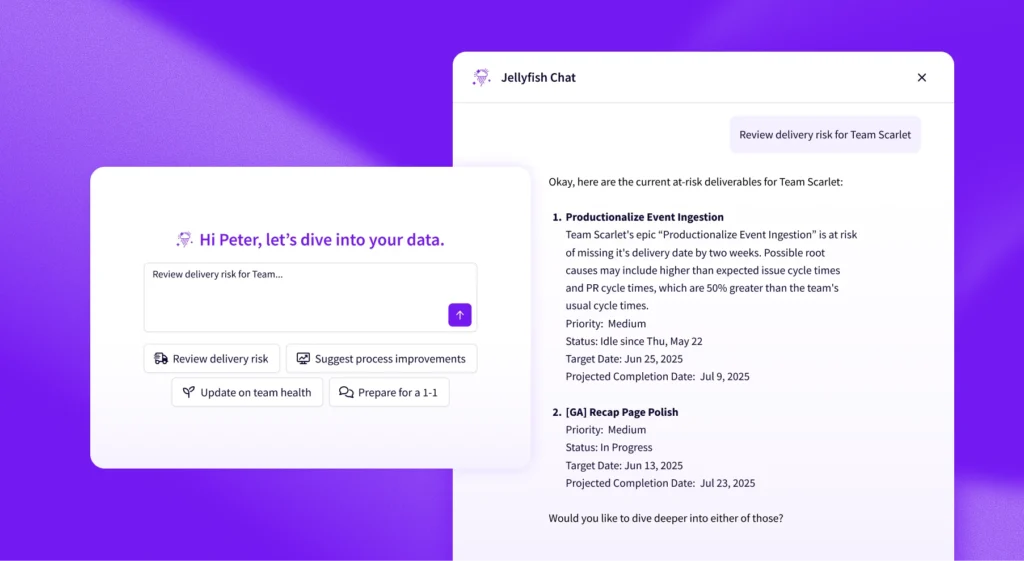
💡Jellyfish Insight: Use Jellyfish’s DevEx surveys to capture this sentiment alongside your quantitative data. If Perceived Productivity is low but Cycle Time is fast, you likely have a burnout problem where developers are working harder, not smarter, to meet deadlines.
7. Cognitive Load and Friction
This measures the mental effort required to complete a task. High cognitive load—caused by confusing documentation, context switching, or complex debugging—is a primary driver of burnout.
You can measure this through surveys (“How easy was it to deploy this service?”) or by tracking friction metrics like the number of support tickets filed per deployment.
A team lead shared a practical way to track this friction: “My organization tracks the basic DORA metrics, but we’ve also made a shift into tracking pain points along the commit to deployment path. For example… the number of iterations (patchsets/commits) a change undergoes while in review.”
Trap to avoid: Don’t confuse activity with cognitive load. A developer running 50 builds a day isn’t necessarily productive; they might be fighting a flaky pipeline. Look for repeated failures or high rework rates as proxies for frustration.
Learn more → Cognitive Complexity in Software Engineering
Delivery and Velocity Metrics (Are We Moving Faster?)
Delivery and Velocity Metrics (Are We Moving Faster?)
These metrics connect the platform to the engineering organization’s output. Executives ultimately care about whether the platform is helping the business ship value faster. As one Reddit user noted, tracking metrics should be done “with the intention of solving specific business problems,” not just for the sake of measuring.
8. Lead Time for Changes
This DORA metric measures the time it takes for a commit to get into production. Change Lead Time is the ultimate litmus test for your platform’s automation. If your platform is successful, it should strip away the manual gates, flaky tests, and infrastructure delays that bloat lead time.
A Reddit user suggests going deeper than just the top-level number by tracking specific friction points along the path: “My organization tracks the basic DORA metrics, but we’ve also made a shift into tracking pain points along the commit to deployment path. For example… the time it takes for a change (usually this means a PR) to be reviewed and approved.”
9. Deployment Frequency
A mature platform encourages small batch delivery by making deployments boring, safe, and automated. If deployment frequency is increasing, it means developers trust the platform enough to ship code continuously rather than hoarding it for a “big bang” release.
Trap to avoid: Don’t confuse builds with deployments. Running a CI build 100 times a day doesn’t deliver value if it’s stuck in a staging environment. Measure how often code actually reaches the end user.
10. Cycle Time
Cycle Time measures the total elapsed time from when work starts to when it is delivered. It captures the entire workflow, including the hidden wait times that platform engineering aims to eliminate—like waiting for environments, waiting for pull request reviews, or waiting for security checks.
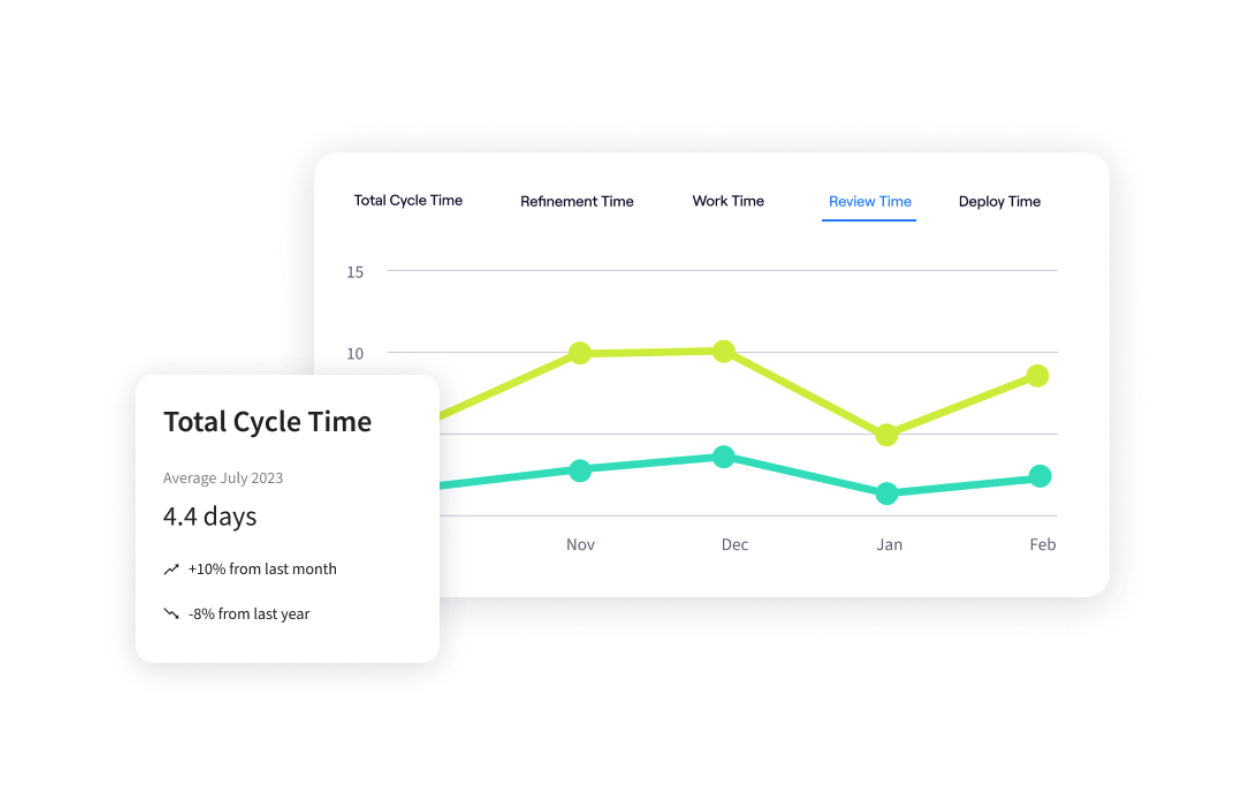
💡Jellyfish Insight: Jellyfish allows you to break Cycle Time down into its component parts (Coding, Pickup, Review, Deploy). This helps you prove that your platform is specifically reducing the Deploy and Pickup phases, pinpointing the exact value of your automation.
One team found this breakdown critical for identifying the real problem:
“We get DORA metrics through our IDP… They’re a really good base for the team (not management) to discover where they’re facing bottlenecks. Basically, found PR reviews were a big time hurdle to the pipeline, so got the team together to figure out how to resolve them organically.”
Learn more: Cycle Time vs. Lead Time: Know the Difference
Reliability and Stability Metrics (Is It Breaking?)
Reliability and Stability Metrics (Is It Breaking?)
One of the most critical risks in platform engineering is optimizing for speed at the expense of stability. As your platform accelerates deployments, it must also improve—not degrade—reliability. Tracking these metrics ensures your platform is building a resilient foundation, not just a faster way to break production.
11. Change Failure Rate (CFR)
This is the definitive quality metric. CFR measures the percentage of deployments that result in degraded service or require immediate remediation (like a hotfix or rollback).
A low CFR indicates that your platform’s automated tests, policy checks, and staging environments are effectively catching bugs before they reach users. If CFR spikes as platform adoption grows, your golden paths may be too permissive.
Jellyfish Insight: Correlate CFR with Deployment Frequency. If you see deployments go up and failures stay flat or go down, you have achieved the “DevOps ideal” of high-speed stability.
12. Mean Time to Recover (MTTR)
When things break (and they will), how fast can you fix them? MTTR measures the average time it takes to restore service after an incident.
A mature platform significantly reduces MTTR by providing automated rollback capabilities, instant access to observability data, and self-healing infrastructure.
A Reddit user emphasized focusing on critical flows: “Use integrations that trigger events only when metrics matter… highlight only the bottlenecks or outliers that slow the delivery pipeline.” This approach ensures MTTR efforts are focused on high-impact incidents.
13. Platform Uptime and Availability
This measures the reliability of the Internal Developer Platform (IDP) itself, not just the applications it hosts.
If your platform is down, your developers can’t ship code. As reliance on the IDP grows, its availability becomes mission-critical. A flaky platform destroys developer trust faster than almost anything else.
Trap to avoid: Don’t just measure uptime (is the server on?). Measure service availability (can a developer successfully complete a deployment?). If the portal loads but the deployment pipeline is broken, your platform is effectively down.
14. Incident Volume & Severity
Track the raw number of incidents over time, categorized by severity.
A downward trend in incident volume, even as deployment frequency rises, is the ultimate proof that your platform is engineering reliability into the system. It shows that your shift left security and quality checks are working.
Efficiency and Business Value (Is it Worth the Cost?)
Efficiency and Business Value (Is it Worth the Cost?)
Ultimately, engineering leaders must answer a hard question from the CFO and other stakeholders: “We spent millions building this platform—did we get a return on that investment?” This category of metrics translates engineering improvements into financial terms.
15. Resource Utilization & Cloud Cost Efficiency
Cloud costs are often the second largest line item after salaries. A mature platform creates value by “right-sizing” this spend automatically. You should track resource utilization rates (are reserved instances sitting idle?) and the lifecycle of ephemeral environments (are test environments spinning down automatically?).
A Head of Platform on Reddit advised making this a priority from day one: “Try to make a note of costs and billing as your constraint. You don’t want management to get back at you for an over-provisioned resource.”
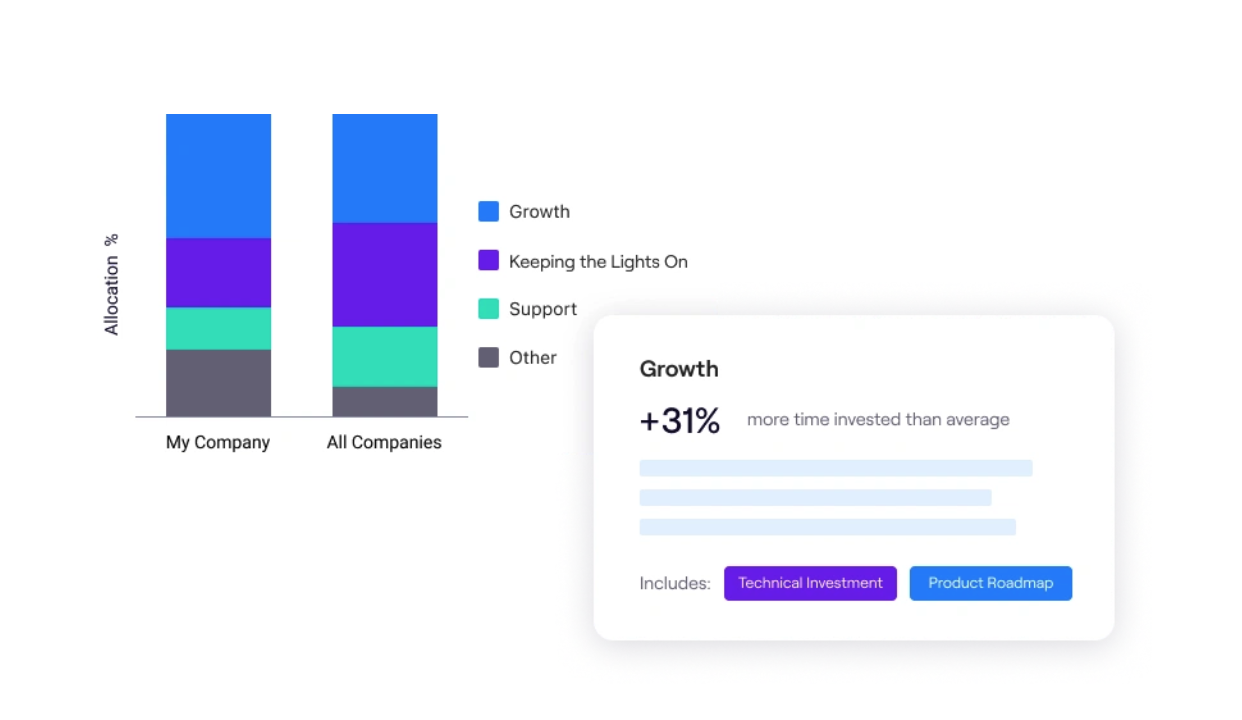
16. Allocation to Toil
This measures the percentage of engineering time spent on repetitive, manual work (like manually provisioning a database or fixing config drift) versus strategic work. High toil scales linearly with service growth and kills innovation.
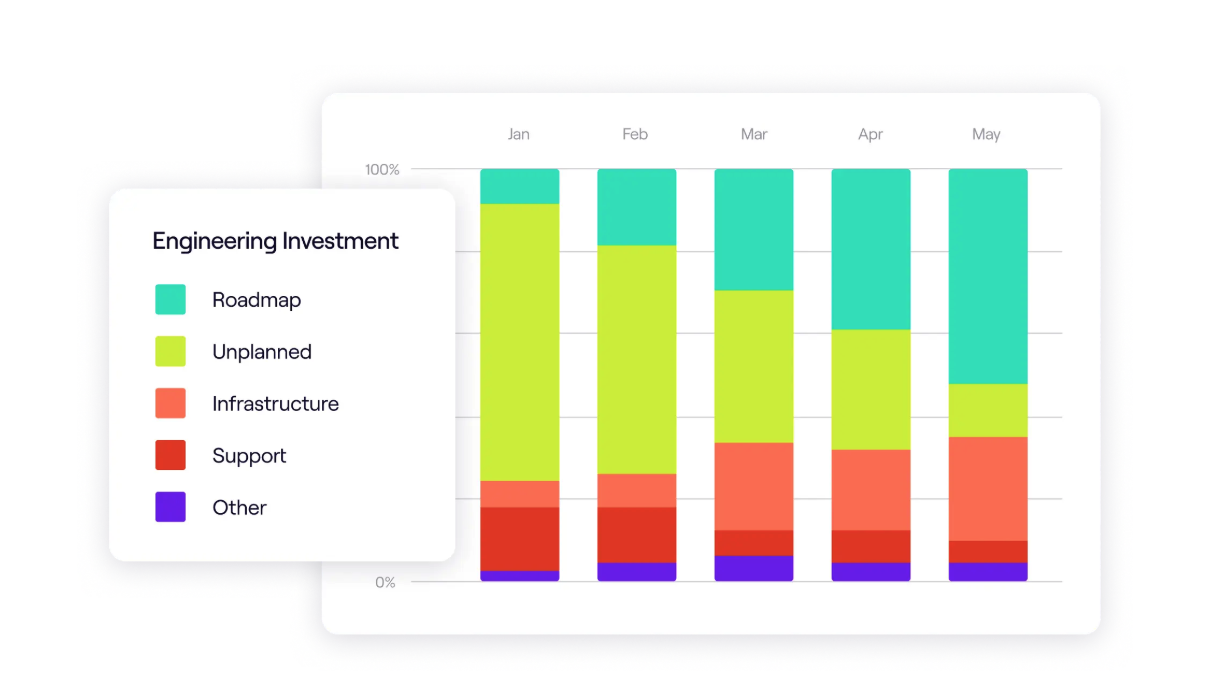
For example, you can measure the ratio of time spent on KTLO (Keeping the Lights On), Support, and Unplanned Work versus Roadmap or New Feature work.
💡Jellyfish Insight: Use resource allocation reports to visualize this split. A successful platform should drive a downward trend in Allocation to Toil, proving that automation is freeing up capacity for innovation.
17. Platform ROI (Cost vs. Value)
This is the ultimate calculated metric that turns abstract benefits into a dollar figure. A common formula is calculating developer hours saved multiplied by their hourly rate, plus infrastructure savings, divided by the cost of the platform team.
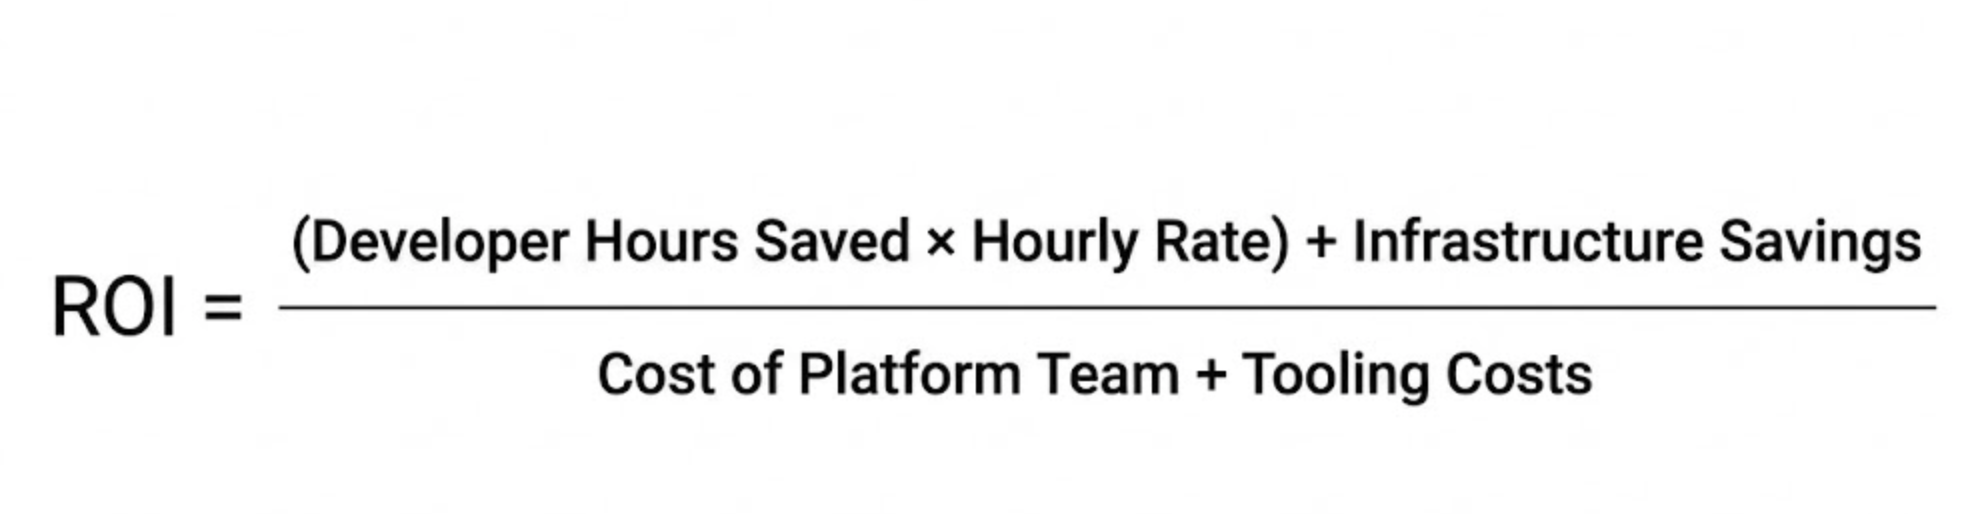
This simple equation turns abstract benefits into a dollar figure. If the platform saves 5,000 developer hours a year and reduces cloud waste by $200k, against a platform team cost of $500k, the value is undeniable.
Track Platform Engineering Metrics with Jellyfish
Track Platform Engineering Metrics with Jellyfish
Defining the right metrics is only the first step. The real challenge is collecting this data consistently across a fragmented toolchain without burdening your engineering managers with manual reporting.
Jellyfish automates this process. As an Engineering Management Platform, we connect directly to your repositories, issue trackers, and CI/CD pipelines to provide a single source of truth for your platform engineering metrics.
With Jellyfish, you can:
- Automate DORA metrics tracking: Successfully track key software delivery metrics like Cycle Time, Deployment Frequency, and Change Failure Rate out of the box, giving you an immediate baseline for your platform’s performance.
- Quantify the reduction in toil: Use Resource Allocation insights to prove that your platform is working. You can visualize the shift in engineering effort away from maintenance and support tasks toward strategic roadmap work as platform adoption
- Measure adoption and impact: Compare the performance of teams using your golden paths against those who aren’t. This allows you to definitively prove that the platform is accelerating delivery and driving business value.
To learn more about Jellyfish and how it can help your engineering team be more productive and impactful, request a demo today.
FAQs
FAQs
How should product management principles guide our metric selection?
Treating your platform as a product means applying product management discipline to your internal tools. Instead of just tracking uptime, define KPIs that measure the success of your development teams, such as adoption rates and satisfaction scores. Use internal benchmarks to track progress over time and ensure the platform is delivering value to its “customers.”
Can platform metrics help prevent outages in cloud-native environments?
Yes. By closely tracking reliability metrics, platform engineers and SRE teams can identify stability risks in cloud native architectures like Kubernetes. Monitoring resource saturation and error rates allows teams to improve scalability proactively, preventing outages and minimizing downtime before it impacts users.
How do we measure if the platform is effectively streamlining the delivery process?
To see if you are successfully able to streamline the delivery process, track the cycle time of your continuous integration (CI) and continuous delivery (CD) pipelines. A successful platform should reduce the friction of shipping new features, creating a culture of continuous improvement.
How should we visualize these metrics for different stakeholders?
A centralized dashboard is critical for transparency. Product teams need visibility into their own velocity, while leadership needs high-level views of organizational health. To bridge this gap, use role-based views: enable teams to drill down into specific pipeline blockers or error logs for debugging, while providing executives with aggregated trendlines that show the platform’s overall ROI and adoption.
What metrics are essential for integrating security into the platform?
Security should be a core function of the platform, not a gatekeeper. Measure the percentage of deployments that pass automated security checks and the mean time to remediate a vulnerability. This ensures that security is embedded into the software engineering workflow without slowing down the pace of innovation.
Learn More About Platform Engineering
Learn More About Platform Engineering
- The Complete Guide to Platform Engineering
- Platform as a Product: The Foundation for Successful Platform Engineering
- When to Adopt Platform Engineering: 8 Signs Your Team is Ready
- Platform Engineering vs. DevOps: What’s the Difference?
- How to Build a Platform Engineering Team: Key Roles, Structure, and Strategy
- Understanding The Platform Engineering Maturity Model
- How to Build Golden Paths Your Developers Will Actually Use
- Best 14 Platform Engineering Tools Heading Into 2026
- 8 Benefits of Platform Engineering for Software Development Teams
- 9 Platform Engineering Anti-Patterns That Kill Adoption
- The Top Platform Engineering Skills Every Engineering Leader Must Master
- 11 Platform Engineering Best Practices for Building a Scalable IDP
- What is an Internal Developer Platform (IDP)?
About the author

Lauren is Senior Product Marketing Director at Jellyfish where she works closely with the product team to bring software engineering intelligence solutions to market. Prior to Jellyfish, Lauren served as Director of Product Marketing at Pluralsight.