In this article
Claude Code comes with built-in analytics for engineering teams. If your organization is on a Team or Enterprise plan, you’ll find them in claude.ai under Analytics > Claude Code.
If you use Claude through the API, the dashboard is in the Claude Console. Depending on the plan, you can also bring the data into your own reporting tools with Anthropic’s analytics APIs or OpenTelemetry.
Both dashboards report on adoption, accepted code, and spend. In claude.ai, you’ll also find a Value tab with estimates of productivity lift and time recovered.
One of the main limits is scope. Claude Code analytics stop at Claude Code’s own activity and the pull requests it touched, so review time, deployments, and incidents fall outside them. The Value tab’s figures are also estimates based on inputs you can adjust.
This guide explains what each analytics option measures, how the options compare, and how to connect Claude Code data to delivery outcomes.
Overview of Claude Code Usage Analytics
Overview of Claude Code Usage Analytics
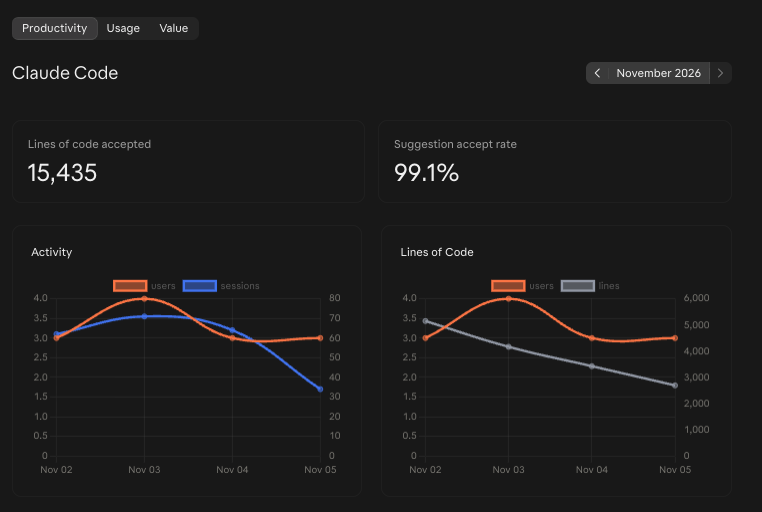
The claude.ai dashboard organizes Claude Code usage analytics into three tabs:
- Productivity shows adoption, accepted lines of code, and suggestion accept rate. With GitHub connected, it also counts the pull requests and lines of code written with Claude Code.
- Usage breaks down which tools, skills, and MCP servers developers use.
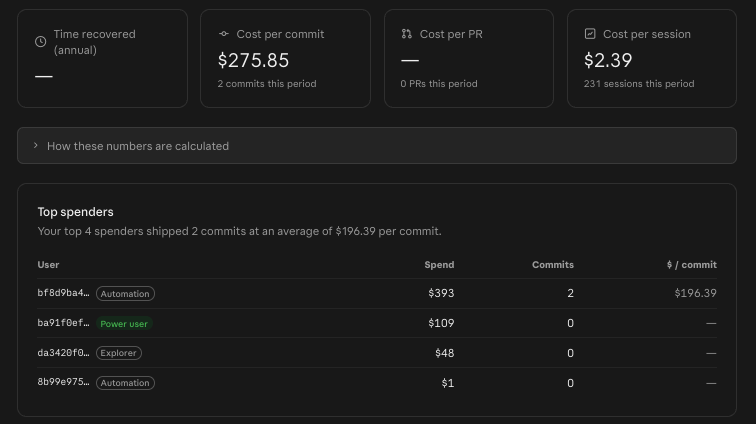
- Value estimates the return on AI-assisted development through productivity lift, annual time recovered, and cost per commit or pull request.
The Claude Code page in the Console is simpler. It shows accepted lines, accept rate, daily activity, and spend, with a per-user table for the current month.
Access to Claude Code team analytics depends on your plan.
- On Team plans, Owners and Primary Owners can open the dashboard.
- Enterprise plans extend access to Admins, though Admins can’t see spend data.
- In the Console, Developer, Billing, Admin, and Owner roles can view the Claude Code page.
The analytics APIs, OpenTelemetry, and developer tools each come with their own access rules and setup work. Our comparison of five tracking methods puts them side by side.
Jellyfish notes 💡: Native analytics stop at Claude Code. If your teams also use Cursor or GitHub Copilot, Jellyfish compares every AI coding tool with the same framework, so you can see which ones improve cycle time, throughput, and quality.
What are Software Engineering Analytics?
Read nowHow Claude Code Analytics Work
How Claude Code Analytics Work
Before you read the numbers, it helps to know how they’re produced. That includes how often each source refreshes, how Claude Code collects activity, how long the data is kept, and how GitHub attribution works.
Data aggregation and reporting freshness
Most native Claude Code analytics update once a day. That works well for usage trends and monthly cost reviews.
| Source | How current the data is |
| Built-in dashboards (claude.ai and Claude Console) | Updated daily |
| Data export for API customers (Claude Code Analytics API) | Within about an hour |
| Data export for Enterprise plans (Claude Enterprise Analytics API) | Next day for activity data, within a few hours for cost and usage |
| Live feed to your own tools (OpenTelemetry) | Close to real time |
Daily data works for most reporting, but a sudden cost spike won’t appear until the next day. Teams that want same-day cost alerts send OpenTelemetry data to a tool like Prometheus or Grafana, which takes some setup and upkeep.
Telemetry collection and local tracking
Claude Code analytics come from what happens in each session, such as edits, tool use, and token counts. They don’t include your actual code or prompts.
Claude Code also saves a log of each session on the developer’s own machine. Open-source usage trackers can read those logs to show one developer’s usage.
Related → 22 Key DevOps Metrics for Tracking Development Success
Data retention and policies
Retention covers two different kinds of data:
- Prompts and code: On Team, Enterprise, and API plans, Anthropic keeps Claude Code data for 30 days by default and doesn’t train on it unless your organization opts in. Eligible Enterprise accounts can also request zero data retention, where Anthropic doesn’t store prompts or outputs at all.
- Analytics history: The Claude Code Analytics API has no stated deletion period, and Enterprise Analytics API data goes back to January 1, 2026. OpenTelemetry keeps whatever your own backend stores.
For a pre-adoption baseline or quarter-over-quarter trends, pull the history through the APIs or OpenTelemetry. If you plan to use OpenTelemetry, set it up early, since it only records data from the day you turn it on.
GitHub integration (Beta)
The GitHub integration shows which merged pull requests include code written with Claude Code. To turn it on, a GitHub admin installs the Claude GitHub app, and an Owner enables GitHub analytics in claude.ai.
A few details help you read the results.
- Matching window: Anthropic compares each merged PR with Claude Code sessions from three weeks before to two days after the merge.
- Conservative counts: Anthropic only counts lines it’s confident Claude Code wrote, and it leaves out code developers rewrote heavily, so the totals run low.
- GitHub label: Merged PRs with Claude Code lines get a claude-code-assisted label that teams can search or use in other reports.
To use the integration, you need a Team or Enterprise plan and repositories hosted on github.com. Organizations with zero data retention can’t turn it on.
Measuring the Impact of Generative AI Coding Assistants with Data
Read nowWhat Claude Code Measures
What Claude Code Measures
Before the details, here’s a quick map of which metrics you’ll find in each dashboard and API:
| Metric | claude.ai (Team, Enterprise) | Console (API) | Analytics APIs |
| Active users and sessions | ✓ | ✓ | ✓ |
| Lines of code | Accepted | Accepted | Added and removed |
| Accept rate | Combined | Combined | Per tool |
| PRs and commits | Merged PRs, via GitHub | — | Created by Claude Code |
| Tokens and spend | Spend charts, Value tab | Daily spend | By model and user |
| Value estimates | ✓ | — | — |
Productivity and activity metrics
The Productivity tab tracks three activity signals:
- Active users show how many developers use Claude Code each day.
- Sessions measure engagement. A developer can log many sessions while rejecting most suggestions, so read them next to accept rate.
- Lines of code accepted counts the lines developers accept from Claude Code’s suggestions, including lines they delete later.
Lines accepted is the metric most likely to be misread, since a high number doesn’t show how much of that code shipped. Together, these signals give you an adoption baseline, which is the first step in productivity measurement.
Recommended → The Modern Approach to Measuring Developer Productivity
Tool accept rate
Suggestion accept rate shows how often developers accept the code changes Claude Code proposes. The dashboard shows one rate across all changes, while the Claude Code Analytics API and OpenTelemetry break it down by type of edit.
A low rate for one team can mean Claude Code lacks context about the codebase, the code is unusually complex, or the team works in a language Claude Code handles less well.
Like GitHub Copilot’s acceptance rate, it measures how much developers engage with suggestions. It doesn’t measure speed, so two developers with very different accept rates can still have the same cycle time.
How to Monitor GitHub Copilot Usage Across Your Engineering Team
Read nowCost and token tracking
Native analytics show how many tokens each model uses and what that costs. On seat-based Enterprise plans, claude.ai only shows spend above the seat allowance. Per-model costs also help you project spend as more teams adopt Claude Code and plan for it in the engineering budget.
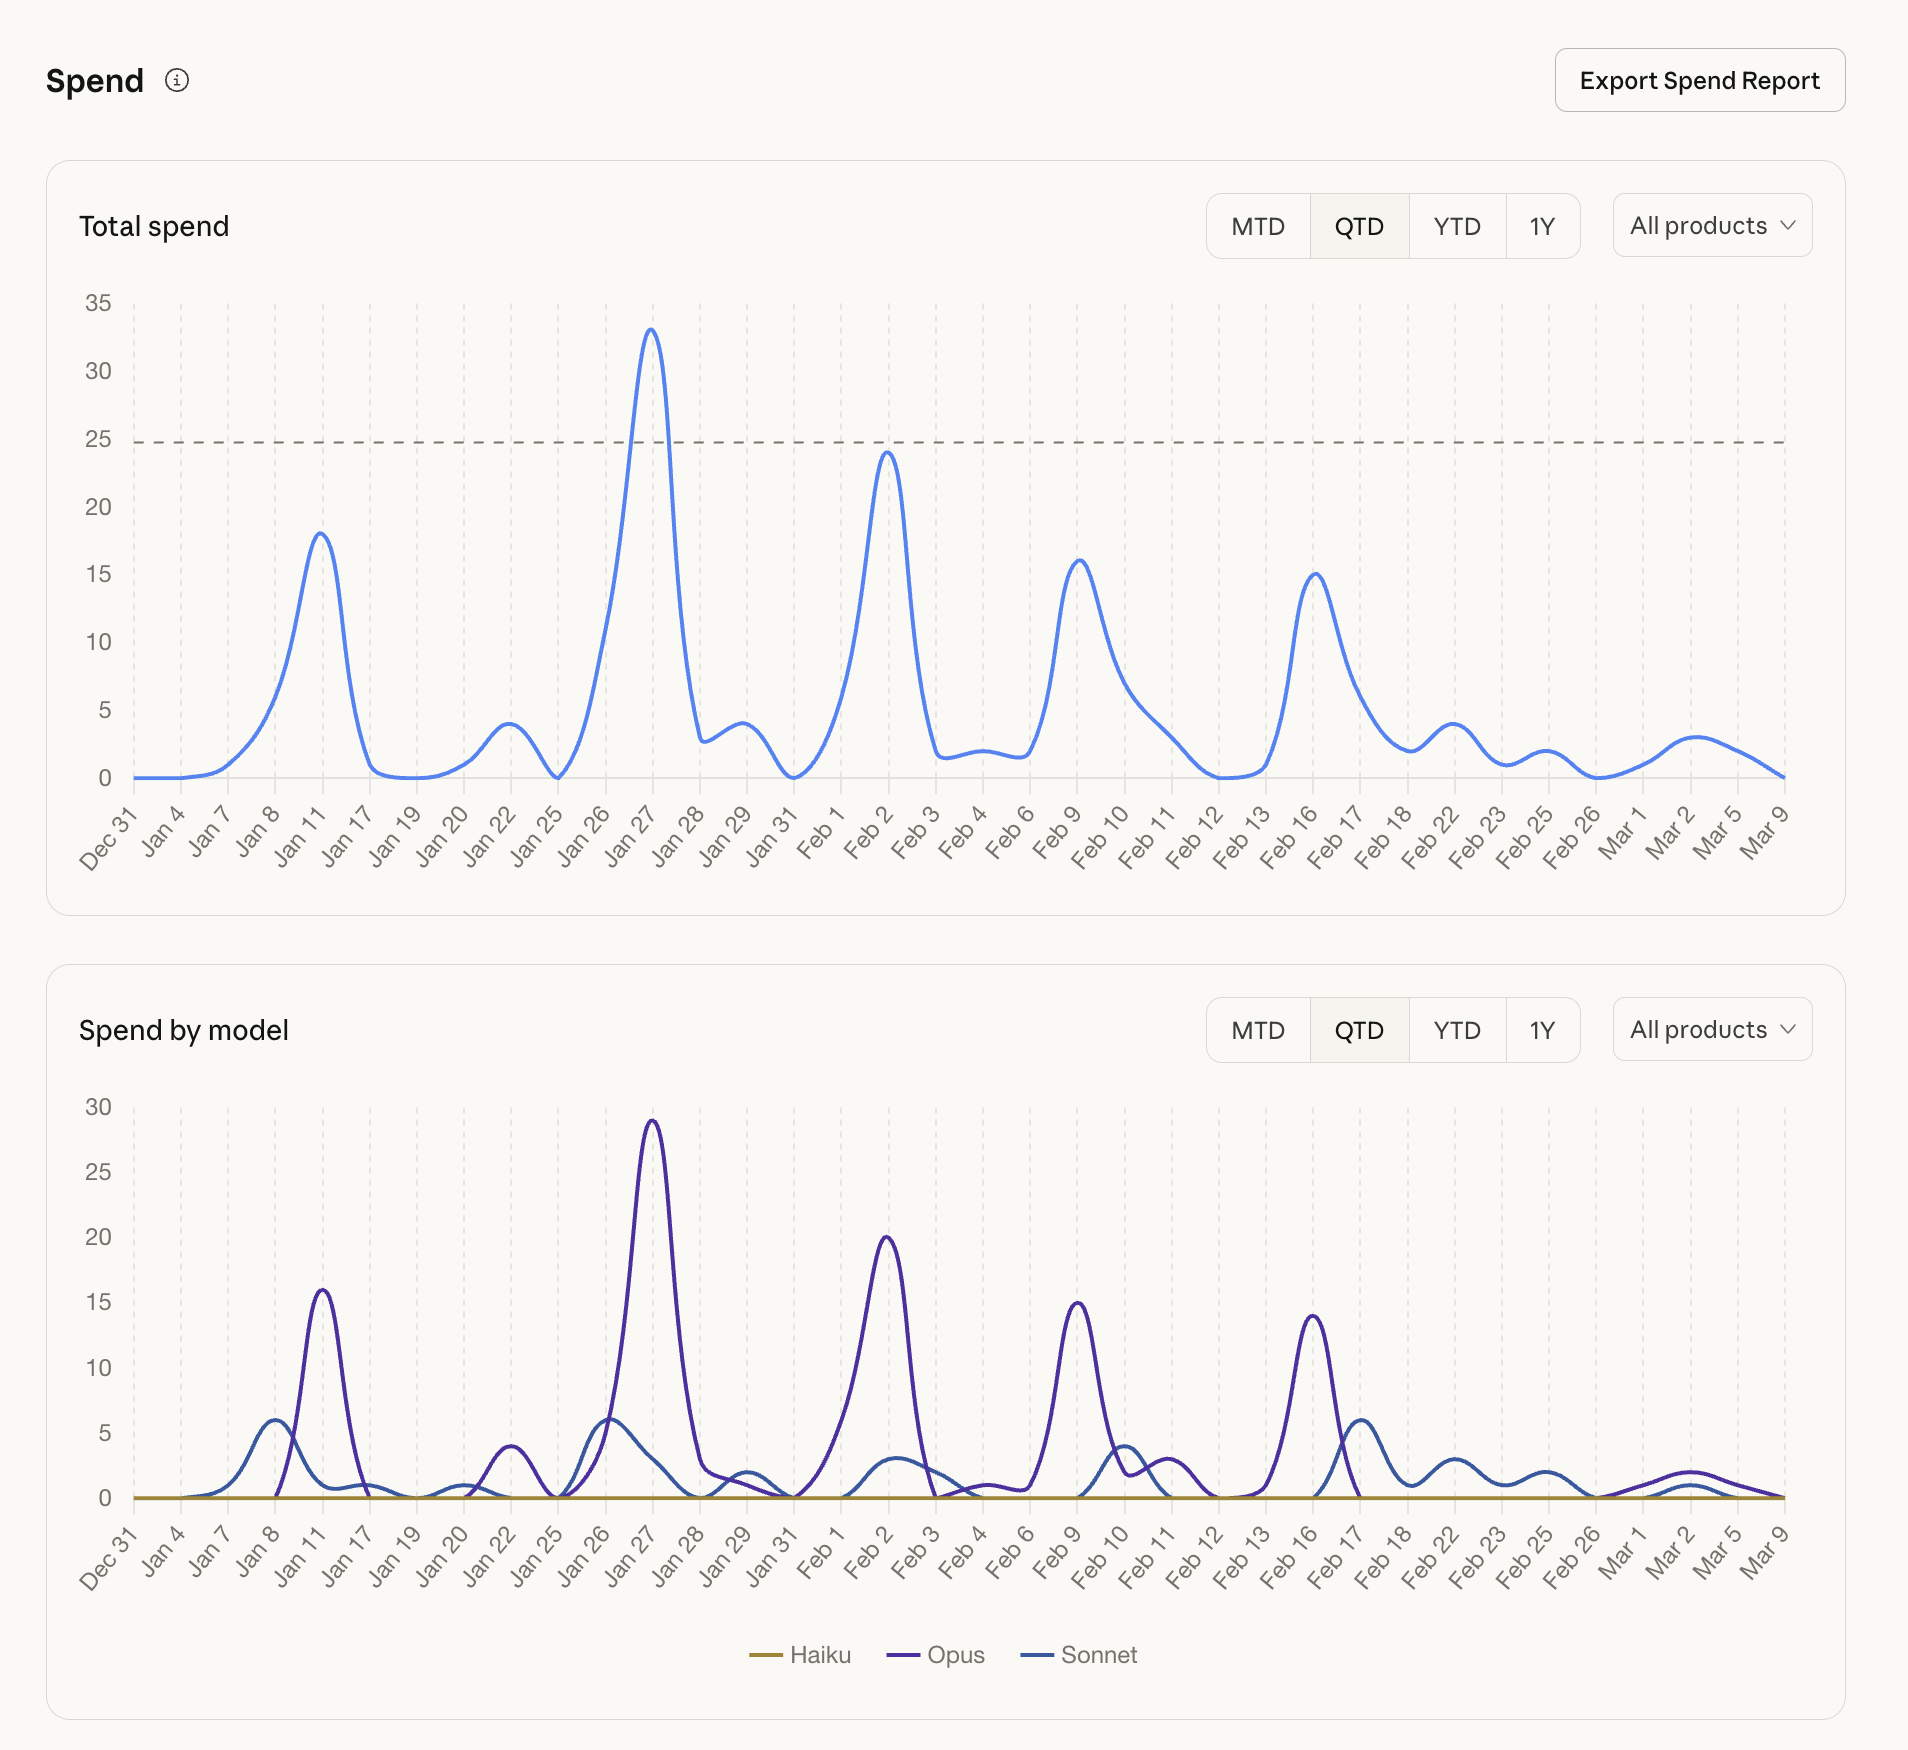
The trap is to read token volume as a productivity signal. Token usage data can point to inefficient usage patterns and show which AI-assisted workflows need optimization. If token spend climbs and delivery throughput doesn’t move, three checks help narrow down the cause.
- Who drives the spend: A spend increase may come from just a few heavy users. In claude.ai, the Value tab lists your top spenders and shows how concentrated spend is. The Console’s per-user spend table gives the same view.
- Model mix: Opus costs more than Sonnet. A cheaper default model for everyday tasks can bring spend down, as long as it handles that work without extra retries. On Enterprise plans, admins can set the default for everyone.
- Context overhead: MCP servers can use a lot of tokens, especially when their tools return large results. The Usage tab shows which MCP servers your org uses most, and developers can check what fills their own context window with the /context command.
Flat throughput can also come from slower reviews or rework later in the cycle. Token data alone won’t show that.
The 26 Most Valuable Engineering KPIs & Metrics (2026 Update)
Read nowGitHub contribution metrics (Beta)
With GitHub connected, the Productivity tab shows PRs with Claude Code, the share of merged PRs that include Claude Code lines, and PRs per user over time. These are the closest native metrics to engineering output.
PRs per user divides the merged pull requests per day by the number of daily active Claude Code users. The trend shows whether PR throughput moves with adoption, though it can’t prove that Claude Code caused the change. Comparing the same teams over time, or similar teams with different adoption levels, gives a more reliable view.
Value tab estimates
The Value tab gives you two kinds of numbers:
- Measured: Cost per commit, pull request, or session comes straight from your usage data, so you can compare it across months or teams.
- Estimated: Productivity lift and annual time recovered are based on assumptions you can adjust, and the tab shows the formula behind each one.
The estimates depend heavily on those assumptions. Before you share the results, adjust the inputs to match your own team’s numbers. Treat the output as a starting point for a first business case, and check it against delivery metrics once you have them.
What’s notably absent: None of these metrics measure delivery. Cycle time, deployment frequency, and progress on roadmap work come from systems Claude Code doesn’t see, such as Jira or Linear, CI/CD pipelines, and incident tools. To track them alongside Claude Code usage, you can connect those systems yourself or use Jellyfish, which links Claude Code usage to cycle time and throughput.
Jellyfish AI Impact
Claude Code Changed How Your Team Works. Now Change How You Measure It.
Jellyfish Shows You How5 Ways to Track Claude Code Usage
5 Ways to Track Claude Code Usage
Three of these methods give you an org-wide view, and two are for individual developers. The table compares who can use each one and how much setup it takes.
| Method | Who can use it | Best for | Setup |
| 1. Claude Code dashboards | Team, Enterprise, and Console orgs | Quick adoption and spend check-ins | None |
| 2. Analytics APIs | Console and Enterprise orgs | Custom reports and long-term history | Medium |
| 3. OpenTelemetry | Any plan or provider | Same-day alerts and Bedrock or Google Cloud usage | High |
| 4. /context command | Any developer | A quick look at one session’s context | None |
| 5. Open-source CLI tools | Any developer | Personal usage history and plan limits | Low |
1. The Claude Code analytics dashboards
The dashboards are the default starting point. Usage data needs no setup, which makes them the fastest way to check adoption and spend.
To look at individual developers, claude.ai lets you export per-user contribution data as a CSV, and the Console lists each user’s monthly spend and lines of code. Anything longer-term or more custom needs the APIs or OpenTelemetry.
2. Anthropic’s Claude Code Analytics APIs
Anthropic offers two main analytics APIs for Claude Code. Which one applies depends on whether your developers use Claude Code through the Claude Console or a Claude Enterprise plan.
| Claude Code Analytics API | Claude Enterprise Analytics API | |
| Who it’s for | API customers on the Claude Console | Claude Enterprise organizations |
| Key | Admin API key | Analytics API key (created by the Primary Owner) |
| Data | Claude Code activity and cost per user | Activity across all Claude products, plus spend on usage-based plans |
| History | No stated limit | From January 1, 2026 |
Team plans don’t have API access, so OpenTelemetry is the way to get raw data on those plans.
Anthropic added a third option for spend on October 29, 2026, the Usage and Cost Analytics API, which is still in beta. Console and Enterprise organizations can use it to see Claude Code spend by user or model, with history back to January 2026.
3. OpenTelemetry and developer observability tools
OpenTelemetry sends Claude Code data to monitoring tools your team already uses, such as Prometheus or Grafana. Admins configure it with a few settings and can apply them to every developer.
It’s the only native option with near-real-time data, and it also captures usage through Amazon Bedrock or Google Cloud.
The trade-off is upkeep. Your team maintains the pipeline, and data only starts from the day you turn it on. That’s easier for teams that already have an observability stack.
4. The /context slash command
Developers can type /context in a Claude Code session to see how much of the context window each part of the session uses, such as MCP tools, memory files, and messages. It helps them spot a heavy MCP setup or an oversized file before it eats into the session.
The view covers one session at a time and keeps no history, so it doesn’t help with team reporting.
5. Open-source CLI tools
Two open-source tools help developers track their own usage from the local JSON logs Claude Code saves on their machine.
- ccusage, installed through npm, creates daily and monthly usage reports.
- Claude Code Usage Monitor, written in Python, predicts when a developer will hit their plan’s usage limit.
By default, both only see one machine’s data, so they suit individual developers on Pro or Max plans more than team reporting.

Get a unified view of how AI shapes work
Jellyfish makes it easy to integrate your full AI tech stack
Limitations of Claude Code Usage Analytics
Limitations of Claude Code Usage Analytics
No analytics for individual Pro and Max plans
Claude Code analytics are only available on Team, Enterprise, and API plans. Developers on Pro or Max can check their own usage with /context or local CLI tools, but there’s no org-wide view.
If you pilot Claude Code on individual subscriptions, you won’t have central data to judge the results. You’ll have to start the pilot on a Team plan, or have developers send OpenTelemetry data to a shared backend from the first day.
Blind spots across Bedrock and Vertex deployments
Many enterprises use Claude through Amazon Bedrock, Google Cloud, or Microsoft Foundry for procurement or compliance reasons. Claude Code usage on those platforms doesn’t show up in the Claude Code dashboards or the Claude Code Analytics API.
That can skew your view. A team that uses Claude Code heavily through Bedrock may look inactive, while a smaller team on the Claude API looks like the main adopter.
Anthropic’s newer Usage and Cost Analytics API covers some Google Cloud and AWS setups, but not Bedrock. To see usage across every provider, you’ll have to combine OpenTelemetry with your cloud provider’s billing data.
No real-time API data
None of Anthropic’s dashboards or analytics APIs work in real-time. That’s enough for most reporting use cases, but same-day cost alerts depend on OpenTelemetry and the infrastructure to maintain it.
Context pollution from MCP servers
MCP servers let Claude Code pull in data from external tools. By default, Claude Code now loads MCP tool definitions only when Claude needs them, which keeps their upfront cost low. Their results can still be large, though, up to 25,000 tokens each by default.
Those tokens count toward the same totals as coding work, and native analytics don’t separate the two. A team that relies on MCP can look more expensive than a team doing similar work with fewer integrations.
That makes it hard to compare how efficiently different AI-assisted workflows use tokens, and neither the Usage tab nor /context shows MCP token use across the team.
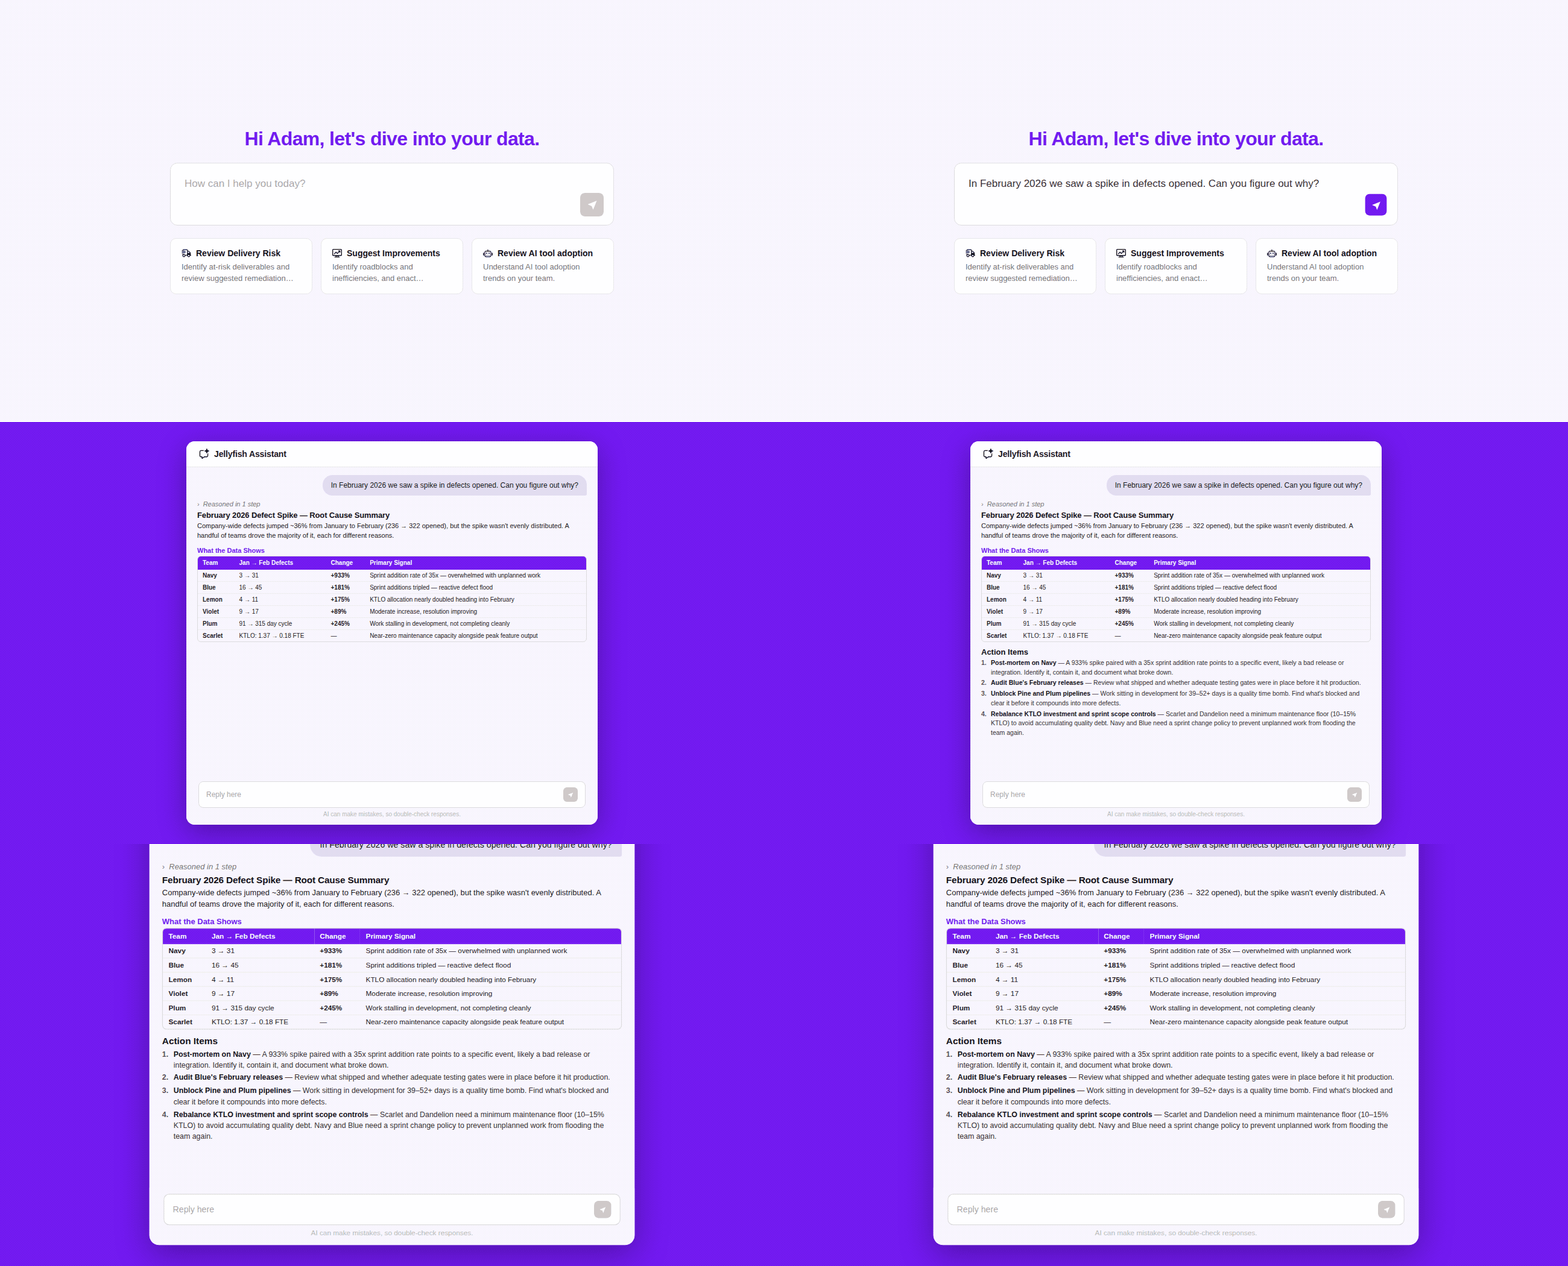
| Jellyfish Assistant is your AI-powered guide that proactively surfaces insights and delivers trusted answers based on your org’s context.
Discover how top engineering teams use Jellyfish to get proactive insights and guidance to improve R&D efficiency. |
Connecting Claude Code Analytics to Business Outcomes
Connecting Claude Code Analytics to Business Outcomes
Claude Code generates usage, contribution, and cost data, while your delivery data is kept in tools like Jira, Git, CI/CD pipelines, and incident systems. Anthropic links Claude Code usage to merged pull requests, but there’s no native connection to the rest of that delivery data.
Why manual correlation breaks down
The instinct most engineering leaders have when they first hit this problem is to build the bridge manually. For example, export token data from Anthropic’s dashboard or API, pull cycle time from Jira, drop both into a spreadsheet, and look for a correlation.
This approach works, but it doesn’t scale. Across multiple teams, quarters, and adoption cohorts, someone has to own the exports, maintain the schema, reconcile the time windows, and rebuild the analysis every time leadership asks a follow-up question.
What the connection needs to look like
To link Claude Code usage to delivery outcomes, you need four things in the same system, updated continuously and without manual work.
Usage must be directly connected to delivery outcomes
A high acceptance rate shows that developers engage with Claude Code. To see business impact, look at whether the teams that use it most effectively also improve delivery metrics like cycle time and change failure rate.
Two reports side by side only suggest a relationship. The system should show where Claude Code usage is highest, which delivery outcomes changed, and whether those changes hold over time.
Visibility must exist at the team level
Company-wide numbers often hide what’s happening in individual teams. A strong average can come from one or two high-performing teams while the rest of the organization struggles with low adoption or weak delivery.
Compare high-adoption and low-adoption teams over the same period to see where delivery performance differs and where your adoption plan needs adjustment.
Recommended → GitHub Copilot ROI: How to Measure Team Adoption and Productivity
Historical data must extend beyond short retention windows
Budget approvals, enterprise renewals, and expansion decisions depend on trends, such as pre-adoption baselines and quarter-over-quarter changes in usage and delivery.
Anthropic’s APIs can return months of Claude Code history, but that history only helps once it’s stored next to delivery data for the same period. Without that continuity, every ROI conversation starts from zero, and teams rebuild the same justification again and again.
The data must translate into business language leadership understands
Engineering teams look at pull request throughput, review speed, and deployment frequency. Executives care about different outcomes.
- A CFO wants to understand cost per deployment and output per engineer.
- A CEO wants to see whether feature delivery is accelerating and time-to-market is improving.
The same Claude Code usage data must support both conversations. If you have to explain the link between token spend and business outcomes by hand every budget cycle, the investment becomes harder to defend. A strong measurement system makes that translation automatic and presents usage data in operational and financial terms.
What are DORA metrics? And Why Are They So Important?
Read nowMeasure Claude Code Usage & Impact Across the SDLC with Jellyfish
Measure Claude Code Usage & Impact Across the SDLC with Jellyfish
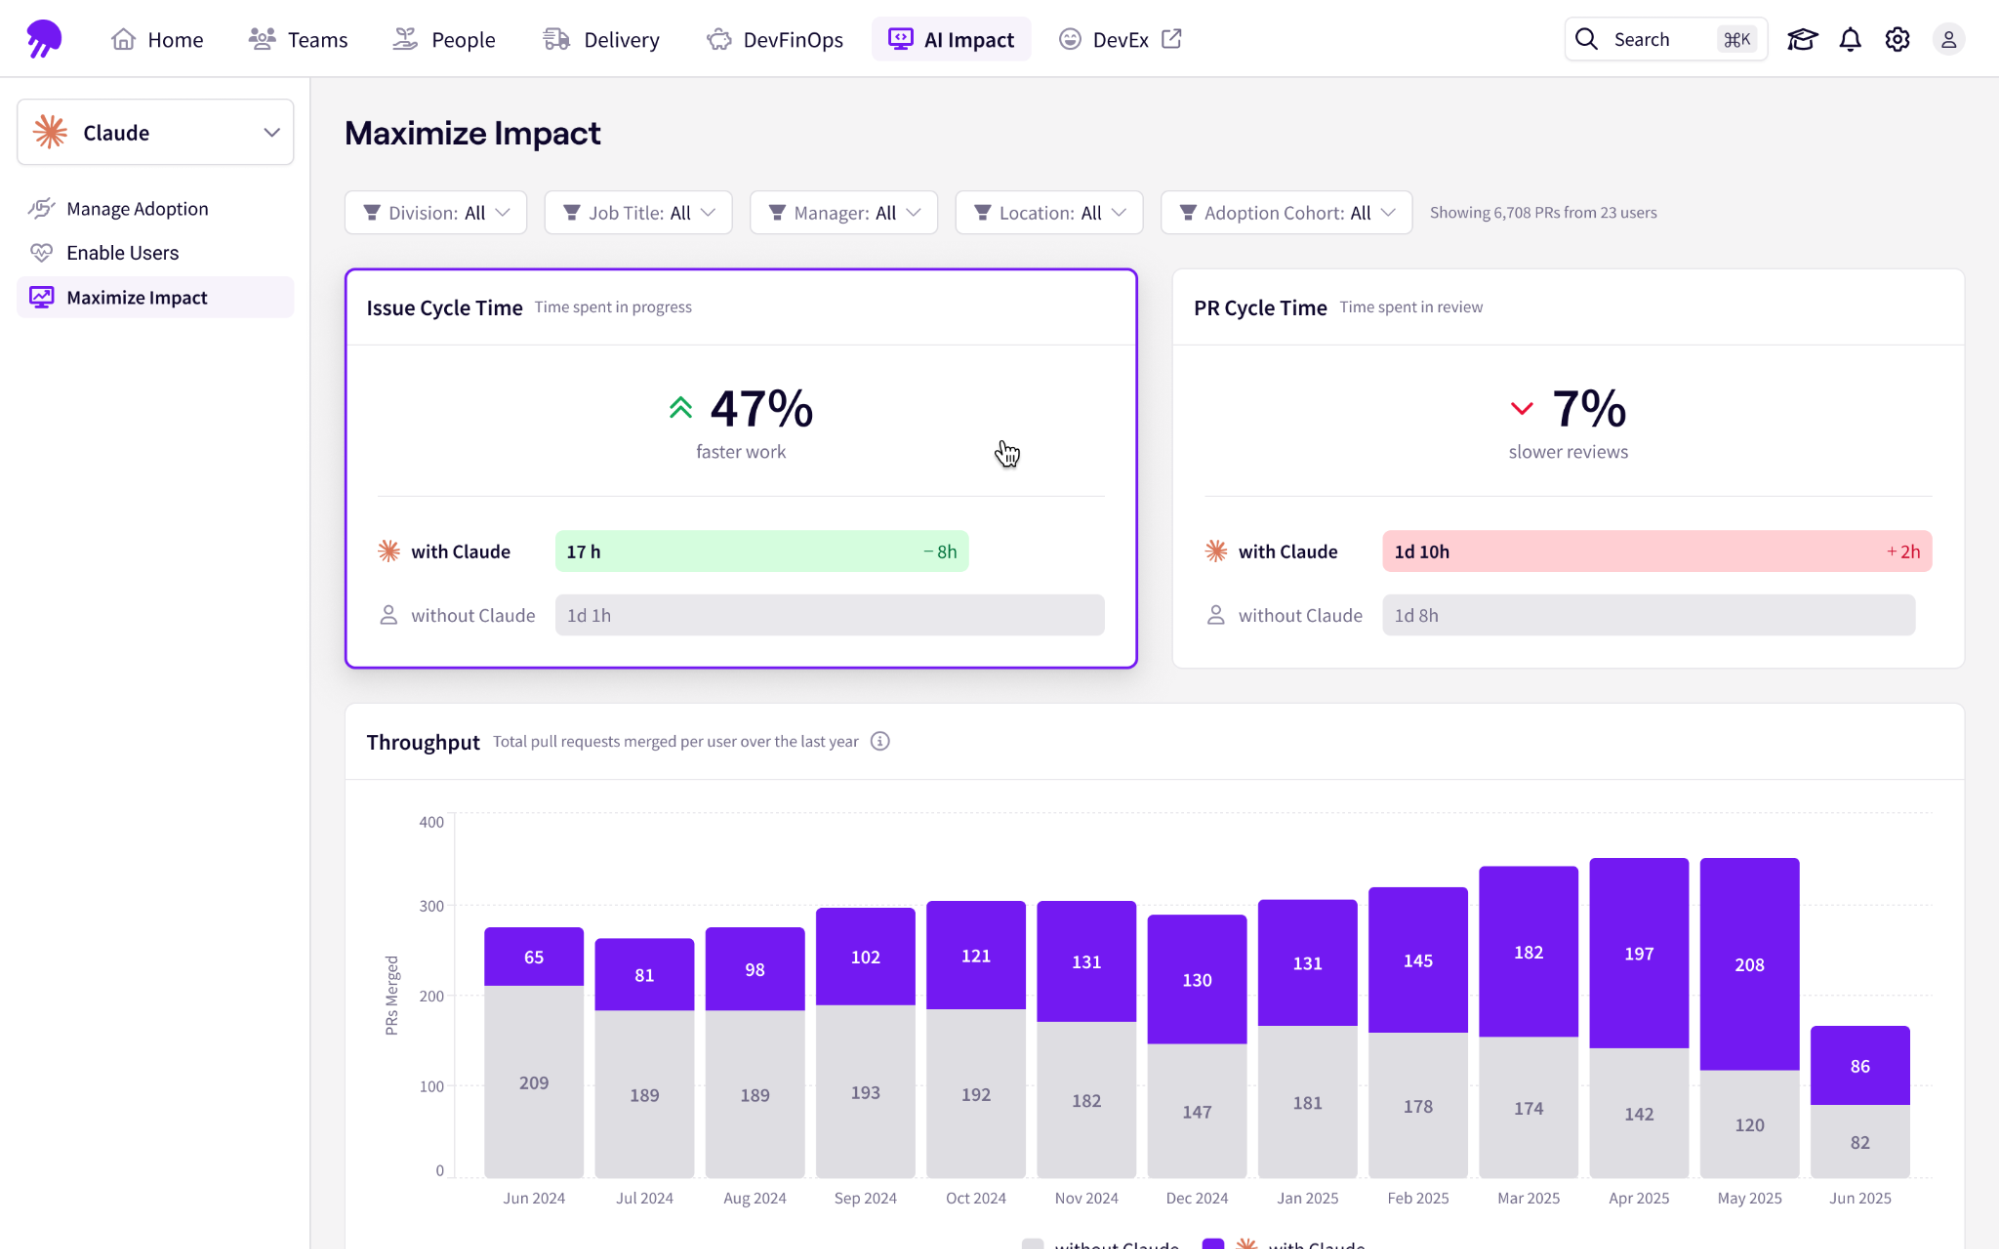
Jellyfish connects Claude Code usage to your issue trackers, repositories, and CI/CD pipeline, so you can see adoption and delivery outcomes in one view.
The dashboard above shows what that looks like. Issues worked with Claude move through development 47% faster, but PR reviews for the same work take 7% longer, which suggests review capacity hasn’t kept pace. Anthropic’s analytics would count the extra PRs without showing the slower reviews.
This helps you:
- Tie activity to delivery: Link Claude Code usage to Jira and your codebase to see whether adoption speeds up feature delivery.
- Downstream quality: Compare PR cycle time and quality signals for work with and without AI, so you know when more generated code slows reviews or creates rework.
- Team benchmarks: Filter by adoption cohort, team, or repo to compare teams at different adoption levels without rebuilding the ROI analysis every quarter.
- Spend against output: Jellyfish tracks token spend next to PR throughput and uses year-to-date and projected spend to support budget forecasts.
- Where saved time goes: See how AI changes the share of engineering time spent on roadmap work, innovation, and KTLO.
Jellyfish pulls from tools your team already uses, so adoption data appears within days and delivery trends within the first sprint.
Jellyfish has helped our leaders gain insights into engineering details that were previously unavailable. The ability to view insights at the portfolio level or drill into any level of the taxonomy is very powerful.
Ellen Yudt, VP, Engineering & Technology PMO
Read customer story → How Blue Yonder saves 20 hours monthly on engineering cost capitalization
Most Claude Code ROI Conversations Stall Here.
Yours Doesn’t Have To. See why engineering leaders love Jellyfish.
Get a DemoAbout the author

Lauren is Senior Product Marketing Director at Jellyfish where she works closely with the product team to bring software engineering intelligence solutions to market. Prior to Jellyfish, Lauren served as Director of Product Marketing at Pluralsight.