In this article
Software engineering analytics transforms raw development data into actionable insights, empowering engineering leaders to optimize team performance, enhance software quality, and accelerate delivery.
This guide provides a comprehensive walkthrough: defining core concepts, contrasting with general data analytics, exploring real-world examples (from Git to CI/CD), detailing essential metrics, and reviewing top analytics tools.
Learn how to make data-backed decisions that lead to more efficient processes and impactful engineering outcomes.
Definition of Software Engineering Analytics
Definition of Software Engineering Analytics
Software engineering analytics is the systematic collection, analysis, and interpretation of data from the software development lifecycle. This data-driven approach provides critical insights into engineering activities, team performance, and product quality, aiming to enhance overall productivity, improve software quality, and support informed decision-making.
Software engineering analytics leverages a diverse set of data sources and metrics, including code repository activity, project management system data, CI/CD pipeline performance, code quality assessments, defect trends, team productivity indicators, and operational telemetry.
By offering a quantitative and objective perspective on the software development lifecycle, these analytics empower teams to identify bottlenecks, measure progress against goals, optimize workflows, and make strategic, data-driven decisions.
Ultimately, leveraging software engineering analytics enables organizations to refine their development practices, consistently deliver high-quality software, and achieve project and business objectives more effectively.
Data Analytics vs Software Engineering Analytics
Data Analytics vs Software Engineering Analytics
While both software engineering analytics and data analytics involve extracting valuable insights from data, their core focus, primary objectives, and operational domains differ significantly.
Software Engineering Analytics:
- Domain: Centers on data and metrics generated throughout the software development lifecycle (SDLC), encompassing activities like coding, testing, deployment, and ongoing maintenance.
- Objective: To optimize the software development process itself by enhancing team productivity, improving code and product quality, and increasing operational efficiency. This involves analyzing metrics such as code complexity within a given function or module, defect rates, development cycle times, and team performance
- Data sources: Primarily draws data from the software development toolchain, including version control systems (e.g., GitHub, GitLab), issue trackers (e.g., Jira), CI/CD pipelines, code analysis tools, and application performance monitoring systems.
- Examples: Measuring code churn to assess stability, identifying bottlenecks within the development pipeline, tracking DORA (DevOps Research and Assessment) metrics, or analyzing the effectiveness of code review
Data Analytics:
- Domain: A broad field applicable across numerous sectors such as finance, marketing, healthcare, and manufacturing. It involves examining diverse datasets to extract insights and inform decision-making within these specific contexts.
- Objective: To uncover patterns, identify trends, and derive actionable insights from data. Applications include predicting customer behavior, optimizing supply chain logistics, conducting market research, or improving business processes.
- Data Sources: Utilizes a vast array of data sources tailored to the domain and analytical objectives, including customer databases, web analytics, IoT sensor data, social media platforms, public datasets, and many open-source intelligence feeds.
- Examples: Forecasting stock market trends using historical data, segmenting customers for targeted marketing initiatives, analyzing patient records to enhance healthcare outcomes, or optimizing retail inventory based on sales patterns.
Both disciplines leverage data analysis to generate insights, yet they diverge significantly in their specific domains, core objectives, typical data sources, and primary application areas.
Software engineering analytics is highly specialized, targeting the optimization of software development, whereas data analytics offers a versatile approach applicable across a multitude of industries and functional domains.
Examples of Engineering Analytics
Examples of Engineering Analytics
Engineering analytics are applied in diverse ways to address specific challenges and improve outcomes. Notable examples include:
Git Analytics
Git analytics focuses on extracting insights from data in Git version control repositories to understand development patterns, team collaboration, code evolution, and workflow efficiencies.
Key concepts include:
- Code evolution tracking: Analyzing how the codebase changes, including growth, refactoring, and areas of high activity.
- Developer workflow analysis: Examining commit frequencies, branching strategies, and pull/merge request patterns.
- Collaboration insights: Assessing interactions through code reviews, comment volume, and integration speed.
- Contribution patterns: Identifying key contributors and potential knowledge silos.
Key metrics derived from Git data:
- Commit throughput: Number of commits over a defined period.
- Code churn: Rate of code addition, modification, or deletion.
- Pull Request (PR) / Merge Request (MR) cycle time: Duration from PR creation to merge.
- Review Turnaround Time (TAT): Speed of PR reviews.
- Lead time for changes: Time from first commit to deployment.
- Impact/Complexity scores: Measures derived from the size and scope of changes.
How does it drive improvement?
- Optimizing workflows: Identifying bottlenecks in PR cycle times for process adjustment.
- Enhancing code stability: Using high churn data to predict bug-prone areas for proactive refactoring.
- Improving team collaboration: Balancing review workloads based on interaction data.
- Mitigating knowledge silos: Identifying components with low contributor overlap for knowledge sharing.
Project Management Analytics
Project management analytics applies data analysis to information from project management tools to monitor progress, manage risks, optimize resource allocation, and improve software project delivery predictability.
Key concepts include:
- Agile metrics utilization: Tracking sprint velocity, lead/cycle times, and workflow
- Work item tracking: Analyzing the lifecycle of tasks, bugs, and features.
- Resource planning and forecasting: Using historical data to estimate development effort and plan capacity.
- Risk and impediment identification: Surfacing blocked or delayed tasks.
Key metrics derived from project management data:
- Sprint velocity/throughput: Amount of work completed per iteration.
- Burndown/Burnup charts: Visual tracking of work against time.
- Cycle time: Time for a work item to move through a specific workflow
- Lead time: Total time from work item creation to completion.
- Bug resolution rates: Speed at which bugs are fixed.
- Cumulative Flow Diagrams (CFD): Visualization of work in progress and bottlenecks.
How does it drive improvement?
- Increasing delivery predictability: Using velocity trends to forecast completion dates and adjust scope or resources.
- Identifying bottlenecks: Using CFDs or cycle time reports to pinpoint and address workflow
- Improving sprint planning: Leveraging historical velocity for realistic sprint
- Enhancing stakeholder communication: Providing data-backed updates on project status.
CI/CD Pipeline Analytics
CI/CD (Continuous Integration/Continuous Delivery/Deployment) analytics analyzes data from automated build, test, and deployment pipelines to optimize the speed, stability, and efficiency of software delivery.
Key concepts include:
- Pipeline performance monitoring: Tracking the duration, success rate, and stability of CI/CD
- Feedback loop optimization: Ensuring rapid and actionable feedback on code changes.
- Deployment health: Measuring deployment frequency, success, and recovery time from failures.
- DORA metrics application: Utilizing Deployment Frequency, Lead Time for Changes, Mean Time to Restore Service, and Change Failure Rate to gauge performance.
Key metrics derived from CI/CD data:
- Deployment Frequency (DF): How often code is deployed.
- Lead Time for Changes (LTFC): Median time from commit to production.
- Change Failure Rate (CFR): Percentage of deployments causing production failures.
- Mean Time To Restore (MTTR) service: Time to recover from a production failure.
- Build success rate: Percentage of successful CI builds.
- Build duration: Time for pipeline stages or the entire pipeline to complete.
- Test flakiness: Percentage of tests yielding inconsistent results.
How does it drive improvement?
- Accelerating software delivery: Identifying and optimizing slow pipeline stages based on duration metrics.
- Improving release quality: Using CFR to investigate and enhance testing or deployment strategies.
- Shortening recovery times: Analyzing MTTR to refine incident response and rollback procedures.
- Increasing developer productivity: Ensuring fast, reliable pipelines to reduce developer wait times.
Incident Management Analytics
Incident management analytics analyzes data from monitoring, alerting, and incident tracking tools to improve system uptime and the effectiveness of incident detection, response, and resolution.
Key concepts include:
- Service reliability assessment: Understanding the frequency, duration, and impact of service disruptions.
- Incident lifecycle analysis: Examining all stages from detection to resolution and post-mortem.
- Root cause identification: Systematically finding underlying causes to prevent recurrence.
- Alert optimization: Reducing alert noise and ensuring critical alerts are actionable.
Key metrics derived from incident management data:
- Mean Time To Acknowledge (MTTA): Average time from alert to acknowledgment.
- Mean Time To Resolve (MTTR): Average time to fix an issue and restore service.
- Incident count/volume: Number of incidents by severity or service.
- Service availability/uptime: Percentage of time a service is operational.
- Alert fatigue metrics: Ratio of actionable vs. non-actionable alerts.
- Escalation rate: Frequency of incident escalation to higher support tiers.
How does it drive improvement?
- Minimizing downtime: Using MTTR and incident frequency to highlight problem areas and guide preventative actions.
- Speeding up incident response: Analyzing MTTA and escalation rates to refine on-call processes.
- Preventing recurring issues: Using trend analysis of incident causes to implement long-term fixes.
- Optimizing alerting: Reducing alert noise to ensure focus on genuine issues.
Code Analytics
Code analytics focuses on analyzing source code and related metadata from static analysis tools or code reviews to assess and improve code quality, maintainability, security, and identify technical debt.
Key concepts include:
- Code quality assessment: Measuring complexity, readability, and adherence to standards.
- Technical debt quantification: Identifying and measuring code sections that impede future development.
- Security vulnerability detection: Analyzing code for common security flaws.
- Test coverage adequacy: Assessing the extent of automated test coverage.
Key metrics derived from code analysis:
- Cyclomatic complexity: Measure of independent paths through code.
- Code coverage: Percentage of code lines/branches executed by tests.
- Static analysis warnings/violations: Issues identified by tools, categorized by severity.
- Duplication percentage: Amount of repeated code.
- Maintainability Index/Technical Debt Ratio: Composite quality scores.
- Security vulnerabilities count: Number of identified security weaknesses.
How does it drive improvement?
- Proactively improving code quality: Using automated tool scans to flag and fix issues early.
- Managing technical debt: Visualizing technical debt to prioritize refactoring efforts.
- Enhancing software security: Tracking and remediating vulnerabilities.
- Improving developer understanding: Using complexity metrics to guide study of the codebase.
- Standardizing coding practices: Encouraging consistency via automated checks.
Software Engineering Metrics
Software Engineering Metrics
Effective software engineering relies on metrics that inform development, guide maintenance, and drive project success. Tracking relevant metrics is foundational to generating actionable engineering analytics and continuously improving team performance and product value.
Metrics for Investment and Capacity
The engineering team often represents a significant organizational investment, and tracking these metrics ensures this investment aligns with strategic priorities and that an appropriate team size and skill set is maintained.
- Resource allocation breakdown: Percentage of engineering effort dedicated to strategic initiatives, new product development, feature enhancements, technical debt reduction, and ongoing maintenance/support.
- Hiring velocity & new hire ramp-up time: The average time to fill open engineering positions and the time it takes for new engineers to reach full productivity.
- Project cost variance: The difference between the budgeted cost and the actual cost for engineering projects or initiatives.
- Team capacity vs. demand: The available engineering capacity (e.g., in story points or ideal days) versus the backlog of planned work.
Metrics for Quality
Quality metrics help ensure the software consistently delivers value to customers by tracking its stability, reliability, and adherence to standards.
- Defect density: The number of confirmed defects identified in a component or system during development or testing, typically normalized per KLOC (thousand lines of code) or per feature.
- Escaped defect rate: The number of bugs or defects discovered by users in the production environment after release.
- Mean Time to Resolution (MTTR) for defects: The average time taken to fix bugs from the moment they are reported until the fix is deployed.
- System uptime / Availability: The percentage of time the software system or service is operational and accessible to users, often defined by SLAs (Service Level Agreements).
- Change Failure Rate (CFR): The percentage of deployments to production that result in a degradation of service or require remediation (a key DORA metric).
- Test coverage: The percentage of the codebase that is covered by automated tests (e.g., unit, integration, end-to-end tests).
Metrics for Process
These metrics assess the efficiency, speed, and predictability of the software development lifecycle, helping teams set realistic expectations, align efforts, and improve execution.
- Cycle Time: The average time it takes for a work item (e.g., user story, task, bug fix) to move from the ‘in progress’ state to ‘completed’ or ‘deployed’.
- Lead Time for Changes (LTFC): The median time it takes for a code commit to be deployed into production (a key DORA metric).
- Deployment Frequency (DF): How often the team deploys code to production, indicating the pace of delivery (a key DORA metric).
- Pull Request (PR) cycle time: The average time taken from when a pull request is opened until it is merged, including review and rework time.
- Work In Progress (WIP): The number of tasks or work items being actively worked on simultaneously by a team or individual, helping to identify potential bottlenecks if too high.
- Build success rate: The percentage of automated builds in the CI/CD pipeline that complete successfully without errors.
Metrics for Deliverable Progress & Forecasting
These metrics track and communicate the team’s advancement towards creating value, fostering alignment across the organization, and improving predictability.
- Burndown and Burnup charts: Visual representations of work remaining versus time (burndown) or work completed versus time (burnup) for a sprint, release, or project.
- Feature/Epic completion rate: The percentage of planned features, epics, or user stories completed within a defined period (e.g., sprint, quarter, release).
- Team velocity: The average amount of work (typically measured in story points or task counts) a development team can complete during an iteration or sprint.
- Predicted vs. actual delivery dates: A measure of forecast accuracy, tracking the consistency with which the team meets its estimated delivery timelines.
- Scope change rate: The percentage of work added, removed, or modified after a sprint or project has commenced, indicating stability of requirements.
5 Software Development Analytics Tools for Engineering Managers
5 Software Development Analytics Tools for Engineering Managers
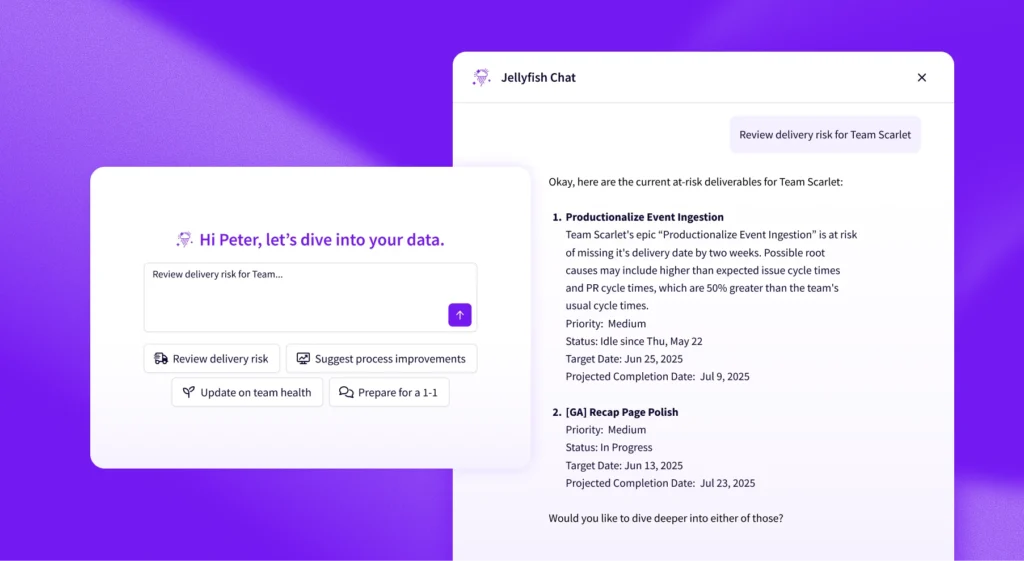
1. Jellyfish
Jellyfish is an engineering management platform designed to provide visibility into engineering execution and align technical work with strategic business objectives.
It helps managers understand how engineering resources are allocated and how team efforts contribute to company goals, facilitating data-driven conversations about planning, investment, and impact.
Key features:
- Resource allocation analysis: Provides valuable insights into how engineering time and effort are distributed across different projects, product lines, types of work (e.g., new features, tech debt, bug fixes), and strategic initiatives.
- Work breakdown structure: Offers visibility into the categorization of engineering work, such as planned versus unplanned tasks or roadmap versus sustaining engineering.
- Project and initiative tracking: Enables monitoring of progress for key engineering projects and strategic business initiatives from an engineering resource perspective.
- Investment profiles: Helps visualize where engineering capacity is being spent relative to stated business priorities and objectives.
- Data aggregation from multiple sources: Integrates with various development tools (Git, Jira, etc.) to create a unified view of engineering activities.
- Reporting and dashboards: Delivers customizable reports and dashboards to communicate engineering performance and alignment to stakeholders.
Why do companies choose Jellyfish?
- Understand where teams invest time and find areas for improvement. Jellyfish is constantly improving how you can view allocations, progress against deliverables, and team health metrics. [*]
- Accommodate a complex team structure. The “Hierarchy” feature in Jellyfish allowed us to configure our Teams and all other levels of the organization in a way that worked best for us, utilizing some unique JIRA setup and methods. Because we were able to do this initial breakout, we can present metrics to management in all the various ways they require. [*]
- Gain visibility and improve alignment for product & engineering teams. Jellyfish clarifies how our engineering initiatives align with the company’s strategic objectives. The integration with Jira and Git is smooth, and the visualizations greatly assist in conveying priorities among stakeholders. We can effortlessly track the time allocated to customer work, technical debt, and innovation. Additionally, it serves as a valuable tool for quarterly planning and post-mortem evaluations. [*]
2. LinearB
LinearB is a software delivery intelligence platform focused on helping engineering teams improve their efficiency and predictability by providing visibility into DORA metrics, cycle times, and workflow bottlenecks.
It also offers features to automate parts of the development process and support developer growth.
Key features:
- DORA metrics tracking: Offers real-time measurement and visualization of Deployment Frequency, Lead Time for Changes, Mean Time to Restore (MTTR), and Change Failure Rate.
- Cycle time analysis: Breaks down the software delivery lifecycle into distinct phases (e.g., coding time, pickup time, review time, deploy time) to pinpoint bottlenecks.
- Workflow automation (via gitStream): Allows engineering teams to create custom, automated rules and actions within their Git workflows to streamline processes like pull request handling and merging.
- Team goals and benchmarks: Facilitates setting, tracking, and comparing team performance against internal or industry benchmarks.
- Developer productivity and experience insights: Provides data points to help managers understand team dynamics, identify areas for coaching, and improve the overall developer experience.
- Project delivery forecasting: Utilizes historical data to help predict potential project completion timelines.
- Shadow work detection: Identifies work being done that isn’t tied to project management system tickets.
3. Waydev
Waydev is an engineering analytics platform that provides visibility into development team output and performance by analyzing data from Git repositories and project management tools. It focuses on automating the collection of metrics to help managers understand activity levels, project velocity, and adherence to DORA metrics.
Key features:
- Developer activity tracking: Provides metrics on developer output such as commit volume, code churn, impact, and efficiency without requiring manual input.
- DORA metrics and cycle time monitoring: Tracks key software delivery performance indicators to assess team velocity and process efficiency.
- Project velocity and sprint reports: Helps monitor progress on sprints and projects, identify risks, and manage team capacity.
- Pull request analysis: Offers dashboards for visibility into pull request throughput, review times, and potential bottlenecks in the review process.
- Team and individual performance summaries: Delivers reports that summarize contributions and activity patterns for both teams and individual developers.
- Customizable dashboards and reporting: Allows users to tailor views and reports to their specific needs.
- Benchmarking: Enables comparison of team performance against defined standards or historical data.
4. Pluralsight Flow
Pluralsight Flow is an engineering insights platform that helps managers understand and improve their software development workflows and team effectiveness. It provides data-driven insights for coaching, identifying process bottlenecks, and facilitating productive conversations about engineering work.
Key features:
- Workflow visualization: Offers visual representations of how work moves through the development process, highlighting patterns, efficiencies, and areas for improvement.
- Core engineering metrics: Tracks fundamental metrics such as commit frequency, coding days, impact of code changes, unreviewed pull requests, and time to merge.
- Team health and collaboration insights: Provides data points that can indicate team engagement levels, potential for burnout, or effectiveness of collaboration patterns.
- Retrospective and comparative reporting: Allows teams to compare their metrics across different time periods or sprints to support continuous improvement.
- Investment profile analysis: Gives visibility into how engineering effort is distributed across various work categories, projects, or epics over time.
- Data for 1:1s and coaching: Equips managers with objective data to support check-ins, performance discussions, and targeted coaching for individual developers.
5. Code Climate Velocity
Code Climate Velocity is a software engineering intelligence (SEI) platform that aims to provide engineering leaders with the data and insights needed to make informed decisions, streamline software delivery, and improve team health and productivity. It focuses on a broad range of metrics, including DORA and developer-centric insights.
Key features:
- DORA metrics and delivery pipeline analysis: Provides comprehensive tracking of DORA metrics along with deeper insights into the efficiency of the software delivery
- Bottleneck identification: Helps pinpoint inefficiencies, wait times, and areas where work is slowing down within development workflows.
- Team health and productivity metrics: Offers visibility into aspects like developer workload, focus time, collaboration patterns, and potential indicators of burnout.
- Data-driven coaching and development: Supplies objective data to support managers in coaching their team members and identifying opportunities for skill development and growth.
- Predictability and forecasting support: Uses historical performance data to help improve the understanding of team capacity and the predictability of delivery.
- Customizable reporting and dashboards: Allows for tailored views to track progress against specific engineering initiatives and KPIs.
- Integration with Code Climate Quality: Can be combined with Code Climate’s static analysis tools for a broader view of code quality alongside delivery metrics.
Driving Engineering Impact with Jellyfish
Driving Engineering Impact with Jellyfish
Effectively leveraging software engineering analytics means translating raw data into strategic actions and measurable business results. But to truly connect day-to-day engineering output to overarching company objectives, you need a dedicated solution that provides deep operational insight and strategic alignment.
That’s where Jellyfish comes in.
Jellyfish empowers engineering leaders to:
- Align engineering execution precisely with strategic business goals by providing clear insights into how work maps to priorities.
- Gain comprehensive visibility into resource allocation across all projects, products, and work types, including new features, technical debt, and support activities.
- Objectively measure and communicate the impact of engineering initiatives on specific company objectives.
- Facilitate data-driven conversations about planning, investment priorities, and team performance with both technical and non-technical stakeholders.
- Connect technical output to tangible business value, clearly demonstrating the engineering team’s strategic contribution.
About the author

Lauren is Senior Product Marketing Director at Jellyfish where she works closely with the product team to bring software engineering intelligence solutions to market. Prior to Jellyfish, Lauren served as Director of Product Marketing at Pluralsight.