In this article
Measuring developer productivity has a bit of a reputation. Just bring it up in a room full of engineers, and you’ll get eye rolls, horror stories, or a passionate rant about Jira tickets and meaningless dashboards.
And honestly? Fair. A lot of attempts to quantify productivity have done more harm than good. They’ve been gamed, misused, or turned into tools for micromanagement.
Some engineering managers on Reddit have gotten so burned by bad metrics that they’ve sworn off measurement entirely:
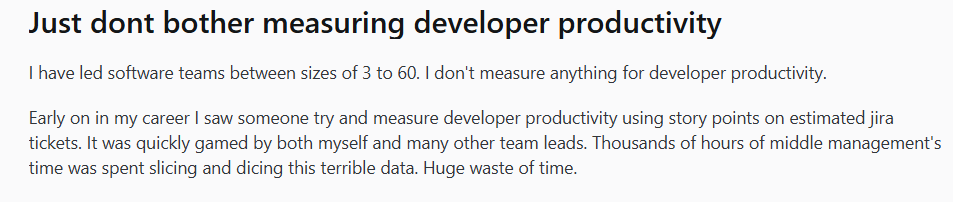
(Source)
But the problem isn’t measurement itself, it’s that most teams are measuring the wrong things. While you’re counting commits, your developers are drowning in broken CI pipelines and waiting days for code reviews.
Below, we’ll show you the metrics that actually matter for developer productivity, how to track them without making your team feel like they’re under surveillance, and what to do with the data once you have it.
What Are Developer Productivity Metrics?
What Are Developer Productivity Metrics?
Ask ten engineering leaders what “developer productivity” means, and you’ll probably get ten different answers. Some think it’s about velocity. Others look at the output. A few just roll their eyes and say it can’t be measured at all.
Here’s how we define it at Jellyfish:
Developer productivity metrics are data points that show how well your development team removes blockers, ships quality code, and keeps up a sustainable pace.
These metrics are NOT about counting lines of code (despite what Elon thinks). More code doesn’t mean better code, and it definitely doesn’t mean faster delivery or happier engineering teams.
They’re also not about tracking who closes the most tickets, who pushes the most commits, or how many hours someone logs in Jira. If the goal is to “catch underperformers,” you’re already measuring the wrong thing.
Good productivity metrics serve three main purposes:
- Spot blockers: Catch slow handoffs, messy dependencies, or vague requirements before they turn into missed deadlines or team-wide headaches.
- Improve processes: Get real data to decide which tools to change, workflows to fix, and how to structure your team
- Support your team: Notice when workloads are creeping up, interruptions are piling on, or development cycles are dragging out, so burnout doesn’t sneak up on you.
“Development is creative work that can’t be measured.” Developers who’ve been burned by bad metrics say this, and they’re right about traditional approaches.
But measuring creativity and measuring delivery are different things. You want to remove friction that prevents creative work from reaching users.
Why Measuring Developer Productivity Matters?
Why Measuring Developer Productivity Matters?
Here’s what happens when you get developer productivity measurement right:
- Teams move faster without burning out: Speed is great, but not when it leads to constant rework and exhaustion. The right software engineering metrics help you move both quickly and sustainably.
- You’ll spot problems before they explode: You’ll notice brewing issues like mounting technical debt or team burnout before they derail your next release.
- Support healthier engineering cultures: Metrics that focus on code quality over raw output encourage better habits and reduce pressure to “just ship.”
- Build trust with stakeholders. Being able to show progress with clarity (and context) helps reset expectations and avoid constant fire drills.
- They make planning more realistic. You get real data to inform timelines, scope, and team capacity.
- Prevent costly mistakes: Catch quality issues and process breakdowns before they reach production and cost you customers.
- Reduce developer frustration: Spot and fix the daily annoyances that make your best people start browsing job boards. Things like flaky tests, slow build times, or unclear requirements that waste hours every day.
- Optimize team performance: Figure out which practices actually streamline delivery and which ones just feel productive. Some “best practices” might be slowing your specific team down.
- Justify engineering investments: Show leadership exactly why you need that extra senior developer or why refactoring that legacy system is worth three weeks of development time.
3 Types of Developer Productivity Metrics You Should Track
3 Types of Developer Productivity Metrics You Should Track
Not every engineering KPI and metric is worth your time. These are the ones that actually help you understand how your team is working and where things are quietly breaking down:
Efficiency Metrics
Definition: Efficiency metrics measure how smoothly work flows through your development pipeline. They compare what you put in (time, effort, resources) with what you get out (features, fixes, deployments).
Why they matter: Efficiency metrics show you what’s happening in your development process. Your team might look busy closing tickets and writing code, but if work sits in review for days or deployments fail constantly, you’re not actually delivering value. You’ll see where tasks get stuck, how long different stages take, and whether your process helps/hurts your team’s ability to ship code.
Examples to track:
- Lead time: Measures the complete journey from “we need this feature” to “customer satisfaction is up and they are using it,” including all the waiting time before development even starts.
- Cycle time: Time from when a developer starts coding until the feature is complete. It includes development, code review, testing, and deployment phases.
- Pull request review time: How long code sits waiting for review and approval. Long review times often mean that there are team capacity issues or unclear review processes.
- Deployment frequency: How often you ship code to production. High-performing teams might deploy multiple times per day, while struggling teams might deploy monthly or less.
- Time to first review: How quickly someone looks at a pull request after it’s submitted. Shows whether code review is a priority for your team.
- Time to resolve blocked work: Measures how fast you clear roadblocks when developers hit dependencies, environment issues, or approval problems.
- Build success rate: Percentage of builds that pass without failing. Low rates might point to flaky tests or unstable work environments that waste developer time.
Effectiveness Metrics
Definition: Effectiveness metrics measure whether your team builds the right things in the right way. They tell you if your features solve real problems, contribute to product goals, and make users happy.
Why they matter: You can ship code fast and still fail completely if you build a product that nobody wants. Effectiveness metrics keep you honest about whether your work creates value or just creates more code.
They’ll show you when your deployment frequency looks great but half your features get rolled back, or when you hit every sprint goal but user satisfaction tanks. The numbers help you argue for time to fix technical debt, invest in better testing, or kill initiatives that seem like good ideas but don’t deliver results.
Examples to track:
- Bug escape rate: Percentage of bugs that slip into production undetected. High rates usually mean your testing has gaps or you’re rushing releases.
- Mean time to recovery (MTTR): How quickly you fix production issues when they blow up. Shows your team’s crisis response skills and how resilient your methodologies actually are.
- Test coverage: Percentage of your codebase that automated tests actually check. Not perfect, but it shows whether you invest in long-term code reliability.
- Feature adoption rate: The percentage of users who touch new features within the first few weeks after release.
- Technical debt ratio: The time you spend fixing old code versus building new features.
- Rollback frequency: How often you need to undo deployments because something breaks. High rollback rates scream quality control problems.
- Reopen rate: How often “done” turns out to be “not quite.” Usually, it’s a sign that the scope was fuzzy or feedback loops broke down.
Experience Metrics
Definition: Experience metrics measure how your development process affects the people who actually do the work. They track developer satisfaction, team morale, and whether your processes support (or sabotage) the human side of software development.
Why they matter: You can optimize for speed and quality all you want, but if your developers burn out and quit, none of it matters. Experience metrics help you spot early warning signs of team dysfunction, excessive work-related stress, or processes that make good developers miserable.
Examples to track:
- Developer satisfaction surveys: Regular pulse checks on how the software development team feels about tools, processes, and workload, often through anonymous experience surveys or one-on-one feedback sessions.
- Time spent in meetings: Hours per week developers spend in meetings versus actual coding. Too many meetings fragment focus and kill productivity.
- Tool satisfaction ratings: Developer feedback on development tools, CI/CD systems, and infrastructure.
- Context switching frequency: How often developers jump between different projects or tasks in a day. Excessive switching destroys deep work.
- Onboarding time: How long it takes new team members to make their first meaningful contribution.
- On-call burden: How often team members get pulled into production issues outside normal hours.
- Work-life balance signals: Late-night commits, weekend work patterns, and time between work sessions. You’ll see whether your pace is sustainable or your team is heading toward burnout.
Metric Selection Matrix
Don’t try to track everything at once. Here’s a simple progression based on team maturity:
New teams (0-6 months): Start with just 3 efficiency metrics
- Deployment frequency – Can you ship consistently?
- Lead time – How long do features actually take end-to-end?
- Build success rate – Catch basic pipeline problems before they waste developer time
Why start here? Your existing tools already track these metrics, and they expose the biggest workflow issues. If your team can’t deploy weekly or builds fail 30% of the time, advanced metrics won’t help.
Growing teams (6-18 months): Add effectiveness metrics
- Bug escape rate – Do you ship high-quality code?
- Pull request review time – Has code review become a bottleneck?
- Mean time to recovery – How fast do you fix production issues?
Why add these next? Once your basic workflow runs smoothly, you need to know if you build the right things well. High deployment frequency means nothing if half your releases break production.
Mature teams (18+ months): Include experience metrics
- Developer satisfaction surveys – How does the team actually feel?
- Context switching frequency – Do developers get focus time?
- Work-life balance signals – Can you sustain this pace?
Why save these for last? Experience metrics only help if your software delivery and quality work well. Teams that struggle with basic workflows need to fix their process first. Satisfaction surveys won’t solve broken deployments.
Rule of thumb: Master your current metrics before you add new ones. If you don’t act on the data you have, more metrics won’t help.
How to Use These Metrics to Improve Developer Productivity
How to Use These Metrics to Improve Developer Productivity
Most teams collect impressive amounts of data about their development process, then make the same decisions they would have made without any metrics at all.
Here’s how to break that cycle:
Focus On Trends, Not Absolute Numbers
The absolute number shows you where you are, but the trend shows you where you’re headed and whether you should be worried or celebrating.
A deployment frequency of 5 times per week doesn’t mean much without context. You need to know whether that’s up from 2 times last month or down from 10.
This applies to every metric you track. For example, pull request review time jumping from 4 hours to 2 days means there’s a problem, even if 2 days seems reasonable in isolation.
When you review your metrics, ask yourself:
- Is this number higher or lower than last month?
- What changed in our process that might explain this trend?
- Are we seeing gradual improvement or sudden drops?
- Do seasonal patterns affect this metric?
PRO TIP 💡: Jellyfish automation tracks trends across all your key metrics, so you can spot when deployment frequency drops or review times spike without manually comparing spreadsheets month over month. You can investigate while the context is still fresh.
Use Metrics to Ask Questions, Not to Assign Blame
Instead of asking “Why did this developer’s code cause production issues?” ask “What’s causing more bugs to slip through our process?” The first question puts someone on the defensive, while the second opens up discussion about gaps that affect the whole team.
If code reviews take too long, maybe your team lacks capacity or your guidelines are confusing. If developers work weekends frequently, maybe your sprint planning needs work.
Use the metrics to start conversations:
- What obstacles are slowing us down this sprint?
- Why is our testing missing these types of bugs?
- What would help us ship more confidently?
- How can we make this process work better for everyone?
Combine Metrics For a Balanced View
No single metric tells the full story. High deployment frequency looks great until you realize your bug escape rate tripled.
To get a real picture of how your team is doing, track different types of metrics together:
- Deployment frequency + rollback rate = sustainable delivery speed
- Fast cycle time + rising technical debt = you’re cutting corners that will slow you down later
- Stable lead time + increasing feature adoption = you’re building the right things at a sustainable pace
- Short code review times + high defect escape rates = reviews move fast but miss problems
When metrics conflict, dig deeper. If team productivity looks great but developers are miserable, you’re probably optimizing for the wrong things. If users love new features but your team is exhausted, you need to find a more sustainable approach.
PRO TIP 💡: Jellyfish automatically correlates efficiency metrics (like deployment frequency) with quality metrics (like change failure rate) to spot dangerous trade-offs before they hurt your team. The platform’s integrated view ensures you never accidentally optimize for speed while quality quietly deteriorates in the background.
Make Data Visible and Accessible to the Team
Engineering productivity metrics locked away in management dashboards help nobody. If developers can’t see the data, they can’t help you improve it.
For starters, set up displays that show key metrics where the team works. Put dashboards on office TVs, share them in Slack channels, or include them in stand-up meetings.
When everyone sees that pull request review time hit 3 days last week, the whole team understands why faster feedback matters.
Also, avoid complex charts and focus on simple trends that anyone can read at a glance. Red and green lights work better than messy graphs when people need to check progress quickly.
Correlate Quantitative Metrics with Qualitative Feedback
Numbers tell you what happened, but people tell you why it happened. Your metrics might show that cycle time doubled last month, but they won’t tell you that your team spent two weeks wrestling with a broken test suite.
You need to ask the right questions when metrics change:
- If review time spikes → what’s making reviews harder or more complex?
- If bug rates climb → where are gaps appearing in the testing process?
- If lead time increases → what new bottlenecks appear in the workflow?
- If deployment frequency falls → what’s making teams hesitant to ship?
A short retrospective, a quick Slack thread, or a well-timed internal survey can bring insights you’ll never get from dashboards alone.
– – –
Real-World Example – How Google Measures Developer Productivity
Team member Ciera Jaspan (software engineer) explained Google’s approach in a recent DX podcast. Google’s Engineer Productivity Research team rejects the idea of a single productivity metric.
Instead, they use a “mixed methods” approach that combines log data with surveys, interviews, and diary studies to measure across three dimensions: speed, ease, and quality.
Google doesn’t trust their automated measurements. They validate log data against human experience. For example, when they create an “active coding time” metric from logs, they also ask engineers to track their actual coding time manually to ensure the measurements match what’s really happening.
Since 2018, Google surveys one-third of its engineers every quarter. These surveys catch things that logs miss entirely – like how frustrated developers feel about technical debt or whether they’re actually satisfied with their tools.
Google’s takeaway is simple: measuring productivity right means combining technical data with human insight. Just counting commits and calling it productivity doesn’t work.
– – –
Benchmark Against Yourself First
Don’t get too caught up in what other companies claim their cycle time looks like. Yes, industry benchmarks can provide useful context, but they’re not always directly applicable to your specific situation.
For example, if your build success rate is currently 70%, getting it to 85% is a massive win regardless of whether some startup claims they achieve 98% success rates.
When you chase external standards that don’t fit your context, you end up optimizing for the wrong things or setting impossible expectations that demoralize everyone.
Focus on your own trajectory:
- Track month-over-month changes in key metrics
- Celebrate wins when you beat your previous performance
- Set realistic targets based on your team’s capacity
- Use external benchmarks only as loose reference points
PRO TIP 💡: Jellyfish tracks your team’s historical performance and shows month-over-month improvements before it compares you to industry benchmarks. You’ll celebrate real wins based on your own progress while you use industry data as context, not impossible targets.
Measure and Improve Developer Productivity with Jellyfish
Measure and Improve Developer Productivity with Jellyfish
Jellyfish is a software engineering intelligence platform that plugs into your existing tools (GitHub, Jira, Slack, etc.) and automatically creates a clear picture of your entire development lifecycle—from how much time goes to planned roadmap work to which team members are carrying unsustainable workloads.
Here’s why Jellyfish is the go-to tool for measuring and improving developer productivity:
- Get DORA metrics without the setup headache: Jellyfish calculates deployment frequency, lead time, change failure rate, and mean time to recovery straight from your existing CI/CD data, so you can benchmark your team’s delivery performance without building custom dashboards.
- See where engineering effort really goes: Break down how much time your team spends on planned roadmap work versus unplanned firefighting, technical debt, and support requests.
- Get the real story on your AI investments: Everyone’s buying GitHub Copilot, but is it actually making your team faster? Jellyfish shows you adoption rates, usage patterns, and whether those AI tools are worth the hype.
- Notice developer experience problems before they explode: The platform outlines when individual engineers are overloaded or when meeting overload is destroying focus, so you get early warning signs of burnout and potential productivity drops.
- Bridge the gap between engineering and leadership: Replace those awkward “why is everything taking so long?” conversations with concrete data about team capacity, progress blockers, and realistic timelines.
- Build roadmaps that don’t fall apart: Create realistic timelines based on how fast your team actually works, not how fast someone thinks they should work.
If you’re serious about improving developer productivity without resorting to vanity metrics or micromanagement, Jellyfish might be the ideal fit.
Schedule a demo and see how Jellyfish turns the mystery of “what’s taking so long?” into actual answers you can act on.
FAQs
FAQs
How do we get started if we’re not measuring anything today?
Starting from zero feels overwhelming, but you don’t need a complex analytics setup on day one.
Here’s a quick step-by-step overview on how you can get started:
- Pick 3-4 basic metrics to start: Choose simple ones your current tools already track (e.g., deployment frequency, number of commits, pull request review time, and build success rate).
- Set up basic tracking: Use whatever tools you have now, whether it’s GitHub insights, your CI/CD dashboard, or simple spreadsheet tracking for one month.
- Define your baseline: Record current numbers without trying to improve anything. Just observe and document what normal looks like for your team.
- Share the data with your team: Show everyone the baseline numbers and explain you’re using them to spot improvement opportunities, not judge performance.
- Pick one problem to fix: After a month, choose the metric that shows your biggest pain point and focus on improving just that one thing.
- Add more metrics gradually: Once your first metric improves and the team sees value, add 1-2 more individual metrics every few months.
How do we get buy-in from developers who might see this as surveillance?
Be transparent about why you want to measure and how you’ll use the data. Developers resist metrics when they think you’re looking for reasons to criticize their work or compare team members against each other.
Ask them about what’s the most frustrating part of your current process. When they mention slow code reviews or flaky builds, explain how metrics could help fix those specific issues. Then prove it – pick one annoying problem and actually use data to solve it.
Make metrics team-owned, not manager-imposed. Let developers help choose what to measure and how to display it. Always frame discussions around process improvements, never individual performance. “Our review process seems slow” works better than “your reviews take too long.”
What is the practical difference between the DORA and SPACE frameworks?
DORA focuses on delivery performance. It gives you four core metrics that include deployment frequency, lead time for changes, change failure rate, and time to restore service.
SPACE, on the other hand, looks at the broader picture. It includes five dimensions – Satisfaction, Performance, Activity, Communication, and Efficiency. It’s less about how fast you deploy and more about how well your team works together.
In short:
- Use DORA to track engineering performance at the system level.
- Use SPACE to understand team health, experience, and how work actually gets done.
Many teams use both. DORA shows how well your delivery engine runs, while SPACE shows what’s happening under the hood.
Should we compare our team’s metrics against other teams?
Be careful with team-to-team comparisons. Different teams work on different codebases with different constraints.
Team A might deploy 5x per day while Team B deploys weekly, but if Team A works on a simple web app and Team B maintains a complex integration system, those numbers don’t mean Team A is “better” or more agile.
How often should our team review these metrics?
Here’s a simple breakdown:
- Daily or real-time: Useful for visibility. Dashboards help the team stay aware, but don’t overreact to every dip.
- Weekly or bi-weekly: Helps spot early signs of friction and gives you time to adjust before problems grow.
- Monthly: Lets you step back and see larger patterns—what’s improved, what’s stalled, and what needs more attention.
- Quarterly: Gives you a high-level view. This is the time to connect the data to team business goals, morale, and long-term progress.
Can you measure the productivity of an individual developer with these metrics?
No, and you shouldn’t try. These metrics measure team processes and workflows, not individual performance.
A developer might write less code because they’re mentoring juniors, fixing complex bugs, or working on architecture – all valuable work that doesn’t show up in typical productivity metrics.
Learn More About Developer Productivity
Learn More About Developer Productivity
- What is Developer Productivity & How to Measure it the Right Way
- What is Developer Productivity Engineering (DPE)?
- 9 Common Pain Points That Kill Developer Productivity
- How to Improve Developer Productivity: 16 Actionable Tips for Engineering Leaders
- Automation in Software Development: The Engineering Leader’s Playbook
- 29 Best Developer Productivity Tools to Try Right Now
- AI for Developer Productivity: A Practical Implementation Guide
- How to Build a Developer Productivity Dashboard: Metrics, Examples & Best Practices
- Developer Burnout: Causes, Warning Signs, and Ways to Prevent It
- 10 Peer Code Review Best Practices That Turn Good Developers Into Great Ones
- Mitigating Context Switching in Software Development
About the author

Lauren is Senior Product Marketing Director at Jellyfish where she works closely with the product team to bring software engineering intelligence solutions to market. Prior to Jellyfish, Lauren served as Director of Product Marketing at Pluralsight.