In this article
Most engineering leaders have at least evaluated Code Climate Velocity at some point. It’s been around since 2018, tracks DORA metrics well, and connects to the tools most teams already use.
But it’s not the right fit for everyone. Keeping data accurate often requires manual validation, some metrics are hard to interpret without more context, and teams with specific reporting needs find the built-in dashboards too rigid to work with.
If you’ve been running into these friction points, or you’re just doing due diligence before committing, it’s worth seeing what else is out there.
We went through G2 reviews, Capterra ratings, and Reddit discussions to find the alternatives that engineering teams mention most. These are seven Code Climate Velocity alternatives worth evaluating.
Why Look for an Alternative to Code Climate Velocity?
Why Look for an Alternative to Code Climate Velocity?
Code Climate Velocity gets the fundamentals right, which is why it’s been a go-to choice for engineering teams tracking DORA metrics and delivery performance.
But if you spend enough time in the reviews, you’ll notice some patterns. Here are the limitations that G2 users mention most often:
- Process deviations can skew your dataset: Data hygiene is a recurring concern. One outlier PR can skew results, and since there’s no easy way to clean up mistakes, reviewers say they have to manually validate any findings before acting on them. [Read Full G2 Review]
- API reliability gaps: Users have reported incomplete data when pulling from the API, with one noting that a team’s endpoint missed roughly 10% of records. That can be a deal-breaker if you’re relying on the API for custom reporting or data pipelines. [Read Full G2 Review]
- User management gets tedious at scale: When engineers move between teams frequently, keeping assignments and permissions current becomes a manual task. Several reviewers wanted tighter integrations with other tools to handle this automatically. [Read Full G2 Review]
- Limited dashboard customization: Teams with specific reporting needs may find the platform inflexible. There’s no way to build your own dashboards, so you’re working within whatever views Code Climate provides. [Read Full G2 Review]
- Some metrics lack transparency: Metrics like “Impact” sound useful, but reviewers find it difficult to understand what inputs drive the calculation. Without that clarity, it’s hard to know what you’re optimizing for. [Read Full G2 Review]
- No way to account for real-world context: There’s no mechanism to flag when someone was on PTO, in training, or at a conference. Those absences affect daily and weekly averages, and you can’t exclude individual days to get a more accurate picture. [Read Full G2 Review]
Key Features to Look for in a Code Climate Velocity Alternative?
Key Features to Look for in a Code Climate Velocity Alternative?
Here are some things you should look for if you’re on the search for a Code Climate alternative:
Broad integration coverage
Code Climate integrates with GitHub, Jira, and Linear, which covers the basics. But if your org uses HRIS systems, financial tools, open source tools, or a broader CI/CD stack, you’ll find yourself filling in gaps manually. Wider integration coverage means fewer blind spots.
Connecting engineering work to business outcomes
One of the common frustrations with Code Climate is that it stays at the activity level. You can see commits, PRs, and cycle time, but mapping that work to business outcomes or tracking maintainability trends across repositories needs manual effort on your part.
Platforms that handle this connection natively make it easier to have resource conversations with leadership.
Resource allocation visibility
Understanding how engineering time splits between roadmap work, support, tech debt, and unplanned requests is useful for planning.
Code Climate doesn’t break things down this way, so if allocation visibility matters to you, that’s something to look for elsewhere.
Planning and forecasting capabilities
Historical dashboards have their place, but planning conversations need forward-looking data.
Code Climate doesn’t offer much in the way of scenario planning or delivery prediction, which is a gap if your org is trying to get better at hitting timelines.
Customizable reporting
Code Climate gives you a set of predefined reports, and that’s mostly what you get. If your reporting needs are specific or likely to evolve, a platform with flexible dashboards will save you a lot of workaround time.
Team health and developer sentiment
Metrics can show you that velocity dropped, but they won’t explain why. Code Climate is purely quantitative, so if you want to pair system data with developer feedback or sentiment surveys, you’ll need a platform that supports that integration.
Visibility into AI-assisted workflows
If your team is rolling out Copilot or similar tools, you’ll probably want to measure what effect they’re having. Code Climate wasn’t built with this in mind, so AI impact tracking isn’t really part of what it offers. Some newer platforms are starting to fill that gap.
7 Best Code Climate Velocity Alternatives on the Market Right Now
7 Best Code Climate Velocity Alternatives on the Market Right Now
Code Climate Velocity is a reasonable starting point for engineering metrics, especially if your needs are straightforward.
But teams that want broader integrations, better forecasting, or the ability to tie engineering work to business priorities often end up looking elsewhere.
These are the platforms that come up most often:
- Jellyfish
- Waydev
- Appfire’s Flow
- Typo
- Faros AI
- Swarmia
- Allstacks
| Solution | Platform Type & Focus | Best For |
| Jellyfish | All-in-one engineering intelligence platform covering delivery, planning, DevEx, AI adoption, and financial reporting | Engineering leaders who need complete visibility across the SDLC and a way to communicate value to executives and finance |
| Waydev | Engineering intelligence with broad integrations and customizable dashboards | Teams that want flexibility in metric tracking and built-in developer sentiment surveys |
| Appfire’s Flow | Sprint-focused productivity tool with manager enablement features | Agile teams in the Atlassian ecosystem who want metrics tied to retros and 1:1s |
| Typo | AI-augmented delivery intelligence with automated code review | Teams that want PR-level quality checks and risk detection alongside delivery metrics |
| Faros AI | An enterprise data platform that normalizes SDLC data across complex toolchains | Large organizations with heterogeneous environments and strict compliance requirements |
| Swarmia | Lightweight productivity platform with real-time data and Slack-based nudges | Teams that want fast feedback loops and automated working agreement reminders |
| Allstacks | Value stream intelligence with delivery forecasting and R&D capitalization | Leaders who need to predict timelines and communicate risk to non-technical stakeholders |
1. Jellyfish
Jellyfish is a software engineering intelligence platform that consolidates data from across the SDLC (Git, project management, CI/CD, HR, and more) into a unified view of delivery, planning, developer experience, and AI adoption.
Over 700 companies, including DraftKings, Keller Williams, and Blue Yonder, rely on it to show executives exactly where engineering hours go and make the case for headcount, trade-offs, or timeline adjustments with real data.
Code Climate Velocity covers DORA metrics and code-level activity, but it stays within engineering. Jellyfish is built for leaders who need to communicate engineering value to people outside the org, such as finance teams, executives, and product leadership.
Key Features
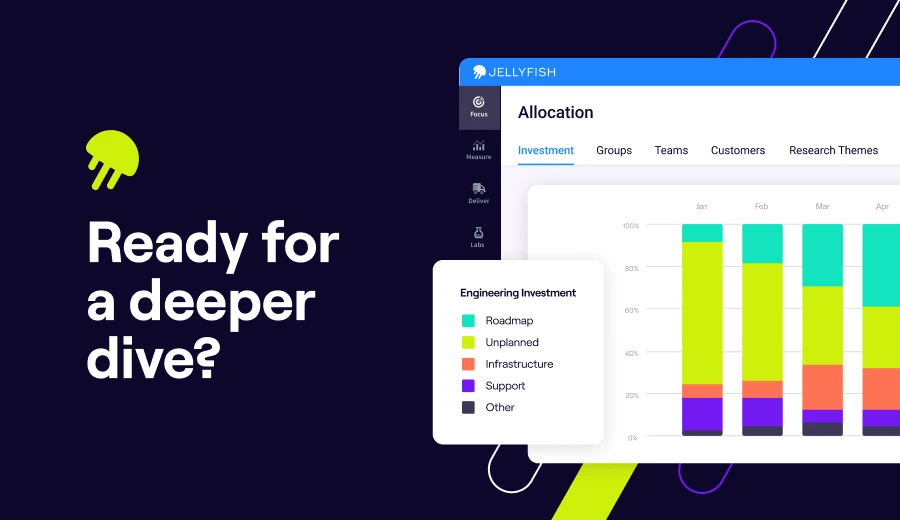
- Resource allocation visibility: The platform uses a patented model to break down where engineering effort goes based on commits, tickets, and other signals. Leaders get investment visibility without burdening engineers with time tracking.
- Scenario Planner for roadmap modeling: Scenario Planner lets you model how changes to headcount, scope, or priorities would affect timelines. It’s designed for planning conversations where leadership wants to know “what happens if we pull two engineers for this new initiative.”
- AI Impact tracking: The platform measures how AI tools like Copilot, Cursor, and Claude Code are being used and what effect they’re having on delivery. You get adoption data, spend visibility, and outcome metrics in one place.
- DevEx surveys built in: Built-in DevEx surveys let you pair what engineers say with what the system data shows. If cycle time spikes or throughput drops, you have context to understand why.
- DevFinOps and R&D capitalization: Jellyfish automates software capitalization reporting for finance and accounting teams. It produces audit-ready records without requiring engineers to track time manually, and it’s SOC 1 Type II compliant.
Why Do Companies Choose Jellyfish Over Code Climate Velocity?
Here’s where Jellyfish tends to fill the gaps:
- Role-specific views for managers, PMs, and execs: Code Climate gives you a set of predefined views, and that’s mostly what you get. Users who need custom reporting often hit a wall. With Jellyfish, you can build dashboards tailored to your role, whether you’re an engineering manager tracking sprint health or a product leader monitoring deliverables. [Read Full G2 Review]
- Connecting engineering work to business outcomes: Code Climate tracks commits, PRs, and cycle time, but if you need to explain where engineering effort is going in terms that leadership cares about, you’re on your own. Jellyfish closes that gap with an allocation model that automatically maps time to product work, tech debt, bugs, and unplanned requests. [Read Full G2 Review]
- Broader integration coverage: Code Climate integrates with GitHub, Jira, and Linear, which covers the basics. But if your org relies on HR systems, calendars, roadmapping tools, or a broader CI/CD stack, you’re filling in gaps manually. Jellyfish, on the other hand, connects across the full SDLC. [Read Full G2 Review]
- Easier setup and better support: Code Climate users have mentioned pain points around user management at scale and data accuracy that needs manual clean-up. Jellyfish gets the opposite feedback, where reviewers regularly mention smooth onboarding and responsive customer support. [Read Full G2 Review]
- Visibility into whether AI investments are paying off: If your team is rolling out Copilot, Cursor, or similar tools, Code Climate doesn’t offer a way to measure their impact. Jellyfish tracks AI adoption at the team level and ties usage to delivery outcomes, so you can see whether those investments are paying off. [Read Full G2 Review]
What Real Customers Are Saying about Jellyfish
Jobvite went through rapid growth via acquisition and ended up with four engineering teams, each with its own toolset. Jellyfish gave them visibility across all work in progress—80% higher delivery throughput, 60-day reduction in SLAs, and 72% faster resolution on P2 and P3 tasks.
CHG Healthcare was spending 20 hours every Friday on manual reporting with inconsistent results. After switching to Jellyfish, they caught a project issue two weeks into development, saving $130K on that initiative alone.

Priceline runs 700+ engineers, so software capitalization is a nightmare to manage manually. With Jellyfish DevFinOps, they’ve made the process 5x faster and reduced audit interviews by over 80%.
2. Waydev
Waydev is a Y Combinator-backed engineering intelligence platform that’s been around since 2017. It integrates with your Git provider, project management tools, CI/CD stack, and calendars to centralize engineering data.
The platform offers a much broader set of key metrics than you’d get from Code Climate, with everything from delivery velocity to process hygiene to developer sentiment included.
Key Features
- Developer experience module: Waydev includes built-in surveys you can send via Slack or Teams to capture how engineers are feeling about their work.
- Wide range of integrations: Waydev connects to GitHub, GitLab, Bitbucket, Azure DevOps, Jira, ClickUp, and various CI/CD tools. The integration list is much wider than what Code Climate supports.
- Custom dashboards and reporting: You can build dashboards based on what your team cares about most. It’s easy to visualize metrics your way and share reports with different stakeholders without exporting to spreadsheets.
Advantages
- Quick user setup: Getting new users into the platform is simple. You can add people directly from the dashboard without jumping through hoops, which helps when you’re trying to roll out quickly. [Read Full G2 Review]
- Useful for async progress tracking: Waydev’s automated summaries give managers a way to track progress without hovering over their teams. Reviewers in regulated industries mention this as particularly helpful when deadlines are tied to external approvals. [Read Full G2 Review]
- Flexible metrics and dashboards: Waydev offers a wide range of metrics to track, and you can build custom dashboards to organize them the way that makes sense for your team. This is a clear step up from platforms with rigid, predefined views. [Read Full G2 Review]
Limitations
- Developer experience surveys need work: Waydev includes a DX module for collecting engineer feedback, but some users find it underdeveloped. The survey functionality could use more flexibility and depth. [Read Full G2 Review]
- Steeper learning curve than expected: The platform has a lot of features, and reviewers mention that getting comfortable with how to use Waydev properly takes longer than they anticipated. [Read Full G2 Review]
- Some Jira sync issues: Users have reported that certain views, particularly around sprints, don’t always sync cleanly with Jira. If your team relies heavily on Jira for sprint tracking, it’s worth testing this during evaluation. [Read Full G2 Review]
Pricing
There’s a free trial available, and pricing is based on active contributors billed annually:
- Pro ($29/month per contributor): Core functionality that includes DORA metrics, health and delivery insights, and benchmarking. Covers up to 50 repos with 6 months of data history.
- Premium ($54/month per contributor): Everything in Pro plus resource planning, custom metrics, DX surveys, AI tool tracking, and API access. Supports 300 repos with 36 months of retention.
- Enterprise (custom pricing): Unlimited repos and data retention, on-prem hosting options, SSO/SAML support, and dedicated engineering resources.
3. Appfire’s Flow
Flow is an engineering intelligence platform that was acquired by Appfire from Pluralsight in early 2025. The platform is built around helping managers have data-driven conversations about team performance, whether that’s in sprint retros, 1:1s, or planning sessions.
For teams already in the Atlassian ecosystem, Flow fits naturally alongside Appfire’s other tools like BigPicture PPM and 7pace Timetracker.
Compared to Code Climate, Flow leans more heavily into sprint-level insights and manager tooling for 1:1s and retros, which may appeal to teams that want metrics tied directly to agile ceremonies.
Key Features
- Retrospective dashboard: Flow’s retrospective view lets you compare metrics across sprints and time periods to see how workflow and code changes affect delivery.
- Sprint Movement visualization: This feature shows how work flows through sprints, including scope changes, committed vs. completed work, and where tickets get stuck.
- Check-in reports for 1:1s: Flow includes a check-in feature that outlines relevant data for manager-developer conversations. You can set customizable goals and track progress over time.
Advantages
- Solid integration with core dev tools: Flow connects smoothly with GitHub and Jira, which helps keep everyone working from the same data. For teams already in those ecosystems, setup is relatively painless. [Read Full G2 Review]
- Clean, focused interface: Reviewers appreciate that the UI doesn’t overwhelm you with options. It’s straightforward enough that you can get to the data you need without spending time figuring out the tool itself. [Read Full G2 Review]
- Active feature development: Ongoing development is a plus here. Reviewers point out that the platform has added meaningful features over time, so it doesn’t feel like you’re buying into a stagnant product. [Read Full G2 Review]
Limitations
- Report configuration can be tedious: Setting up workflow reports involves a lot of parameters, which some users find cumbersome. If you need quick, ad-hoc reports, expect to spend more time than you’d like getting them configured. [Read Full G2 Review]
- Limited language and IDE support: Flow doesn’t cover every programming language or development environment. PHP teams, for example, may find limited support, which can be a problem for teams working with less common tools. [Read Full G2 Review]
- Sharing and API limitations: You can’t save filters and share them with teammates, and the platform feels fairly closed off from an API perspective. [Read Full G2 Review]
Pricing
Flow offers two plans, both billed annually per user:
- Core at $38/user/month: Includes unlimited repos, up to 36 months of data import, integrations with GitHub, Bitbucket, GitLab, Jira, and Azure DevOps, plus core metrics like Work log, Ticket log, and Review workflow. Also includes Mob/Pair support and Email & Slack notifications.
- Plus at $50/user/month: Everything in Core, plus Team health insights, Retrospective, Investment profile, Sprint movement, Check-in reports, Proficiency tracking, and API access.
4. Typo
Typo takes a more hands-on approach to engineering intelligence than most traditional tools in this space.
It integrates with Git, Jira, CI/CD, and Slack to get the usual delivery metrics, but it also uses AI for static code analysis, test coverage insights, and automated PR recommendations.
If Code Climate feels too passive for your needs, Typo’s AI-based approach to code review and delivery prediction offers a more interventionist alternative.
Key Features
- AI-powered code reviews: CodeIQ, Typo’s automated review feature, scans PRs for potential issues related to code coverage and security, then provides AI-generated recommendations. It won’t replace human review, but it can find problems earlier and reduce the load on your team.
- AI coding tool adoption tracking: If your team uses Copilot, Cursor, or similar tools, Typo can track adoption and measure how AI-assisted coding affects velocity and quality.
- Investment distribution tracking: You can create categories like features, tech debt, bugs, and maintenance work, and Typo automatically tags PRs accordingly.
Advantages
- Automated code quality checks in your workflow: One of Typo’s strengths is that code quality checks happen automatically as part of your existing PR workflow. You don’t have to context-switch to a separate tool or wait for manual review to spot common issues. [Read Full G2 Review]
- Granular bottleneck detection: The platform helps you pinpoint exactly where in the development cycle things are slowing down. Reviewers mention being able to find efficiency vulnerabilities at a level of detail that wasn’t possible with previous tools. [Read Full G2 Review]
- Accessible sprint reporting: Reviewers call out sprint reporting as particularly easy to use. If you’ve struggled with manual reporting or complex dashboards elsewhere, Typo’s approach is more approachable. [Read Full G2 Review]
Limitations
- AI risk assessments might need manual oversight: Typo’s AI can flag application security issues, duplications, and dependencies, but its risk categorization isn’t always reliable. Some teams report having to manually review what gets marked as low-risk to avoid missing something that matters. [Read Full G2 Review]
- Metric thresholds aren’t always clear in the UI: Metric categorization can feel vague at first. You may need to reference the docs to understand how thresholds work. [Read Full G2 Review]
- Work log could go deeper on Jira integration: The work log pulls from Jira, but users say it doesn’t go deep enough. Better mapping between board activity and commit data would help teams track progress more reliably. [Read Full G2 Review]
Pricing
Pricing is on the lower end for this category, and there’s a free tier if you want to test it out:
- Free tier supports up to 5 contributors and 5 repos with DORA metrics, PR insights, and 3 months of data retention.
- Starter ($20/dev/month) expands to unlimited repos and 6 months of history, with sprint metrics, deployment tracking, investment categories, and burnout insights.
- Pro ($28/dev/month) includes AI-powered pull request reviews, automated summaries and code fixes, code health analysis, unlimited data history, and a dedicated success manager.
- Enterprise (custom pricing) covers on-prem deployment, multiple Git organizations, software capitalization, and custom integrations.
5. Faros AI
Faros AI is an enterprise-grade engineering intelligence platform that unifies fragmented SDLC data from Git, project management, CI/CD, incidents, HR, and custom sources into one normalized model.
The platform is particularly strong for larger organizations that need to correlate data across many systems without forcing teams to standardize their workflows first.
While Code Climate covers the basics well, Faros AI is built for organizations with more complex environments that need to pull data from many systems and correlate it in one place.
Key Features
- Broad data integration without standardization: Faros connects to a wide range of tools and normalizes the data automatically. You don’t need to refactor how teams work or clean up data in advance.
- Modular intelligence packages: Faros offers pre-built modules for specific use cases like DORA metrics, developer experience, AI co-pilot impact, software quality, initiative tracking, and R&D cost capitalization.
- Flexible deployment options: You can run Faros as SaaS, hybrid, or fully on-prem, which matters for enterprises with strict compliance or data residency needs.
Advantages
- Handles complexity without heavy lifting: The platform does the heavy lifting on data integration and correlation, which saves you from building that infrastructure yourself. Users note that what would take months with other tools can be done in hours once you know your way around. [Read Full G2 Review]
- Flexible visualizations and automation: Faros provides solid customization for dashboards, visualizations, and alerting. Once you’ve built a query, you can automate the reporting around it so you’re not repeating the same manual steps. [Read Full G2 Review]
- Responsive support: Support gets high marks from reviewers. The team is responsive and hands-on when you run into issues, which helps offset the learning curve during onboarding. [Read Full G2 Review]
Limitations
- Steep learning curve upfront: The platform is powerful, but takes time to learn. Reviewers note that the complexity can be intimidating at first, though strong support helps smooth the onboarding process. [Read Full G2 Review]
- Self-service features are still maturing: Earlier users found the platform needed more hand-holding than expected for building things independently. This has been improving, but it’s worth noting if you want to be fully self-sufficient from day one. [Read Full G2 Review]
- Dashboard load times can lag: Some users report that dashboards occasionally take longer to load than expected. For teams that rely on quick, real-time views, this could be a minor frustration. [Read Full G2 Review]
Pricing
Faros AI offers three tiers with pricing starting at $29 per contributor:
- Professional: Covers productivity benchmarks and insights. Includes SaaS tool connectors, SSO, and Lighthouse AI for AI-powered recommendations.
- Enterprise: Everything in Professional, plus custom and hybrid connectors, SSO/SAML, API access, and advanced role-based access controls.
- Ultimate: Everything in Enterprise, plus unlimited connectors and full schema access for organizations that need maximum flexibility with their engineering data.
You’ll need to go through a demo to get specific pricing details for each plan.
6. Swarmia
Swarmia is an engineering productivity platform that connects to GitHub, Jira, Linear, and Slack to track delivery metrics, time allocation, and developer satisfaction in one place.
Where Code Climate focuses primarily on code-level activity metrics, Swarmia also brings investment tracking and developer sentiment to connect engineering work with more strategic priorities.
Key Features
- Working agreements with automated nudges: Teams define their own norms (e.g., “PRs reviewed within 24 hours”) and Swarmia sends Slack or Teams reminders when work drifts from those agreements.
- Investment balance tracking: Shows where engineering time goes across categories like roadmap work, bugs, technical debt, and unplanned tasks. You can also create custom breakdowns and drill down from org-wide views to individual contributors.
- Developer experience surveys: Comes with a 32-question survey framework that includes everything from team focus to technical debt management.
Advantages
- Flexible team and scope configuration: Swarmia makes it easy to set up teams and narrow data views to match your specific needs. If your org structure is complex or you only want insights on specific projects, the tool supports that without extra workarounds. [Read Full G2 Review]
- Fast time-to-value during onboarding: Once you connect your dev tools, useful data starts appearing quickly. The platform includes workflows that help you spot and fix data alignment issues, so you’re not spending weeks cleaning things up before you can act on the insights. [Read Full G2 Review]
- Clean interface with solid documentation: The UI collects key numbers without burying you in options, making it easy to get what you need at a glance. When you want to dig deeper, the documentation and in-app explanations are there to support you. [Read Full G2 Review]
Limitations
- Custom deployment tracking is limited: If your team uses specific GitHub Actions for deployments, you may find that Swarmia doesn’t let you configure those as deployment triggers. Teams with non-standard deploy workflows might need workarounds to get accurate deployment metrics. [Read Full G2 Review]
- Default settings aren’t always transparent: Some of Swarmia’s defaults aren’t immediately obvious, which can make it tricky to figure out why your numbers look off. If you have a custom CI/CD setup, expect to do some manual investigation to find where the platform’s assumptions don’t match your pipeline. [Read Full G2 Review]
- No DORA benchmark comparisons: The platform doesn’t include industry benchmarks for DORA metrics, so you can’t easily see whether your team falls into any specific categories. If external benchmarking matters to your reporting, you’ll need to bring that context in yourself. [Read Full G2 Review]
Pricing
There’s a free plan available for teams with 9 or fewer developers. Paid pricing works like this:
- €28/dev/month gets you one module of your choice
- €49/dev/month includes all three modules (Business outcomes, Developer productivity, and Developer experience)
- Enterprise is custom-priced and includes on-prem support and volume discounts
Learn more → 14 Best Swarmia Alternatives & Competitors on the Market Today – Jellyfish
7. Allstacks
Allstacks is a value stream intelligence platform that normalizes data from development tools across the software delivery lifecycle to outline delivery predictions, investment breakdowns, and timeline risk.
It’s built mainly for orgs where engineering leaders and CTOs need to communicate progress, risk, and resource allocation to stakeholders who aren’t going to spend hours going through Jira.
Key Features
- AI-powered deep research: Allstacks recently introduced an Intelligence Engine that analyzes delivery data and points out risks in your delivery with specific recommendations.
- R&D capitalization reporting: For startups that need to optimize software development costs for accounting purposes, Allstacks offers built-in capitalization reporting that produces audit-ready records.
- Custom dashboards and metrics: You can build dashboards around the metrics your team cares about without any rigid templates. The platform supports DORA, SPACE, and custom frameworks.
Advantages
- Hands-on onboarding support: Allstacks invests in getting teams up and running smoothly. Users mention the team being responsive and helpful throughout the setup process, which helps offset the learning curve that comes with any new platform. [Read Full G2 Review]
- Clean, readable dashboards: The reporting interface is straightforward to understand without any tutorials. Direct integrations with Jira and GitHub mean you get connected data without manual stitching. [Read Full G2 Review]
- Accessible across roles: The UI is intuitive enough that team members at different levels – from ICs to directors – can move around without friction. That makes it easier to get buy-in when rolling out to a broader group. [Read Full G2 Review]
Limitations
- Data syncs only once per day: Allstacks updates data on a daily cadence, which works fine for trend analysis but can be frustrating if you need to verify recent changes quickly. Teams that want near real-time visibility may find themselves waiting longer than they’d like. [Read Full G2 Review]
- Limited alerting options: The platform could use more flexibility around notifications, particularly Slack integration for alerts. If your team relies on Slack for workflow nudges, you may find the current options lacking. [Read Full G2 Review]
- No native sprint view: If your team runs sprints, there’s no default view that maps to sprint boundaries. You can get there by adjusting date ranges manually, but it adds extra clicks for something that should be a standard option. [Read Full G2 Review]
Pricing
There’s a free trial available with no credit card connection needed. Paid plans are billed annually per contributor:
- Premium ($400/year): Up to 500 contributors, multitenant hosting, SSO/SAML, and six weeks of onboarding support.
- Enterprise ($600/year): Single-tenant hosting, data export API, unlimited retention, and a dedicated CSM.
- R&D Cap ($200/year): Standalone option for automated capitalization reporting and audit-ready financials.
How to Select the Right Allstacks Alternative for Your Needs
How to Select the Right Allstacks Alternative for Your Needs
Picking the right platform comes down to what’s broken in your current setup. If Code Climate is almost working but missing one thing, a focused tool might be enough.
If the gaps are piling up, you probably need something more comprehensive. Here are some things to consider:
- If the biggest headache is explaining engineering value to leadership, Jellyfish is built for that conversation. It connects engineering work to business priorities in a way that finance and exec teams can easily understand.
- If your delivery dates keep slipping and no one catches it until it’s too late, Allstacks is worth a look for its predictive forecasting. Jellyfish also offers scenario planning and timeline modeling, but with more emphasis on tying delivery to a broader business context.
- If you want to understand how engineers are feeling, not just how fast they’re shipping, you’ll want a platform with built-in sentiment surveys. Swarmia and Waydev both have this, and Jellyfish includes DevEx surveys alongside its operational metrics for teams that want the full picture.
- If code quality keeps slipping through review and you want automated checks, Typo is the only platform here with AI-powered PR scanning built in. Jellyfish doesn’t compete directly on code review, but it gives you the delivery and planning visibility that Typo doesn’t cover.
- If your toolchain is all over the place and nothing integrates cleanly, Faros AI is built for that kind of mess because it normalizes data from 50+ sources. Jellyfish also handles enterprise complexity, but leans more toward helping you act on that data than just aggregating it.
- If budget is a real constraint right now, Typo and Swarmia both have free tiers that’ll get you started. Jellyfish sits at a higher price point, but it often replaces what would otherwise be two or three separate tools.
We also prepared a table breakdown of how the alternatives compare:
| Platform | What Sets It Apart from Code Climate | Best Fit For |
| Jellyfish | The most comprehensive engineering intelligence platform on the market, covering delivery, planning, DevEx, AI adoption, and financial reporting in one place | Engineering leaders who need a complete picture of delivery, capacity, and investment without switching between dashboards |
| Waydev | Wide integration support and customizable dashboards with DevEx surveys included | Orgs that want flexibility in how they track and visualize productivity |
| Flow | Built around sprint workflows, retros, and 1:1 check-ins | Engineering teams that prioritize sprint-level insights and improvement through built-in ceremony support |
| Typo | AI-driven code review and PR risk detection alongside delivery metrics | Teams that want to streamline quality checks without a separate tool |
| Faros AI | Enterprise data normalization across dozens of tools with modular intelligence packages | Large orgs with complex, heterogeneous toolchains |
| Swarmia | Real-time data, working agreements with Slack nudges, and investment tracking | Development teams that want faster feedback loops and lightweight automation |
| Allstacks | Delivery forecasting and R&D capitalization with a focus on timeline prediction | Leaders who need to communicate risk and investment to stakeholders |
If Code Climate’s limitations are narrowly defined – say, you just need better dashboard customization – a lighter tool might solve it.
But if the issues span delivery visibility, planning, and business alignment, Jellyfish covers more ground than any single alternative on this list.
Jellyfish – The Ideal Code Climate Velocity Alternative
Jellyfish – The Ideal Code Climate Velocity Alternative
Code Climate Velocity is fine for tracking commits and cycle time, but most engineering leaders need more than that.
Jellyfish operates at a higher level and gives leaders the context they need to talk strategy with finance, product, and the C-suite.
If you’re looking for a platform that scales with your org and ties delivery metrics to your company’s strategic priorities, Jellyfish is the stronger choice.
Here’s a quick recap of what it brings to the table:
- Get a real-time breakdown of how engineering hours are split across strategic priorities, tech debt, and support work, with reporting clean enough for exec and board-level conversations
- Model trade-off scenarios for headcount, scope, and priority changes using your own historical capacity data
- Measure how AI coding tools are being used across teams and whether that usage is showing up in faster delivery, fewer bugs, or improved code quality
- Pair research-backed developer experience surveys with system metrics to spot friction points before they become retention problems
- Replace manual software capitalization workflows with automated, audit-ready reports that pull directly from your Git and Jira data
- Connect your full SDLC toolchain, including Git, Jira, Linear, CI/CD, HR systems, calendars, and incident management, without stitching data together manually
Ready for a deeper dive?
Jellyfish is trusted by over 700 engineering orgs, including DraftKings, Priceline, and Blue Yonder. Book a demo to see how it can work for your team.
Book a DemoAbout the author
Jellyfish is the leading Software Engineering Intelligence Platform, helping more than 700 companies including DraftKings, Keller Williams and Blue Yonder, leverage AI to transform how they build software. By turning fragmented data into context-rich guidance, Jellyfish enables better decision-making across AI adoption, planning, developer experience and delivery so R&D teams can deliver stronger business outcomes.