In this article
When McKinsey published their 2023 report titled “Yes, you can measure software developer productivity,” developers weren’t having it.
For years, any attempt to measure developer productivity has led to gaming the metrics and frustration all around. Ask developers on Reddit about it, and you’ll find plenty who’ve given up entirely:

(Source: Reddit)
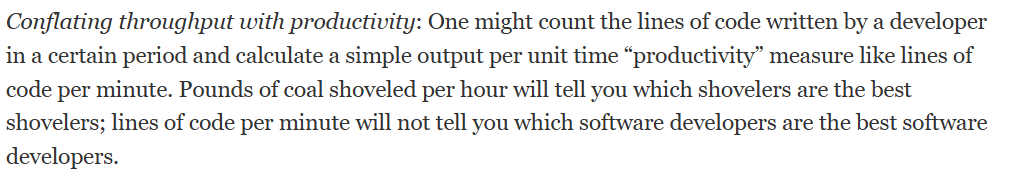
And honestly, they’re right to be skeptical. Traditional metrics like lines of code or tickets closed miss the point entirely. They punish developers who refactor code and reward those who write bloated solutions.
The problem is, engineering leaders still need these numbers. Whether for board meetings or budget decisions, the pressure to measure developer output will only keep growing.
Fortunately, we’ve moved past counting lines of code. Today’s methods measure the entire system — deployment frequency, lead time, and mean time to recovery. They track how fast teams deliver value, not how busy individuals look.
Below, we’ll take a look at what developer productivity looks like today and explain how you can measure it without turning your team against you.
What is Developer Productivity?
What is Developer Productivity?
First, let’s clear up what developer productivity isn’t. It’s NOT about counting lines of code, tracking hours at the desk, or tallying up closed tickets.
For example, a developer who writes 1,000 lines will usually create more problems than one who deletes 500 unnecessary ones.
Google’s research team has been studying this for years, and they’re pretty clear about why traditional metrics don’t work:
(Source: IEEE)
Different organizations define developer productivity in their own ways, but at Jellyfish, we take a systems approach that focuses on outcomes rather than outputs.
Developer productivity is the speed and quality at which development teams deliver reliable software without burning people out along the way.
This system-level thinking has been formalized into an entire discipline known as developer productivity engineering (DPE). These specialized teams optimize the tools, processes, and workflows that help developers do their best work.
The Problem with Measuring Developer Productivity
The Problem with Measuring Developer Productivity
Measuring developer productivity isn’t like tracking widgets on an assembly line.
Software development involves complex, creative problem-solving that doesn’t fit neatly into traditional productivity metrics.
Here’s why it gets so complicated:
- Impact has nothing to do with output: A developer might spend a week tracking down a bug and fix it with one line of code. Another writes 500 lines for a feature that gets scrapped. Traditional metrics would call the second developer more productive, which is exactly why these metrics fail.
- Speed without quality is a trap: Teams can ship features faster by skipping tests or hard-coding solutions. They’ll look incredibly productive this quarter – right until the technical debt catches up and brings everything to a standstill. In fact, research shows that nearly 66% of organizations now ship untested code just to hit their deadlines.
- Software development is a team sport: When three developers mob program a solution, two review the code, and one deploys it, who was “productive”? The best teams share knowledge through reviews and mentoring. Measuring individuals in this environment is like measuring one player’s contribution to a basketball game by counting their touches.
- Gaming metrics is too easy. Tell developers you’re measuring commits, and watch commit counts skyrocket. Measure story points, and estimates inflate overnight. Every metric becomes worthless once people know they’re being measured by it.
- AI assistants broke the old metrics: Developers can now use AI to generate boilerplate, and then focus on architecture. One developer with Cursor might outship three working without it, while writing no original code. And developers who use tools like Copilot complete tasks 55% faster than those who don’t.
The Right Way to Measure Developer Productivity
The Right Way to Measure Developer Productivity
Most teams fail at measuring developer productivity because they approach it wrong from day one. Get these three things right, and the rest falls into place:
1. Focus on Outcomes, Not Just Output
The old way: Teams track how many features they ship, how many story points they complete, and how many tickets they close. The dashboard looks great — velocity is up 20%, the team shipped 15 features last month, and everyone’s busy.
But customer churn keeps rising, and revenue isn’t moving. The gaming starts immediately when teams focus on these metrics, as this engineering lead on Reddit admits:
I’m a lead at my company, and I’ve been heavily pointing all story tickets since management wants to play the velocity game.
The better way: Start measuring what happens after you ship and track how many users use that new feature. Watch if support tickets go down. Three features that customers use every day beat ten features that nobody touches.
First steps:
- Start every feature with a clear success metric. Not “improve user experience” but “reduce checkout abandonment by 15%” or “cut page load time in half.”
- Set up basic adoption tracking. Watch how many users try the feature in week one versus week four. If usage drops off a cliff, you’re on to something.
- Run a monthly review where you look at what you shipped last quarter. Which features moved the needle, and which ones were a waste of time?
- Stop celebrating ship dates and start celebrating impact. When a feature hits its success metric, that’s when you pop the champagne.
2. Measure the System, Not the Individual
The old way: Companies that track commits per developer usually stack rank engineers and tie bonuses to these numbers. Developers respond by gaming the system. They break up commits, inflate estimates, and avoid complex issues that might hurt their metrics.
The better way: Measure how well your entire development system works. Track how long code sits in review, how often deployments fail, and where work gets stuck in your pipeline. When cycle time improves, everyone wins. When deployment frequency increases, the whole team is moving faster.
First steps:
- Start tracking cycle time for your team. If it takes 8 days from first commit to production, that’s your baseline to improve.
- Look at your pull request queue weekly. If PRs regularly sit for more than 24 hours, you need more reviewers or smaller PRs.
- When production breaks, track how long it takes to fix, not who broke it.
- Measure deployment frequency for your team. Whether you deploy daily or weekly depends on your context, but the trend should improve over time.
3. Balance Speed with Sustainability
The old way: Teams chase velocity above everything else. They skip code reviews to ship faster and work overtime to hit quarterly metrics. For a few months, the numbers look amazing. Then, the codebase becomes unmaintainable, bugs multiply, and your best developers quit from burnout.
The better way: Track quality and team health alongside delivery speed. A sustainable pace beats short bursts followed by crashes. Monitor technical debt and developer satisfaction while you measure velocity.
Teams that maintain steady delivery with low defect rates outperform those that sprint and stumble. And remember, team health isn’t just management’s job. This Reddit comment nails it:
Even when you aren’t a manager, you should be looking out for your teammates. You might not realize the effect you have on your direct coworkers.
First steps:
- Track your team’s bug rate and amount of time spent on unplanned initiatives alongside feature delivery metrics to spot when speed comes at too high a cost.
- Survey developers monthly about their workload, stress levels, and confidence in the codebase to spot burnout early.
- Set aside 20% of each sprint for technical debt and improvements. Protect this time like you protect customer deadlines.
- Monitor on-call alerts per week. When they keep climbing, your sustainability is dropping even if the velocity looks good.
Key Frameworks for Measuring Productivity: DORA vs. SPACE
Key Frameworks for Measuring Productivity: DORA vs. SPACE
You don’t need to invent your own productivity metrics from scratch. These two proven frameworks already give you everything you need to measure what matters:
DORA Metrics
Back in 2014, the DevOps Research and Assessment team started tracking thousands of engineering teams to figure out why some teams deploy multiple times per day while others have trouble shipping even once a month.
And after analyzing data from over 32,000 professionals, they outlined four metrics that consistently separate elite performers from everyone else.
Google later validated these metrics through their own research and now treats them as the gold standard for measuring engineering performance:
- Deployment frequency – How regularly does your team push code to production?
- Lead time for changes – What’s the span from code commit to live deployment?
- Change failure rate – How often do your releases cause production problems?
- Time to restore service – When production breaks, how fast do you recover?
What makes DORA different is its system-level perspective. When lead times increase, you investigate pipeline blockers. You don’t blame individual developers.
This approach resonates with developers who’ve been burned by traditional metrics. Even Reddit’s typically skeptical developer community gives DORA positive reviews:

(Source: Reddit)
That said, DORA tells you about delivery performance, not the complete picture. It won’t catch burnout, technical debt accumulation, or whether you’re building the right things.
Still, it’s miles ahead of counting lines of code or story points.
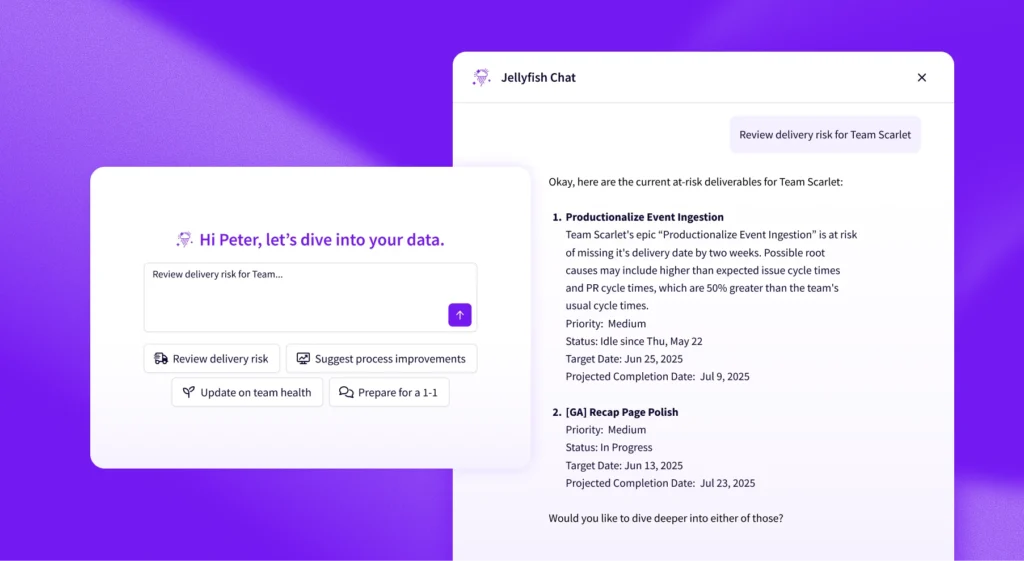
PRO TIP 💡: Jellyfish automatically calculates all four DORA metrics from your existing CI/CD and incident management tools. The platform segments these metrics by team, service, and even individual pull requests. This granular view helps you focus on improvements where they’ll have the biggest impact.
The SPACE Framework
Researchers at Microsoft and GitHub recognized that system-level metrics like DORA only tell part of the productivity story.
So, they developed the SPACE framework to capture the human elements that traditional productivity measurements miss.
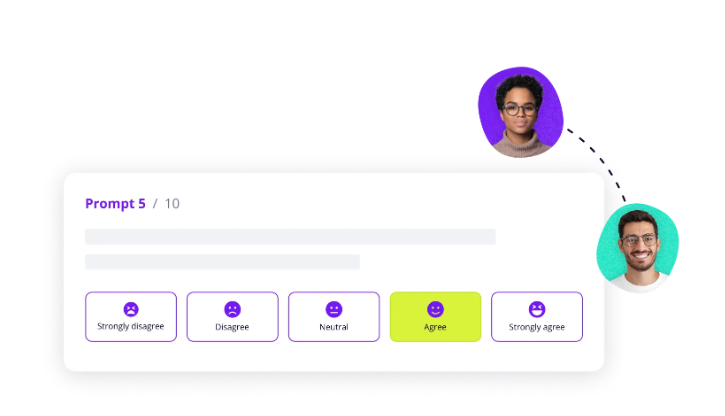
The framework tracks five key dimensions of productivity that influence both what teams ship and how well they function as a unit:
- Satisfaction and well-being – How fulfilled developers feel with their work, team, tools, and culture. Burned-out developers with poor job satisfaction inevitably become less productive over time.
- Performance – How well the software works for users, including system uptime, bug rates, and whether delivered features create genuine value.
- Activity – The count of actions completed in the development process. This covers commits, pull requests, and deployments, but always in the context of the other dimensions.
- Communication and collaboration – How well team members work together, share knowledge, and coordinate efforts.
- Efficiency and flow – The smoothness of the development workflow, measured by how often developers get blocked, interrupted, or forced to switch between different types of tasks.
SPACE metrics fill the gaps that purely technical metrics leave behind, especially around team health and developer experience.
How DORA and SPACE Complement Each Other
Top-performing engineering organizations use both frameworks in tandem.
DORA gives you hard numbers on software delivery performance, while SPACE outlines the human factors that predict whether that performance will last.
Think of DORA as your speedometer and SPACE as your engine diagnostics. You need both to know if you’re heading in the right direction without burning out your team or accumulating technical debt.
The connection between the frameworks is clearer than most people realize, as this developer points out on Reddit:
(Source: Reddit)
The best approach is to start with DORA for baseline delivery metrics, then add 2-3 SPACE dimensions based on your team’s specific issues.
If deployment frequency is dropping, check satisfaction and flow. If failure rates are climbing, look at collaboration and performance. This combination gives you both the symptoms and the diagnosis.
A Deep Dive into Key Developer Productivity Metrics
A Deep Dive into Key Developer Productivity Metrics
Now that you understand the frameworks, let’s look at the specific developer productivity metrics you should track:
Efficiency Metrics: Measuring the Flow of Work
Efficiency metrics track how smoothly work moves through your development pipeline from start to finish. They reveal wait times, friction points, or any other blockers that slow down delivery.
Key efficiency metrics to track:
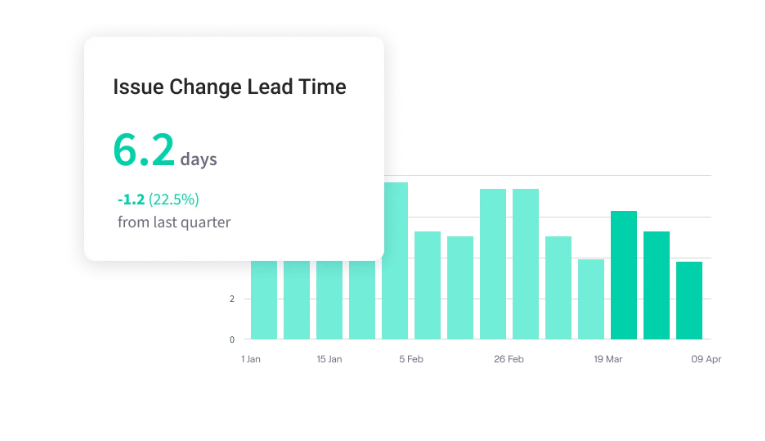
- Lead time: Measures the complete journey from feature request to live production code that customers use. This includes all the waiting before development starts, so it’s your most honest delivery metric.
- Cycle time: Tracks how long developers actively work on code from their first commit until the feature goes live. Shorter cycle times mean your team ships value faster and gets feedback sooner.
- PR review time: Shows how long code sits waiting for someone to review it. If PRs regularly wait days for review, you’ve found your biggest bottleneck.
- Build success rate: Tracks the percentage of builds that pass without failures or errors. Low success rates usually point to unstable development environments that waste developer time with false failures.
Effectiveness Metrics: Measuring the Impact of Work
Effectiveness metrics tell you if your team is building the right things. A team can deploy daily, but if half those deploys get rolled back or features sit unused, something’s wrong. These metrics keep you honest about impact versus activity.
Key effectiveness metrics to track:
- Defect escape rate: Tracks how many bugs reach production and bypass testing. High escape rates mean you’re either moving too fast or your testing strategy needs work.
- Mean time to recovery (MTTR): Measures how fast you fix things when production breaks. Quick recovery times show your team can handle problems without panicking.
- Feature adoption rate: Shows what percentage of users adopt new features after launch. Low adoption means you’re building things nobody asked for.
- Customer-reported bugs: Counts issues that users find before you do. These hurt more than internal bugs because they damage trust and create support tickets.
- Code coverage trends: Tracks whether your test coverage improves or declines over time. Falling coverage today means more production fires tomorrow.
Experience Metrics (DevEx): Measuring the Health of the Team
Experience metrics track how developers feel about their work and whether your environment helps (or hurts) their productivity. Happy developers write better code, stay longer, and solve harder problems.
Key experience metrics to track:
- Meeting load: Hours developers spend in meetings versus coding. When meeting time exceeds 40% of the week, development work suffers.
- Context switching frequency: How often developers jump between projects or get interrupted. Each switch costs 20-30 minutes of recovery time to regain focus.
- Developer satisfaction scores: Regular surveys that ask developers about tools, processes, and workload. Anonymous feedback outlines problems that nobody wants to say out loud.
- Tool satisfaction ratings: What developers think about their development environment and CI/CD pipeline. Bad tools frustrate developers daily and slow everything down.
- Time to first commit: How long new hires take to ship their first code. Long onboarding times mean your setup is too complex or the documentation isn’t clear.
Note: You can also use a developer productivity dashboard to track all these metrics together and get the complete picture of your team’s performance.
Common Developer Pain Points That Kill Productivity
Common Developer Pain Points That Kill Productivity
Every development team faces productivity killers that drain time, energy, and morale. These are the most common pain points that prevent developers from doing their best work:
- Poorly defined project scope: Software development teams burn through sprints building features that stakeholders reject because “that’s not what we meant.” Simple features balloon into complex systems when new requirements appear halfway through development.
- Technical debt and legacy systems: Research shows that teams waste 23-42% of their development time fighting technical debt. Certain parts of the codebase become no-go zones because touching them breaks seemingly unrelated features.
- Collaboration breakdowns: Two developers spend a week solving the same bug because nobody mentioned they were both working on it. Important technical decisions happen in hallway conversations that half the team never hears about.
- No developer autonomy: Over 80% of developers report higher satisfaction with more independence, yet many can’t even choose a library without three approval levels. Experienced engineers stop proposing improvements because management will just override them anyway.
- Endless context switching: Developers never reach flow state because they’re constantly pulled between different projects, meetings, and “urgent” fixes. What should take two hours of focused work becomes a full day of fragmented effort.
- Onboarding complexity: New hires take weeks to push their first code while fighting outdated documentation and broken setup instructions. 63% of remote workers feel more undertrained than their office counterparts during onboarding.
- Impossible timeline expectations: Management cuts developer estimates in half, then acts surprised when things break in production. Teams ship messy code because there’s no time for testing, so it brings technical debt that haunts them for months.
How to Prevent Developer Burnout and Promote Wellbeing
How to Prevent Developer Burnout and Promote Wellbeing
Developer burnout sneaks up on even the best teams when frustration and overwork become the norm.
To prevent developer burnout, you need to manage both the work environment and the human side of engineering.
Here are some best practices you can apply to keep your team healthy and productive:
1. Protect Deep Work and Focus Time
Developers can’t solve complex problems when they’re interrupted every 20 minutes by meetings, Slack pings, and “quick questions.”
This developer shared on Reddit what countless others experience daily:
Even an hour meeting sort of messes up my whole day; it’s extremely difficult. On top of people messaging me and other distractions, I’m not sure how anybody gets anything significant done.
Why it matters: It takes an average of 23 minutes to refocus after an interruption. When developers never reach deep focus, a two-hour task balloons into a full day of fragmented work. Teams that protect focus time ship faster and write better code because developers can think through problems instead of constantly restarting.
3 things you can do today:
- Block out 3-hour “no meeting” zones on every developer’s calendar and treat them as sacred as client meetings. Anyone who tries to book outside of these hours gets redirected to the designated office hours.
- Set up “interrupt budgets” where each developer can only be interrupted 2-3 times per day for non-emergencies. After that, questions wait for standup or scheduled check-ins.
- Turn off Slack notifications during focus blocks and set team expectations that responses can wait 2-3 hours. Unless production is down, it’s not urgent enough to break someone’s concentration.
2. Connect Daily Work to Real Business Impact
Developers spend weeks building features that disappear into the void, never knowing if anyone uses them or if they made a difference. When your work feels pointless, motivation dies fast.
Why it matters: Teams that see real customer feedback care more about quality and edge cases because they’re building for actual people, not tickets. Without this connection, even talented developers become checkbox-tickers who do the minimum to close Jira tasks.
3 things you can do today:
- Tag developers in customer success stories and make sure they see the end result. When a feature ships, show them the actual dashboard the CEO uses or the workflow that saved accounting 5 hours.
- Forward customer feedback directly to the developer who built the feature — the angry support ticket, their bug fix prevented, or the sales email saying a client bought because of their feature.
- Give developers a business outcome metric they can impact, like reducing load time or cutting API costs. They’ll often care more about code quality when they own a real number.
3. Build Technical Debt Into Your Sprint Planning
So many teams treat technical debt like something you’ll fix “when there’s time” between features. That magical free time never appears, and the codebase rots while developers watch helplessly.
Developers feel the burden physically, as one programmer explained:
As a developer, I can feel it in my bones that this tech debt is like a ball and chain around our ankles, making every change slow, painful, and unreliable.
Why it matters: When you budget for cleanup, developers stop sneaking refactoring into feature work and lying about why things take so long. Google saw its biggest productivity jump in five years when it started treating debt like real work with dedicated sprint time.
3 things you can do today:
- Reserve 20% of every sprint specifically for technical debt and protect it like a client deadline. Create a visible debt backlog where developers can add items anytime, then let them choose what to fix.
- Start sprint planning by asking “what’s slowing us down?” and dedicate the first story points to fixing it. If deployment takes 45 minutes, fixing that benefits every single feature you ship afterward.
- Track how much time bugs in legacy code waste and present it as dollar amounts to leadership. “This module cost us $30k in debugging time” gets budget approved faster than “the code is messy.”
4. Create Psychological Safety and Team Autonomy
Developers who fear speaking up about problems become silent witnesses to disasters they saw coming.
When every technical decision needs three approvals and pointing out issues paints you “difficult,” your best engineers either leave or stop caring.
Why it matters: Google’s research found psychological safety was the #1 factor in high-performing teams. High-trust teams fix problems at the source because developers feel safe saying “this won’t work” or “I messed up.” Engineers who control their own technical choices catch issues during development, not during outages.
3 things you can do today:
- Give developers veto power over technically impossible deadlines without asking for detailed justifications. If your senior engineer says it can’t be done in two weeks, believe them instead of asking them to “just make it work.”
- Let developers choose their own tech stack for new projects unless there’s a real business reason not to. Trust them to pick the right tool and don’t force everyone into the same outdated framework.
- Create “experiment tokens” where developers can try new approaches without writing proposals or getting permission. Let them fail fast on small bets and stop following decisions made by someone who left two years ago.
PRO TIP 💡: Jellyfish DevEx surveys give you anonymous, segmented feedback that shows exactly where psychological safety breaks down (by team, tenure, or role). When junior developers rate “I feel safe suggesting improvements” at 3/10 while seniors rate it 8/10, you know there’s a hierarchy problem.
Best Developer Productivity Tools
Best Developer Productivity Tools
All these metrics mean nothing if you don’t have the right developer productivity tools to track them.
Here’s the tech stack that actually moves the needle on engineering performance.
Engineering Intelligence Platforms
Engineering intelligence platforms measure everything from commit frequency to deployment success rates by pulling data from GitHub, Jira, Jenkins, and your other dev tools.
They answer questions like why your two-week sprints always stretch to three weeks, which developers carry the team, and whether code reviews or QA testing cause bigger delays.
Popular tools include:
- Jellyfish: An all-in-one software intelligence platform that unifies data from your entire development stack to pinpoint exactly what’s slowing your team down. Jellyfish tracks developer experience, technical debt impact, and shows exactly which investments improve productivity.
- Cortex: An internal developer portal that centralizes service ownership, documentation, and scorecards. Best for mid-size teams drowning in microservices and need clarity on who owns what.
- DX: Tracks developer sentiment through regular pulse surveys and correlates responses with performance data. Helps you understand if slow delivery comes from bad tools, unclear requirements, or team morale issues.
IDEs and Code Editors
An IDE provides a complete development workspace with built-in compilation, debugging, code analysis, and project management tools specifically built for one or more programming languages.
Modern code editors have similar functionality through language servers and extensions, but they’re lightweight enough to open instantly and run on any machine.
Popular tools include:
- IntelliJ IDEA: JetBrains’ IDE built specifically for Java and Kotlin development with advanced refactoring and code analysis. It’s the go-to choice for 62% of Java developers who need deep language understanding.
- Visual Studio Code: Microsoft’s free code editor that works with any programming language through extensions. Runs fast on modest hardware and integrates Git, terminal, and debugging tools without the overhead of traditional IDEs.
Version Control and Collaboration
Version control platforms track every code change in your system, coordinate between developers, and manage your source code with features that prevent conflicts and preserve history.
Popular tools include:
- Git: The version control system that tracks every change to your codebase and lets multiple developers work without stepping on each other. Creates a history of who changed what and when, plus enables branching for features and rollbacks.
- GitHub: Cloud-based Git hosting with built-in CI/CD, project management, and AI-powered coding assistance. The default choice for open source and teams that want everything in one platform.
Project Management Tools
Project management platforms structure development work through issue tracking, sprint planning, and workflow automation that keeps tasks moving from backlog to production.
They integrate with version control to link commits to tickets, calculate cycle times, and show stakeholders exactly what shipped in each release.
Popular tools include:
- Jira: Atlassian’s comprehensive issue tracking platform with 3000+ integrations and powerful automation. Built for teams that need granular tracking and reporting across multiple projects.
- Linear: A minimalist, lightning-fast alternative to Jira that prioritizes speed and simplicity. Popular with startups that value beautiful design over extensive customization.
- Slack: The messaging platform that replaced email for most dev teams. Organizes conversations into channels and integrates with every tool in your stack for instant notifications.
CI/CD and Build Tools
CI/CD platforms execute automated pipelines that build, test, and deploy code based on triggers like pull requests or scheduled runs.
Build tools handle dependency management, code compilation, and packaging, while CI/CD pipelines orchestrate the entire flow from source code to deployed application.
Popular tools include:
- GitLab CI/CD: All-in-one DevOps platform that combines Git hosting with powerful YAML-based pipelines. Includes built-in security scanning and deployment tools without separate services.
- Jenkins: The open-source automation server with 1800+ plugins for any workflow imaginable. Still, the choice is for teams with complex, custom requirements that SaaS platforms can’t handle.
- Gradle: Build automation that dramatically speeds up compilation through incremental builds and smart caching. It’s a good fit for Java and Android projects where build times can kill productivity.
Debugging and Monitoring
Debugging tools attach to running processes to track execution flow, examine memory states, and see exactly where code breaks during development and testing.
Popular tools include:
- Postman: The API development platform that makes testing and documenting APIs visual and collaborative. Teams can share collections and test suites without writing complex scripts.
- Sentry: Real-time error tracking that shows exactly which users hit bugs and where your code broke. Outlines production issues immediately with smart alerting and granular stack traces.
- Insomnia: A lightweight API client focused on speed and simplicity without Postman’s feature bloat. Perfect for developers who just want to test endpoints without the enterprise overhead.
AI Coding Assistants
AI coding assistants use large language models trained on billions of lines of code to suggest completions, generate functions from comments, and explain complex code blocks in plain English.
Popular tools include:
- GitHub Copilot: An AI pair programmer that recommends entire functions as you type. Most useful for boilerplate code and repetitive patterns, though it struggles with complex business logic.
- ChatGPT: OpenAI’s conversational AI that explains code, debugs errors, and discusses architecture decisions. Great for learning new languages and getting unstuck, but can’t replace human judgment on large projects.
- Manus: An autonomous AI agent that builds complete applications from specifications. Impressive for prototypes, but often needs human intervention to create production-ready code.
Automating the Software Development Lifecycle
Automating the Software Development Lifecycle
Automation in software development sounds great until you realize someone needs to build and maintain all those scripts.
Here’s how to approach automation without creating more problems than you solve:
1. Map Your Team’s Major Time–Wasters
Why this matters: Most teams drastically underestimate how much manual work eats into coding hours. McKinsey found developers waste over 30% of their time on repetitive tasks.
But when you dig into specifics, you’ll see certain processes consume far more time than anyone realizes. That “quick” deployment might actually burn three hours when you count coordination, waiting, and cleanup.
First steps:
- Track what your developers do for one full week using time logs, calendar audits, or simple spreadsheets where they record activities in 30-minute blocks. Monitor both the task and the context switches between tasks.
- Outline any process where developers sit waiting for something else to complete, whether that’s builds running, tests executing, or environments spinning up. Calculate the cumulative wait time across your entire team.
- Document every task that fails frequently and needs rework, from flaky tests that need multiple reruns to deployments that roll back due to configuration errors. Failed work often doubles or triples the time investment.
- Survey developers about their most frustrating daily tasks. These pain points are usually the best automation opportunities because people will naturally adopt solutions that remove daily friction.
PRO TIP 💡: Instead of asking developers to track their time manually (which they’ll hate and probably fake), Jellyfish automatically spots blockers in your SDLC by analyzing how long work sits at each stage. The platform shows you exactly where developers waste time waiting, whether it’s PR reviews taking days or deployments getting stuck in staging.
2. Start Small and Scale Your Automation
Why this matters: Most automation projects die because teams bite off more than they can chew — they build complex systems that break constantly, and developers refuse to use them.
You need quick wins that prove automation works before anyone will trust you with their workflows. Pick one annoying daily task, automate it well, and watch your team start asking what’s next on the menu.
First steps:
- Pick one daily problem that the entire team hates and that you can automate in under two weeks. It should be painful enough that everyone wants it fixed, but simple enough to guarantee success.
- Build your automation with monitoring and metrics from day one so you can prove exactly how much time you’re saving. Track success rates and how often developers use the automation versus doing things manually.
- Run your automation alongside manual processes for two weeks before you force anyone to switch. This buffer period helps you find edge cases and lets developers trust the new system while they still have the old one as backup.
- Scale up slowly and only tackle complex workflows after your simple automations run perfectly for a full month. Build from single tasks to complete workflows, and use the skills and tools your team mastered on easier projects.
3. Maintain and Monitor Your Automated Workflows
Why this matters: Broken automation is worse than no automation. Most teams treat automation as “set and forget” until it fails during deployment or blocks the entire team’s workflow.
Your automation needs the same care as production code. That means version control, monitoring, regular updates, and clear ownership for when things break during the night.
First steps:
- Monitor your automation like you monitor production systems with alerts for failures, performance drops, and unusual patterns.
- Store all automation scripts in version control and demand code reviews for changes just like you do for application code. This prevents one person’s “quick fix” from breaking workflows that other developers depend on daily.
- Schedule monthly reviews of your automation metrics to outline what needs updates, what nobody uses anymore, and what causes the most failures.
- Create runbooks for common automation failures that anyone can follow, even if they didn’t build the original system. Include diagnostic steps and quick fixes so junior developers can manage issues without escalating.
How to Improve Developer Productivity: 9 Actionable Tips
How to Improve Developer Productivity: 9 Actionable Tips
Knowing how to improve developer productivity isn’t about one big change. You need to stack small wins that compound over time.
Here are nine tips you should implement right away:
- Optimize your IDE setup: A well-configured IDE saves developers hours through automated tasks, intelligent code completion, and instant error detection. Standardize team settings and teach shortcuts that replace manual work.
- Master command line basics: Developers who know their terminal complete tasks in seconds that take GUI users minutes, from batch file operations to complex text processing. You can also create team-specific aliases for common workflows.
- Protect work-life boundaries: Burned-out developers make more mistakes, solve problems more slowly, and eventually leave for companies that respect their time. Make sure to set clear expectations about work hours and see to it that developers take vacation without guilt (or a laptop).
- Plan before you code: Developers who jump straight into coding often build the wrong solution or realize halfway through that their approach won’t scale. You can break features into testable chunks and run quick design reviews to spot architectural issues before anyone writes code.
- Try to prevent developer burnout: 83% of developers experience burnout, so you need proactive strategies before productivity crashes and people quit. Rotate stressful tasks like on-call duties and create psychological safety where developers can say no to unrealistic demands.
- Replace “process theater” with real agility: Agile teams can ship working software frequently and adapt based on feedback, not endless meetings and ceremonies. Keep backlogs clean, time-box work to force decisions, and get user feedback early before you waste time on features nobody wants.
- Set achievable deadlines: Impossible timelines force developers to skip testing and accumulate technical debt that makes every future feature harder to build. You should add a 20-30% buffer time for the unexpected and clearly communicate trade-offs when deadlines can’t move.
- Support developer growth: Teams that invest in learning keep their best developers and attract new talent who want to grow. Set aside work hours for skill development, teach core concepts over trendy frameworks, and run sessions where developers share what they learn.
- Match projects to developer skills: Developers ship better code faster when they work on projects that match their skills and interests. Map what each person does best, let them choose projects when possible, and balance growth opportunities with productivity needs.
PRO TIP 💡: Jellyfish’s team health metrics help you spot which developers are struggling before they burn out by tracking individual workload, focus time, and impact. Use this data to guide 1:1s with concrete examples of their contributions.
How AI Is Reshaping Developer Productivity (& What’s Next)
How AI Is Reshaping Developer Productivity (& What’s Next)
AI is changing the way developers work, and learning how to implement AI for developer productivity is quickly becoming a priority.
Here’s a breakdown of what’s happening right now and what to expect in the near future:
AI’s Biggest Wins for Developer Productivity
If AI does one thing brilliantly, it’s automating the repetitive grunt work that eats up hours every week.
Every project has the same repetitive needs — database access layers, form validations, error messages, and configuration files that barely change between applications.
AI generates this routine code in seconds, from complete REST endpoints to standard unit tests to API documentation. That’s hours you get back every week to work on the complex features and tricky bugs that need human intelligence.
Here’s how one developer described the impact on their workflow:
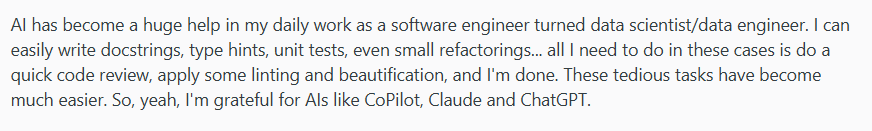
(Source: Reddit)
And repetitive tasks are only part of what AI handles well:
- Faster code generation and refactoring: AI tools translate code between languages and clean up messy legacy systems that would take hours to refactor manually. Developers report that AI helps them write better code faster, though you still need to understand what it produces.
- Accelerated developer learning: Junior developers get instant access to senior-level patterns and best practices, with 71% saying AI speeds up their learning. Teams waste less time asking each other about old code or unfamiliar tools.
- Quick test generation and error analysis: AI generates complete test suites with edge cases that developers often forget, plus it reads cryptic error messages and recommends specific fixes. It recognizes error patterns from millions of examples and points you directly to the problem.
- Improved developer satisfaction: AI-powered IDEs predict what you need and autocomplete complex configs automatically. Developers who use AI are twice as likely to feel fulfilled at work, and 87% of them say that it saves mental energy for real problem-solving.
Just remember that AI code needs careful review every time. The tools spot patterns brilliantly, but they lack context about your architecture.
Because of this, they might suggest old approaches or even write code with security holes.
Common AI Pitfalls That Waste More Time Than They Save
AI tools can become productivity killers when developers trust them too much or use them for the wrong tasks. Here are some common pitfalls to watch out for:
- Blindly accepting code without review: AI often confidently writes code using insecure patterns or approaches that clash with your architecture. You’ll spend more time fixing these issues in production than you saved by using AI in the first place.
- Debugging AI’s confident mistakes: When AI generates subtly wrong code with complete confidence, developers waste hours trying to figure out why something that “should” work doesn’t. The code looks right, passes basic tests, but fails in production for reasons AI never considered.
- Using AI for architectural decisions: AI can’t understand your system’s broader context, so it might recommend solutions that work in isolation but break everything else.
- Trusting AI explanations for complex systems: AI sounds convincing when it explains complex code, but it doesn’t know the business reasons behind the design decisions. This hurts junior developers the most. They learn incorrect approaches from AI and take months to break these bad habits.
So, while AI can bring amazing benefits to your developers, you still need skilled team members to steer the ship. Here’s how this Reddit developer explains it:
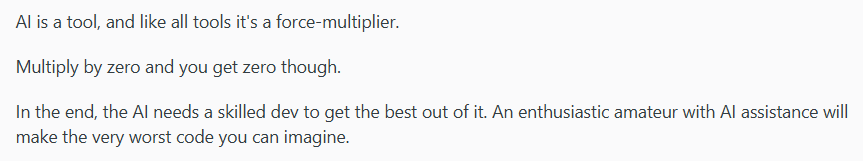
(Source: Reddit)
This should give developers confidence. AI won’t replace you if you know how to use it. Learn to work with it, and you’ll be unstoppable.
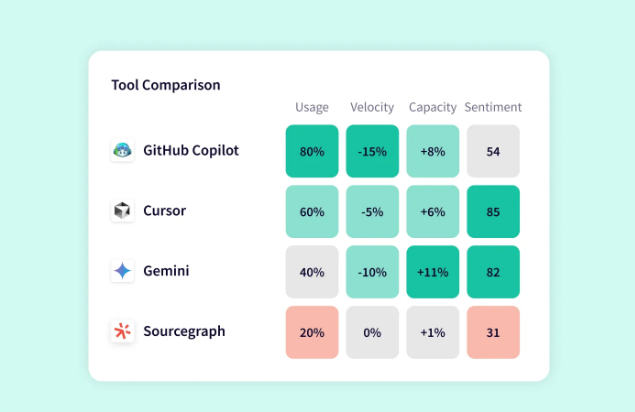
PRO TIP 💡: Jellyfish’s AI Impact dashboard tracks exactly which developers are using AI tools like Copilot, Cursor, or Gemini, how often they’re accepting suggestions, and whether it’s actually speeding up their delivery.
What’s Coming Next for AI-Powered Development
Sure, today’s tools have their quirks. You’ll spend time tweaking prompts to get what you want. The code output often needs serious cleanup.
But these tools improve noticeably every few months, and the trajectory is clear. Research shows that 81% of developers already work faster with AI, despite its rough edges.
Here are some things that the next wave might bring:
- Whole-codebase intelligence: AI today works file by file. Soon, it’ll see the big picture and track dependencies across your stack, flag dangerous changes early, and know exactly how your services interact.
- Autonomous development agents: We’re moving toward AI agents that own entire workflows. Tell them to fix a bug, and they’ll find it, patch it, write the tests, and prep your pull request. No more babysitting every step.
- Unified context awareness: Future AI will read your specs, your mockups, and your code as one unified picture. It’ll catch when your implementation drifts from what product managers wanted, before anyone wastes a sprint building the wrong thing.
McKinsey thinks developers will get three hours back each day by 2030. That’s a whole morning every day to solve actual problems instead of formatting JSON responses.
Measure and Optimize Developer Productivity with Jellyfish
Measure and Optimize Developer Productivity with Jellyfish
You now understand how to measure developer productivity the right way. DORA metrics, SPACE dimensions, cycle times — it all makes sense on paper.
Now, who’s going to build the dashboards, maintain the integrations, and convince developers to accurately log their work? Unless you want a full-time data analyst just for engineering metrics, you need a better approach.
This is exactly the problem Jellyfish was built to solve.
Jellyfish is a software engineering intelligence platform that integrates with your development stack (Jira, GitHub, Slack, etc.). It automatically shows you how engineers spend their time, what’s blocking progress, and how much time goes to roadmap features versus bugs and technical debt.
Here’s specifically how Jellyfish helps you measure and improve developer productivity:
- Get DORA metrics automatically: Deployment frequency, lead time, change failure rate, MTTR — Jellyfish pulls these straight from your CI/CD pipeline. No custom dashboards, no manual calculations, just instant benchmarks that show how you stack up.
- Measure AI tool impact with hard data: Your company invested in GitHub Copilot and other AI assistants, but are developers shipping faster? Jellyfish tracks adoption rates and the concrete productivity gains (or lack thereof) from your AI investments.
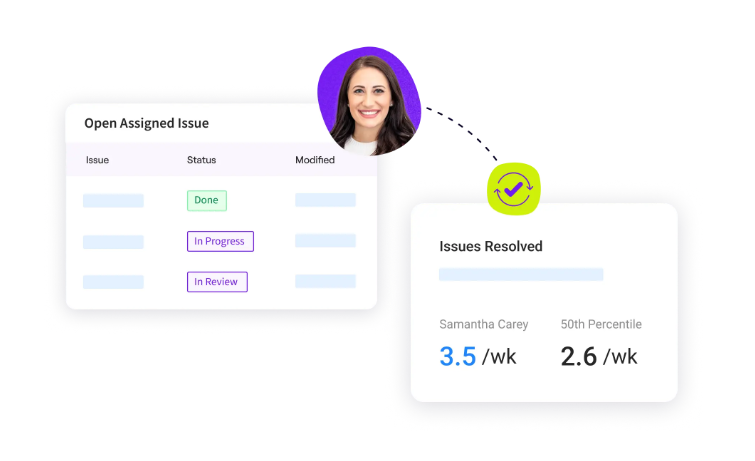
- Track where engineering time goes: Jellyfish shows you the real breakdown on how many hours go to new features versus bug fixes, support tickets, and technical debt. You’ll make better promises to stakeholders once you know how much capacity goes to keeping systems running smoothly.
- Make technical debt impossible to ignore: You can see exactly how much capacity goes to maintaining legacy code versus building new features. When executives see the actual hours lost, that refactoring work suddenly becomes a priority.
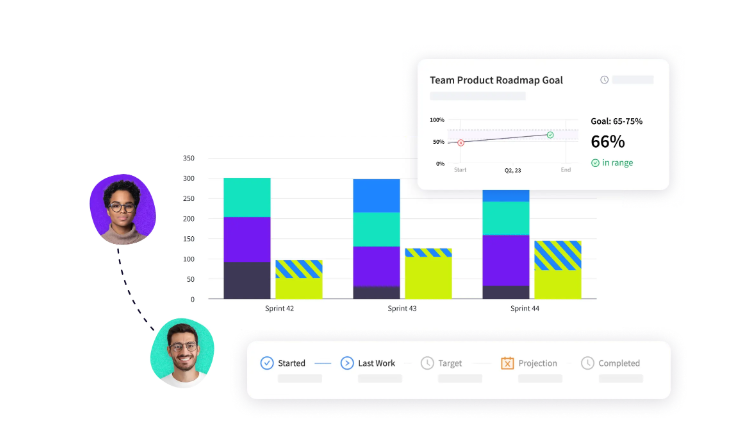
- Turn “it’ll take two weeks” into accurate timelines: Jellyfish uses your team’s actual velocity data to forecast realistic delivery dates. When stakeholders push for more features, you’ll have the numbers to show exactly what gets delayed.
- Spot burnout risks before developers quit: The platform flags when engineers are working on too many projects, drowning in meetings, or constantly switching contexts. You’ll know who’s overloaded weeks before they update their LinkedIn profile.
- Replace conflicting narratives with unified data: No more situations where engineering says they’re blocked, product says everything’s fine, and executives are blindsided by delays. Jellyfish gives every stakeholder the same real-time view of what’s happening.
You could spend months building custom dashboards that break whenever GitHub changes its API.
Or, you could get Jellyfish running in a week and start improving your team’s productivity right away.
Book a demo and see which path makes more sense.
FAQs about Measuring Developer Productivity
FAQs about Measuring Developer Productivity
What if developers resist being measured?
Developers resist when metrics are used to punish or stack-rank them. You need to focus on measuring the system, not individual performance.
When developers see metrics helping them get better tools and more realistic deadlines, they’ll want to see the data.
How do we get developer buy-in for measurement?
Share the metrics with developers first and let them use the data to streamline their own workflows. Show them how metrics defend against unrealistic deadlines and justify time for technical debt.
Most importantly, never use productivity data for performance reviews. The moment you do, the metrics become worthless.
How often should we measure developer productivity?
Track operational metrics like cycle time and deployment frequency continuously. They should update in real-time dashboards. For developer surveys and customer satisfaction scores, monthly or quarterly works best.
You want enough data to spot trends without survey fatigue turning your developers against the whole process.
Learn More About Developer Productivity
Learn More About Developer Productivity
- What is Developer Productivity Engineering (DPE)?
- 9 Common Pain Points That Kill Developer Productivity
- How to Improve Developer Productivity: 16 Actionable Tips for Engineering Leaders
- Automation in Software Development: The Engineering Leader’s Playbook
- 29 Best Developer Productivity Tools to Try Right Now
- 21 Developer Productivity Metrics Team Leaders Should Be Tracking
- AI for Developer Productivity: A Practical Implementation Guide
- How to Build a Developer Productivity Dashboard: Metrics, Examples & Best Practices
- Developer Burnout: Causes, Warning Signs, and Ways to Prevent It
- 10 Peer Code Review Best Practices That Turn Good Developers Into Great Ones
- Mitigating Context Switching in Software Development
About the author

Lauren is Senior Product Marketing Director at Jellyfish where she works closely with the product team to bring software engineering intelligence solutions to market. Prior to Jellyfish, Lauren served as Director of Product Marketing at Pluralsight.